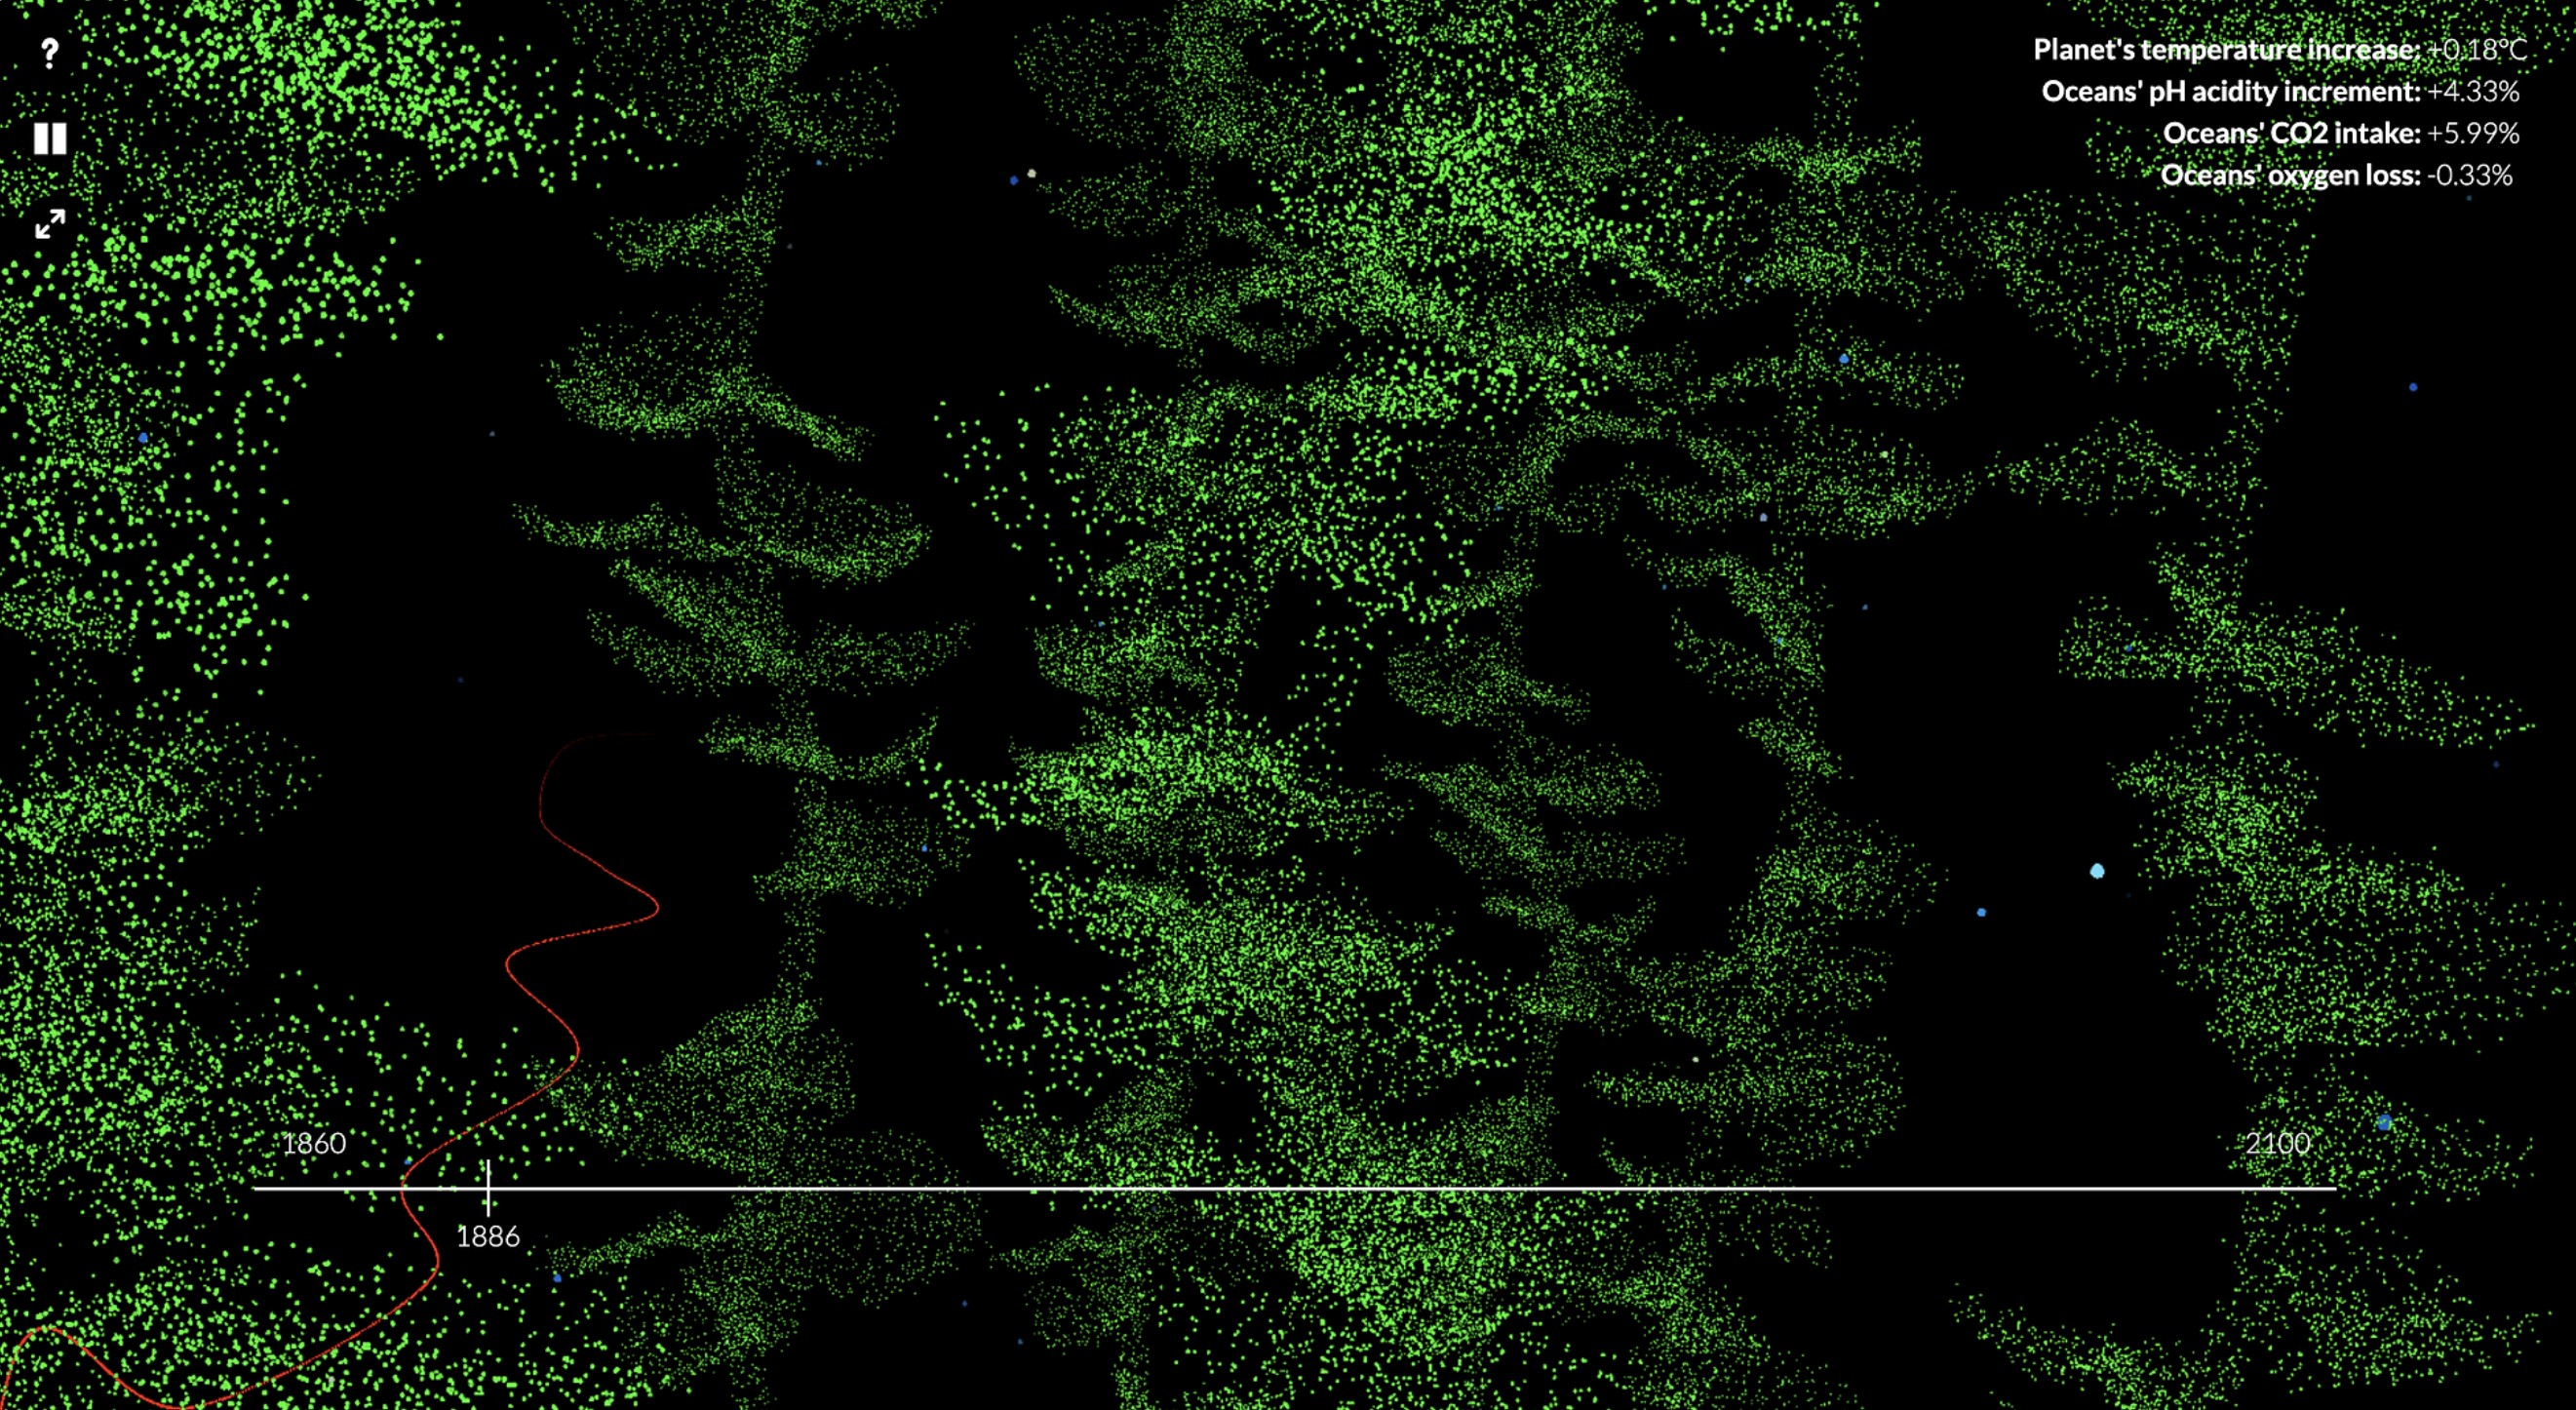
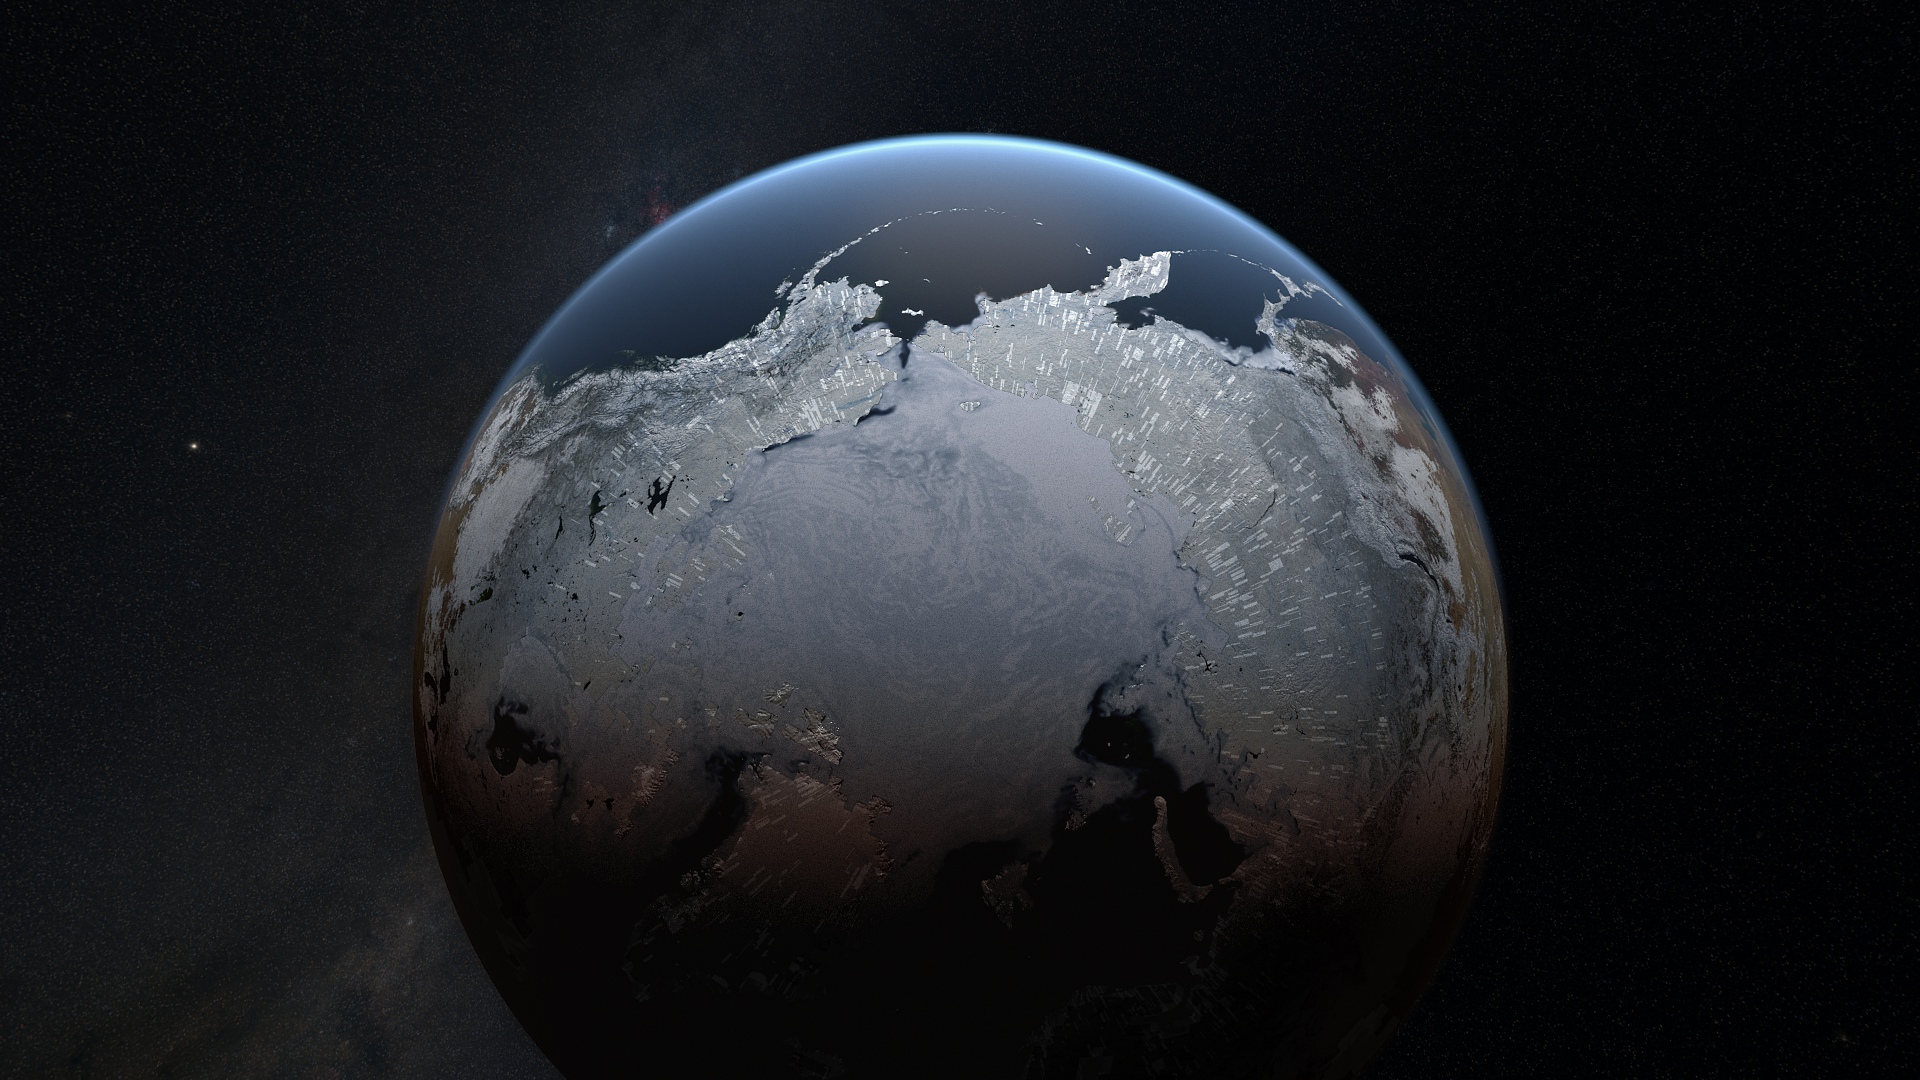
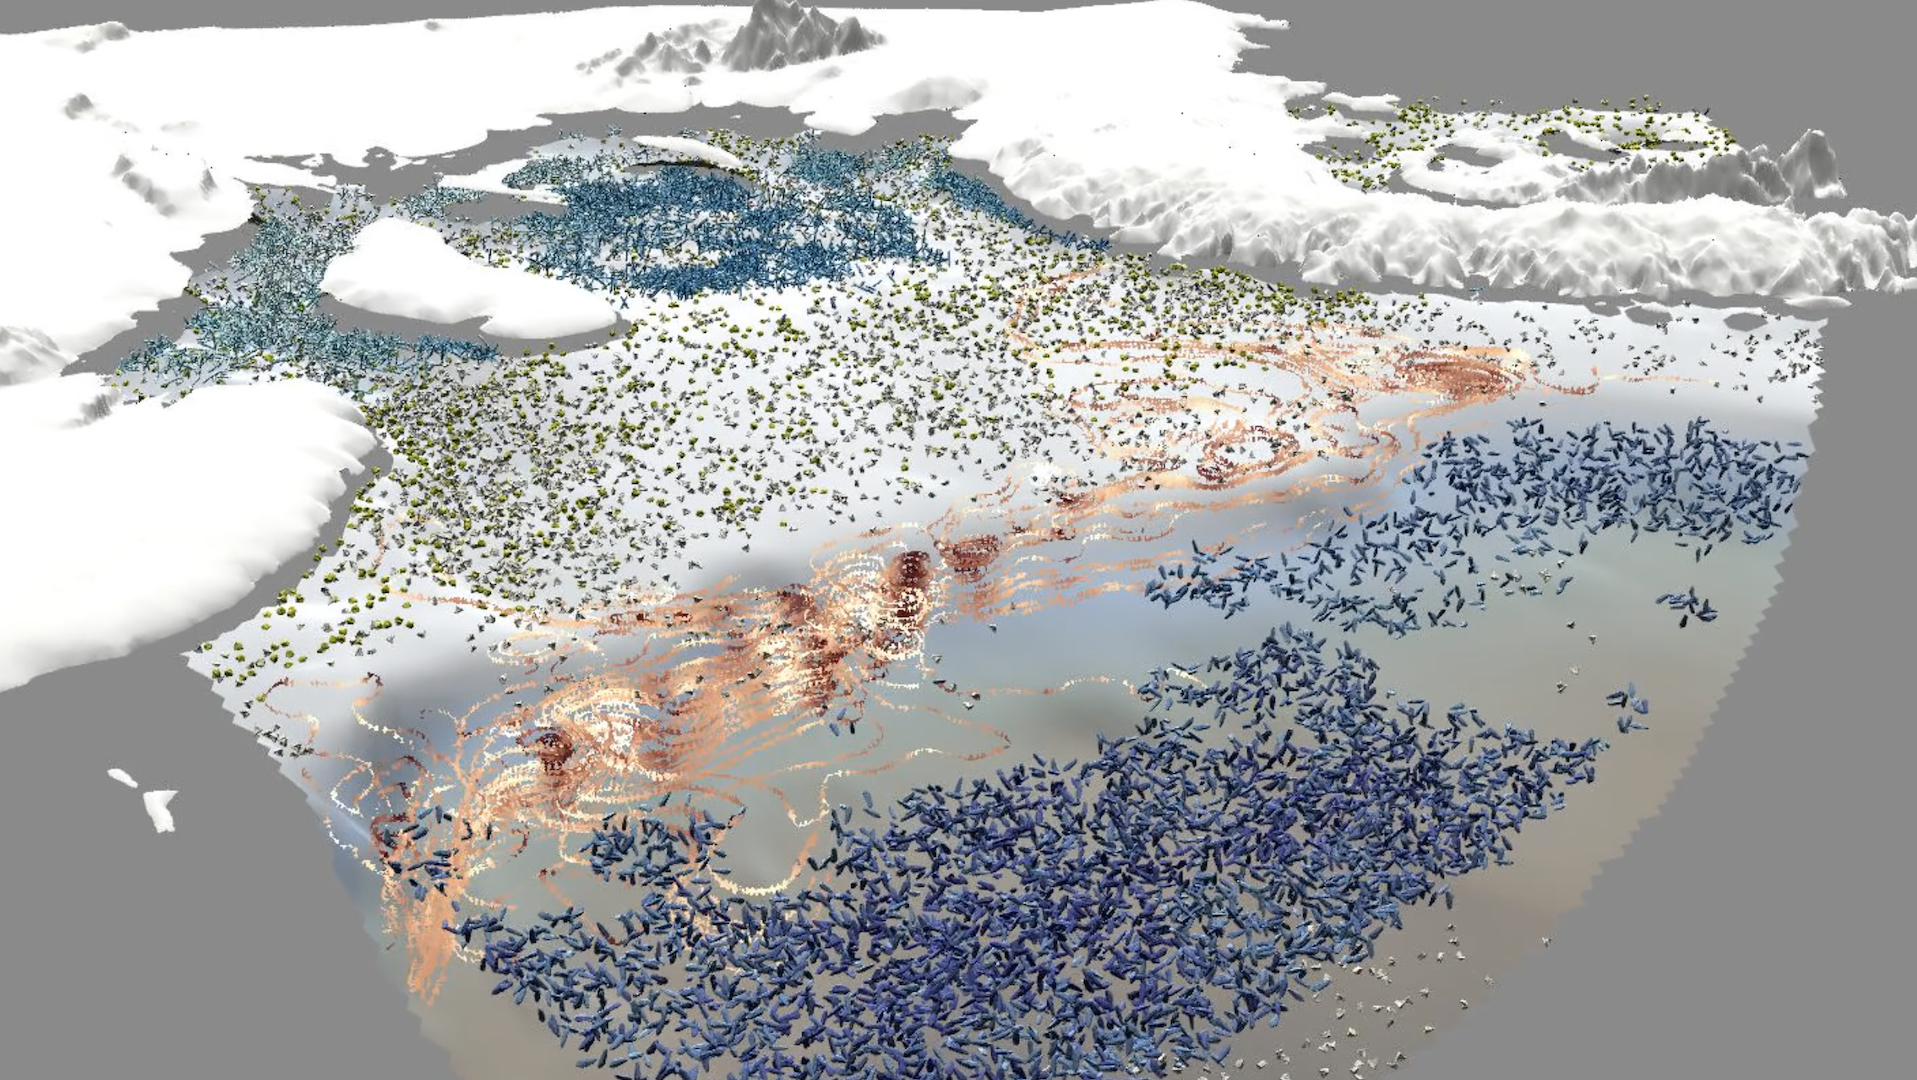
Diving into Acidifying Ocean
Cristina Tarquini and Google Arts and Culture
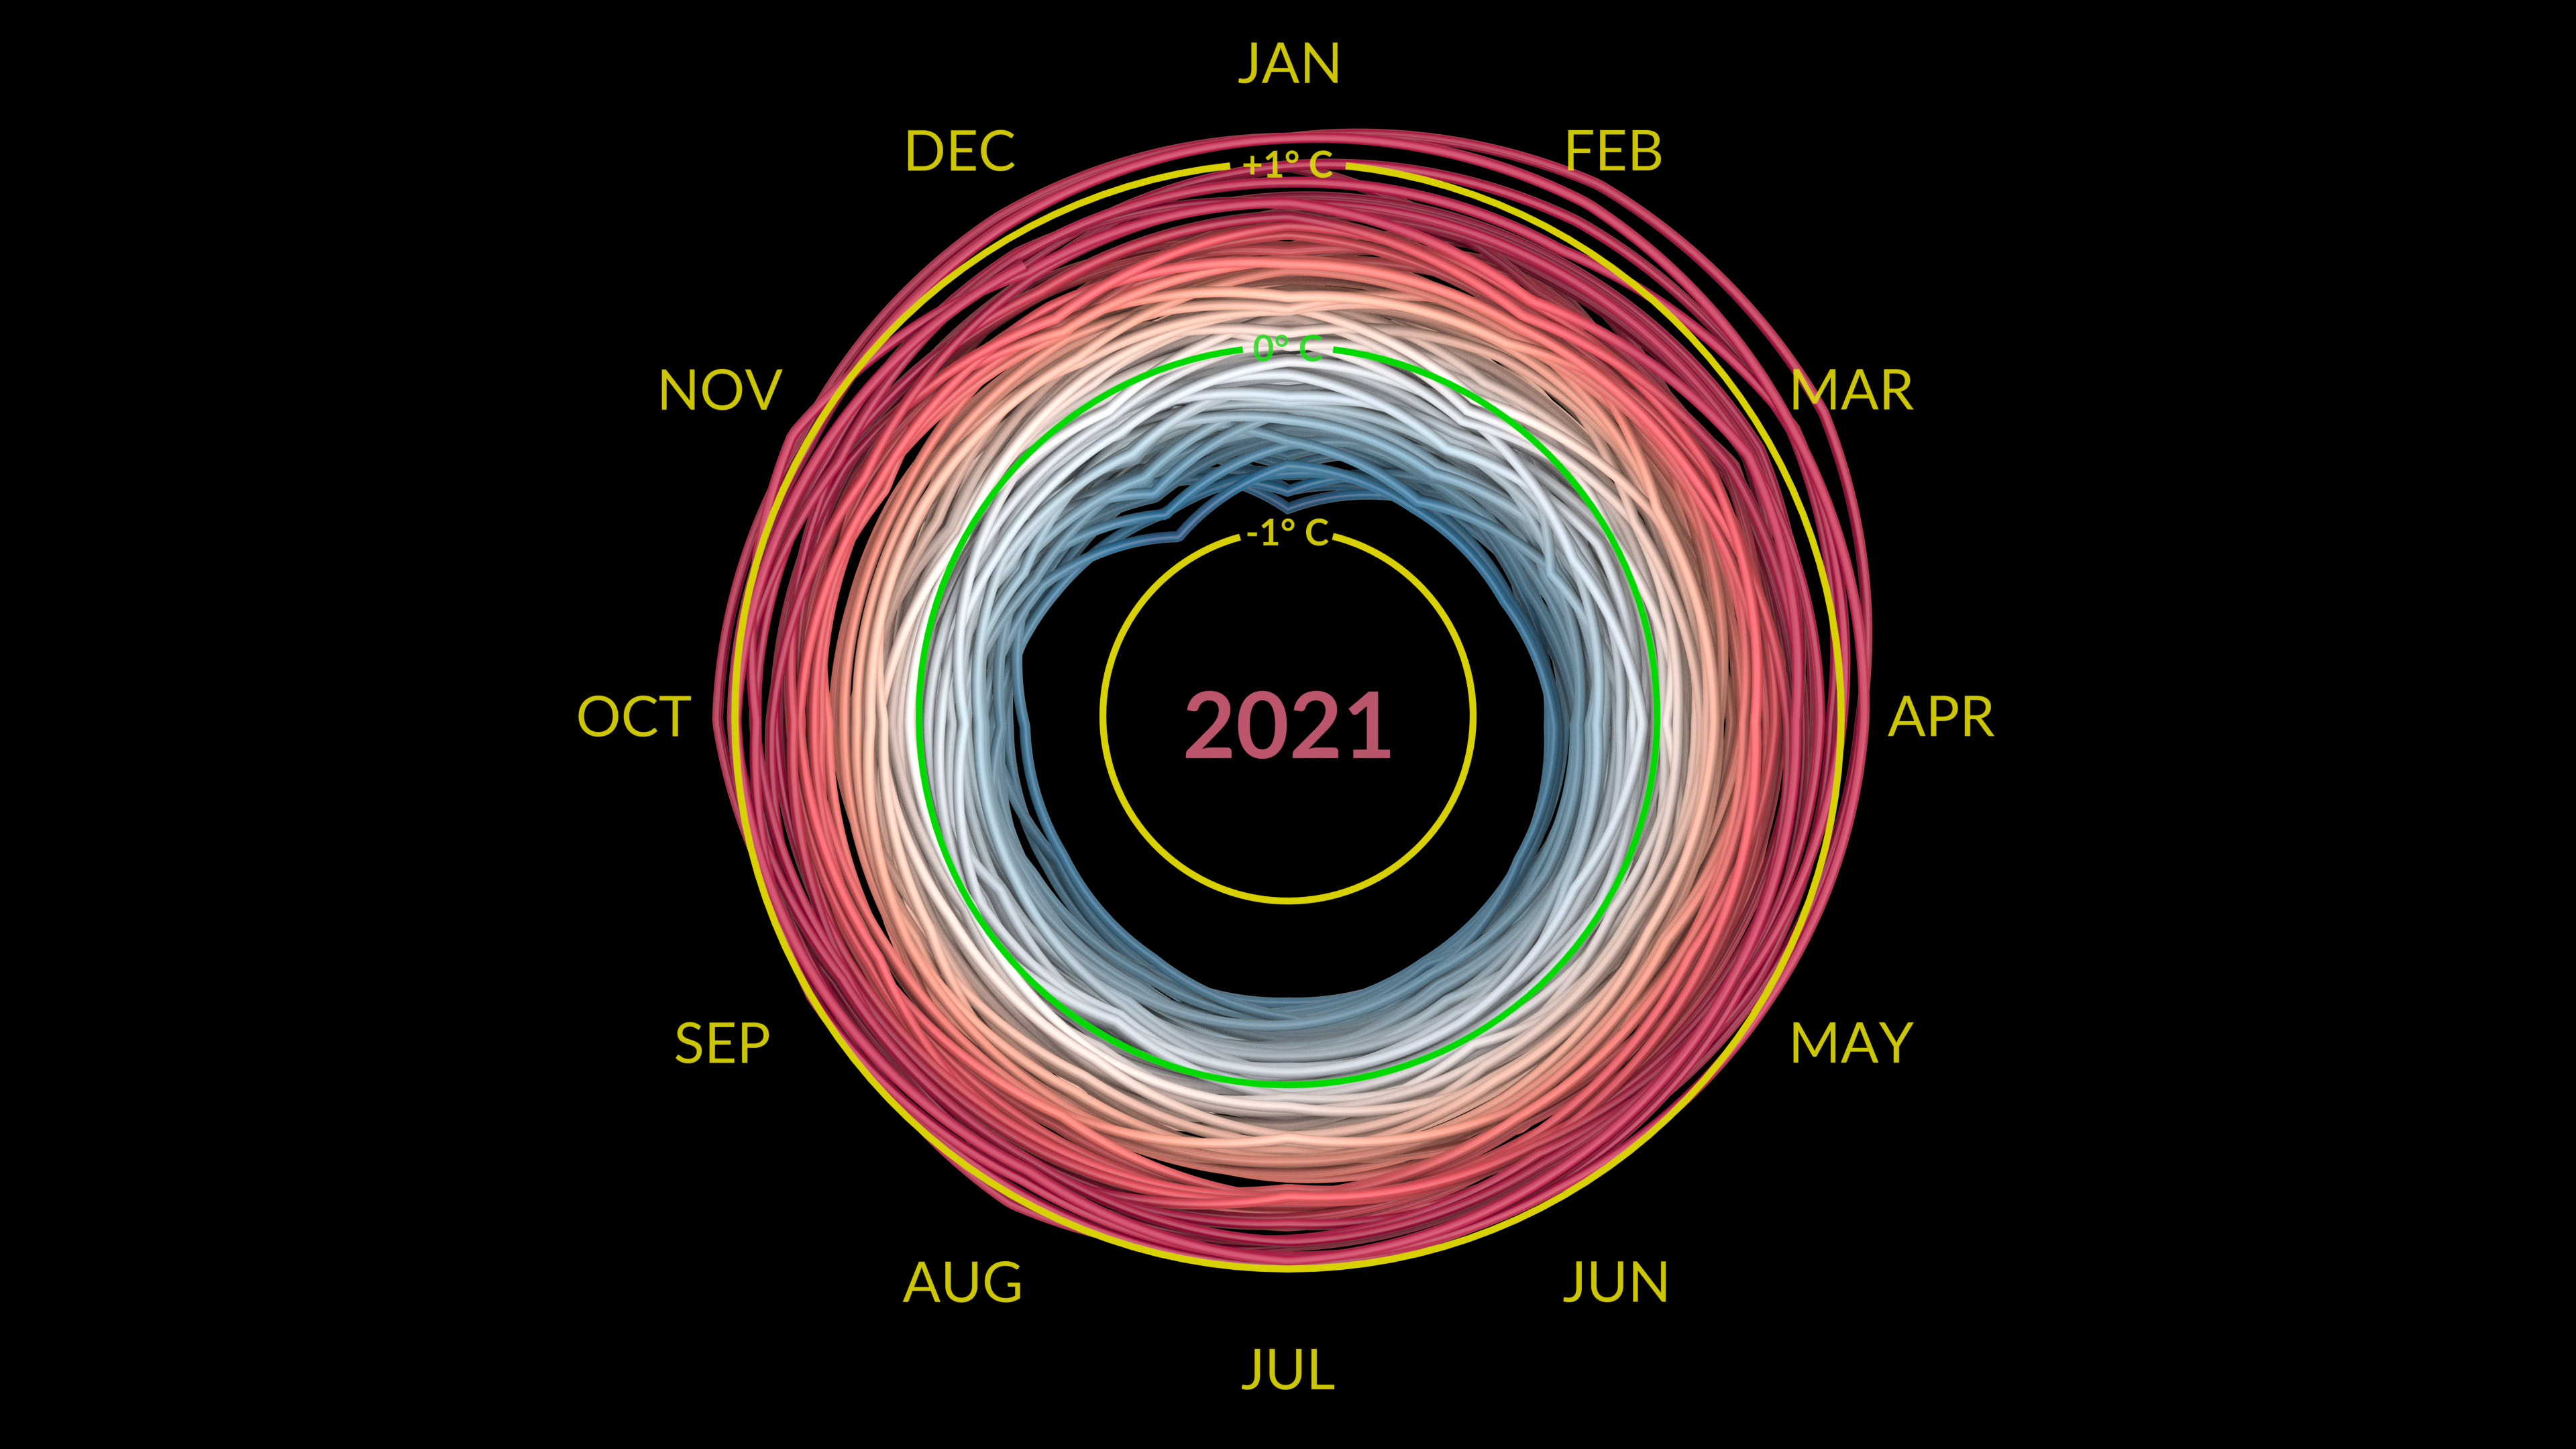
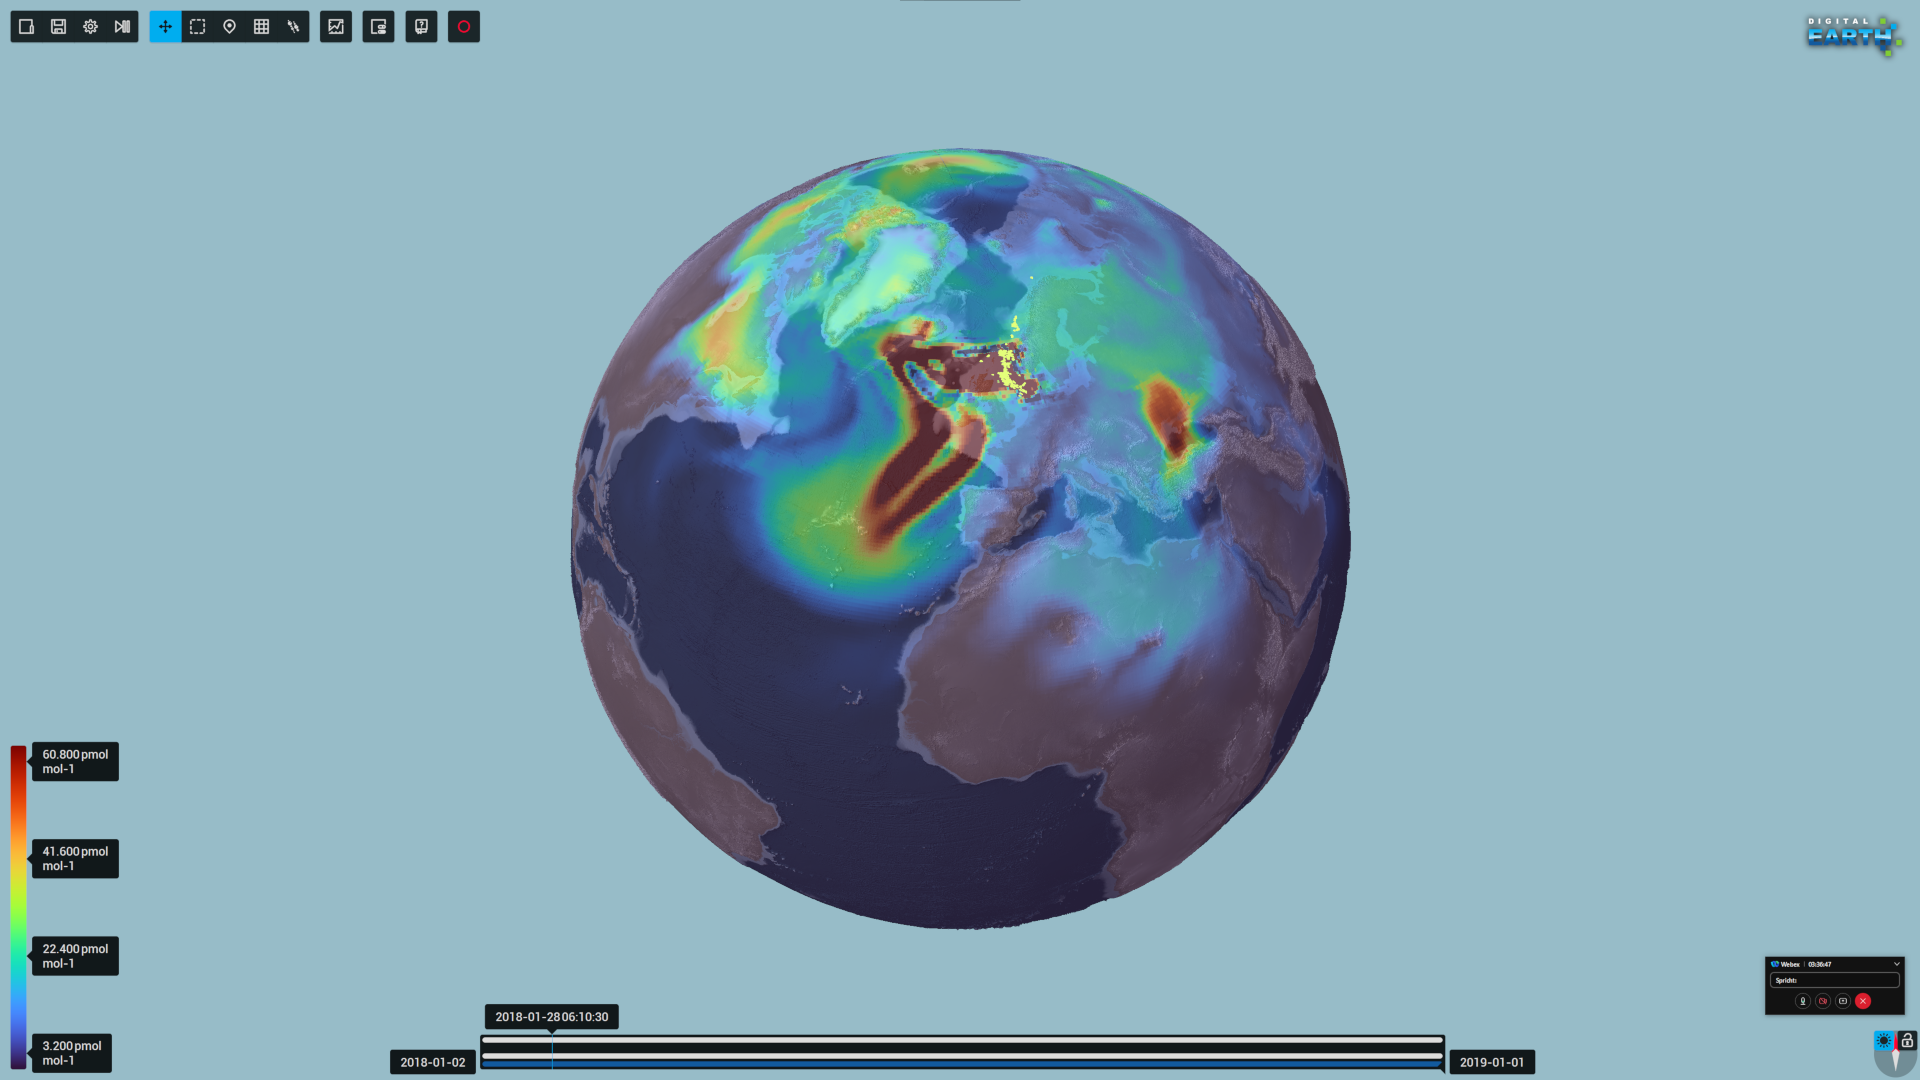
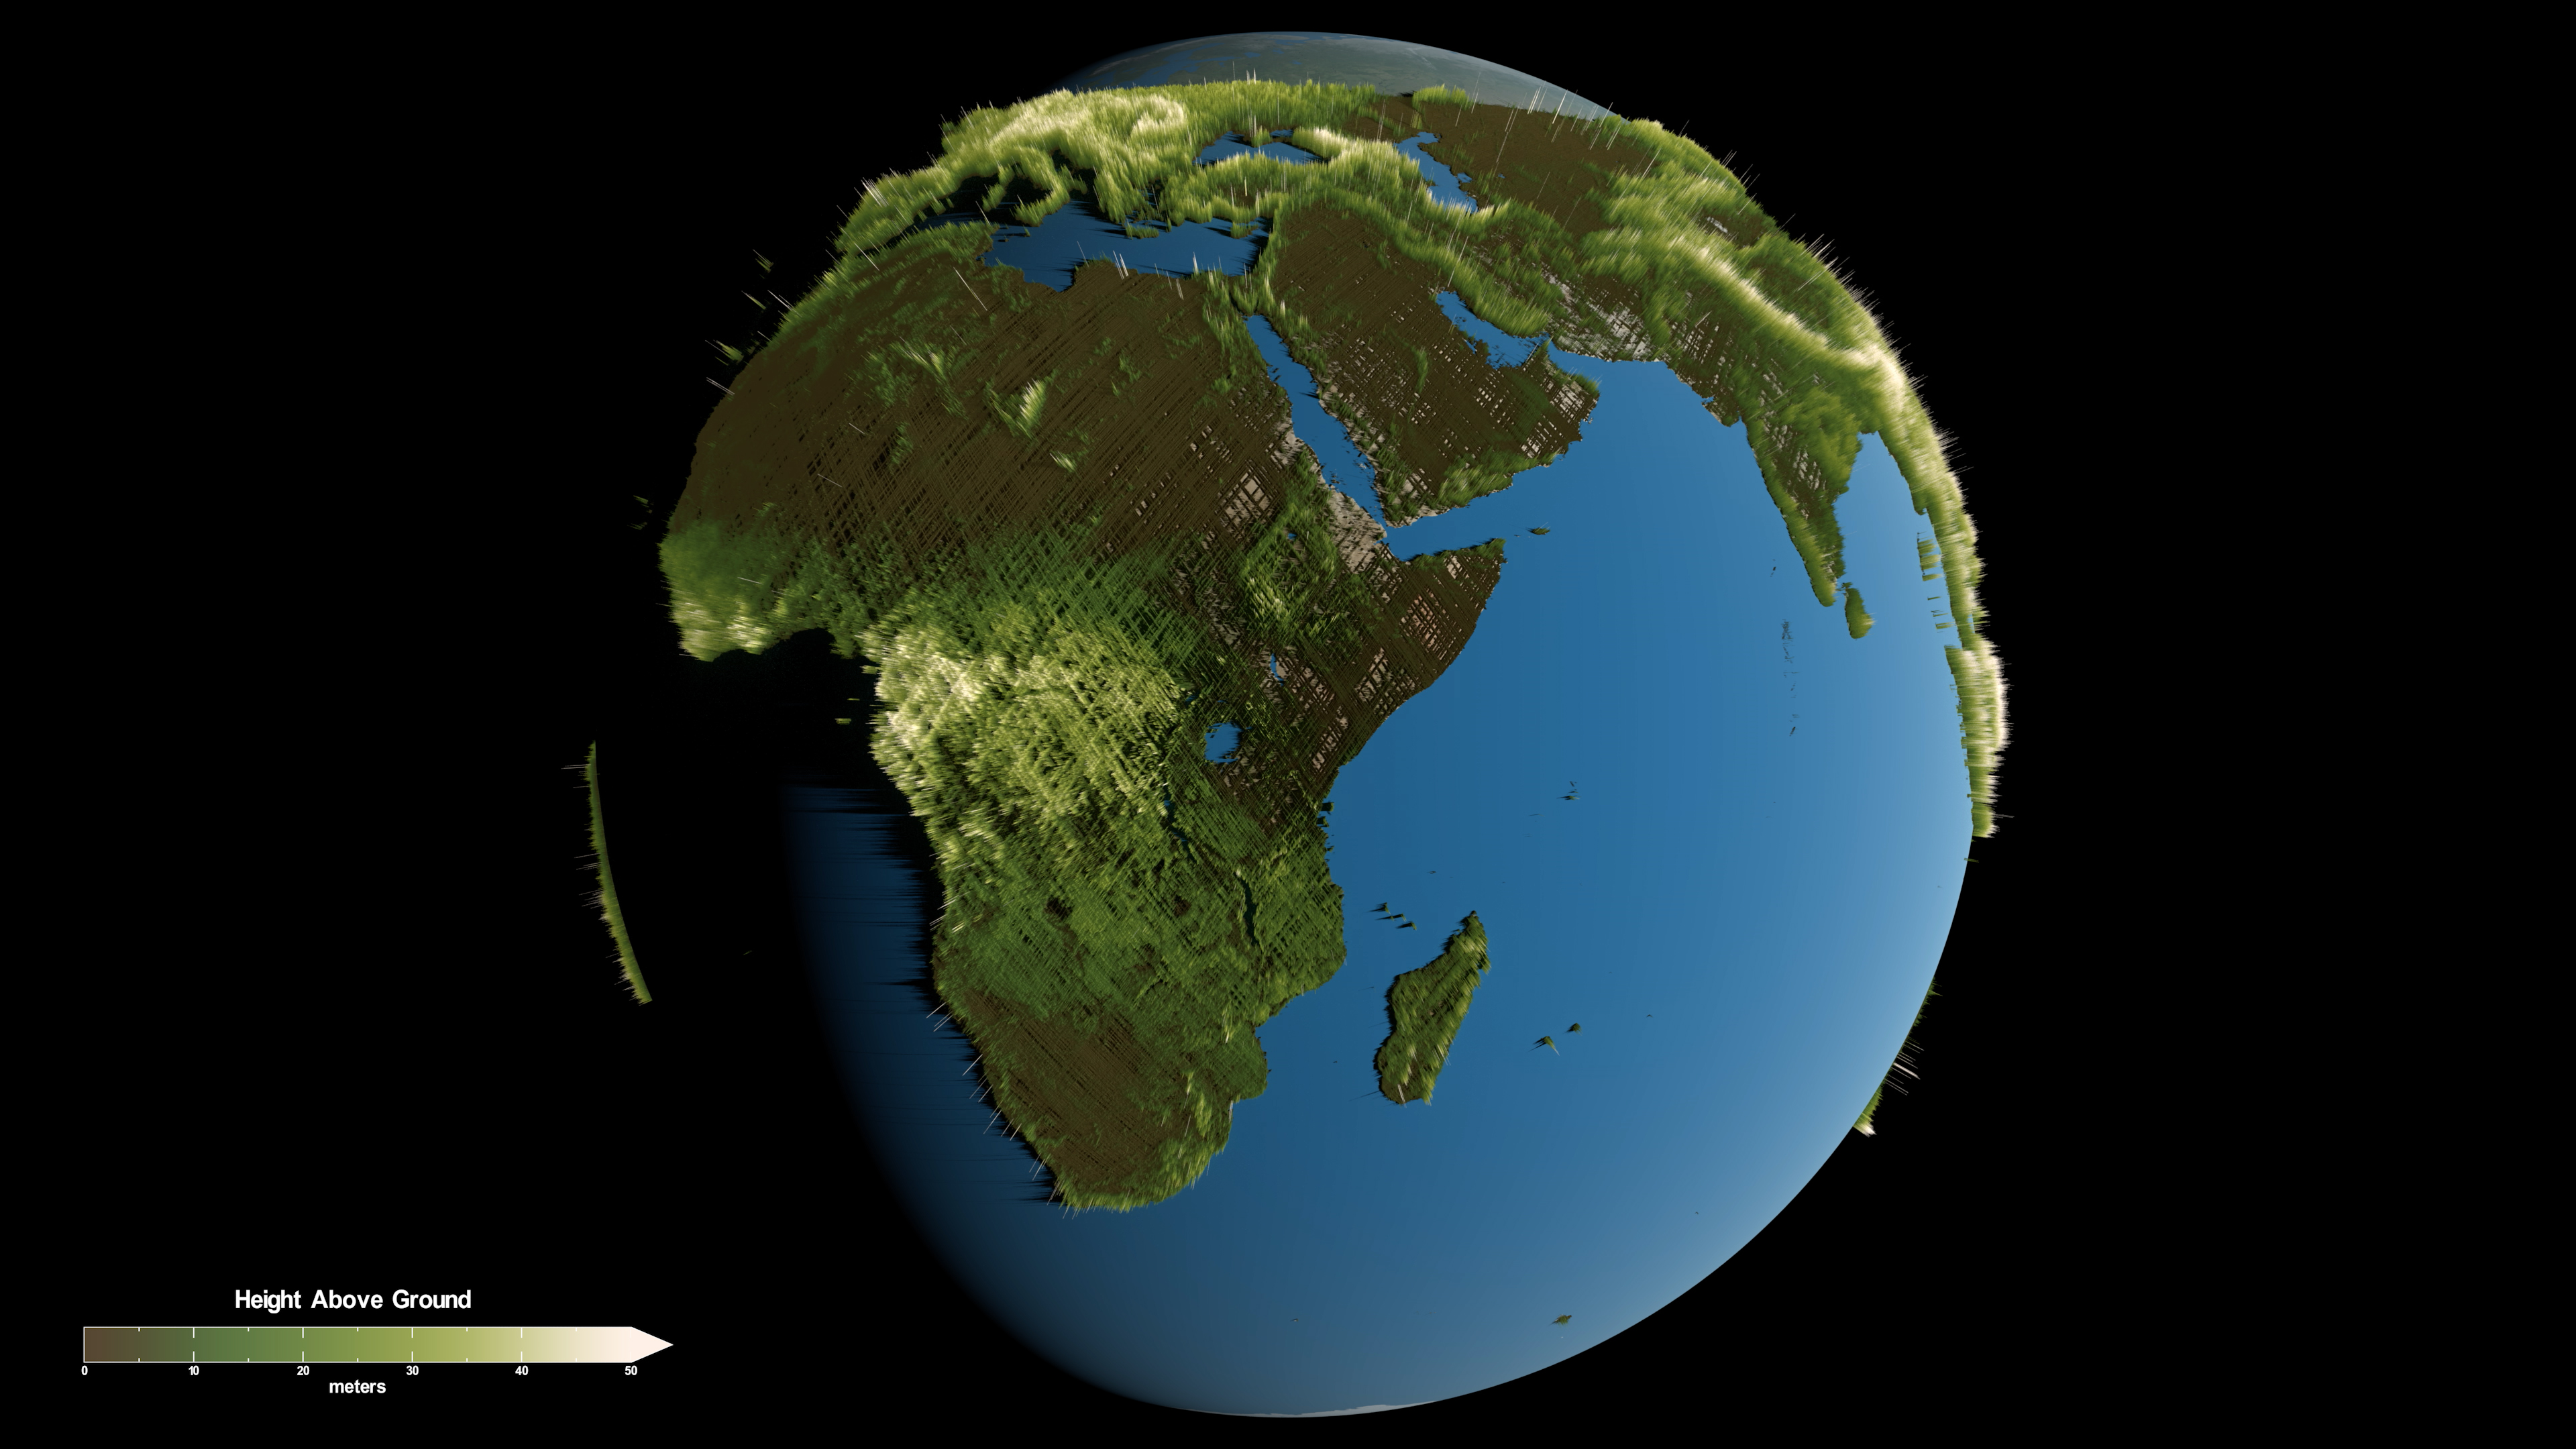
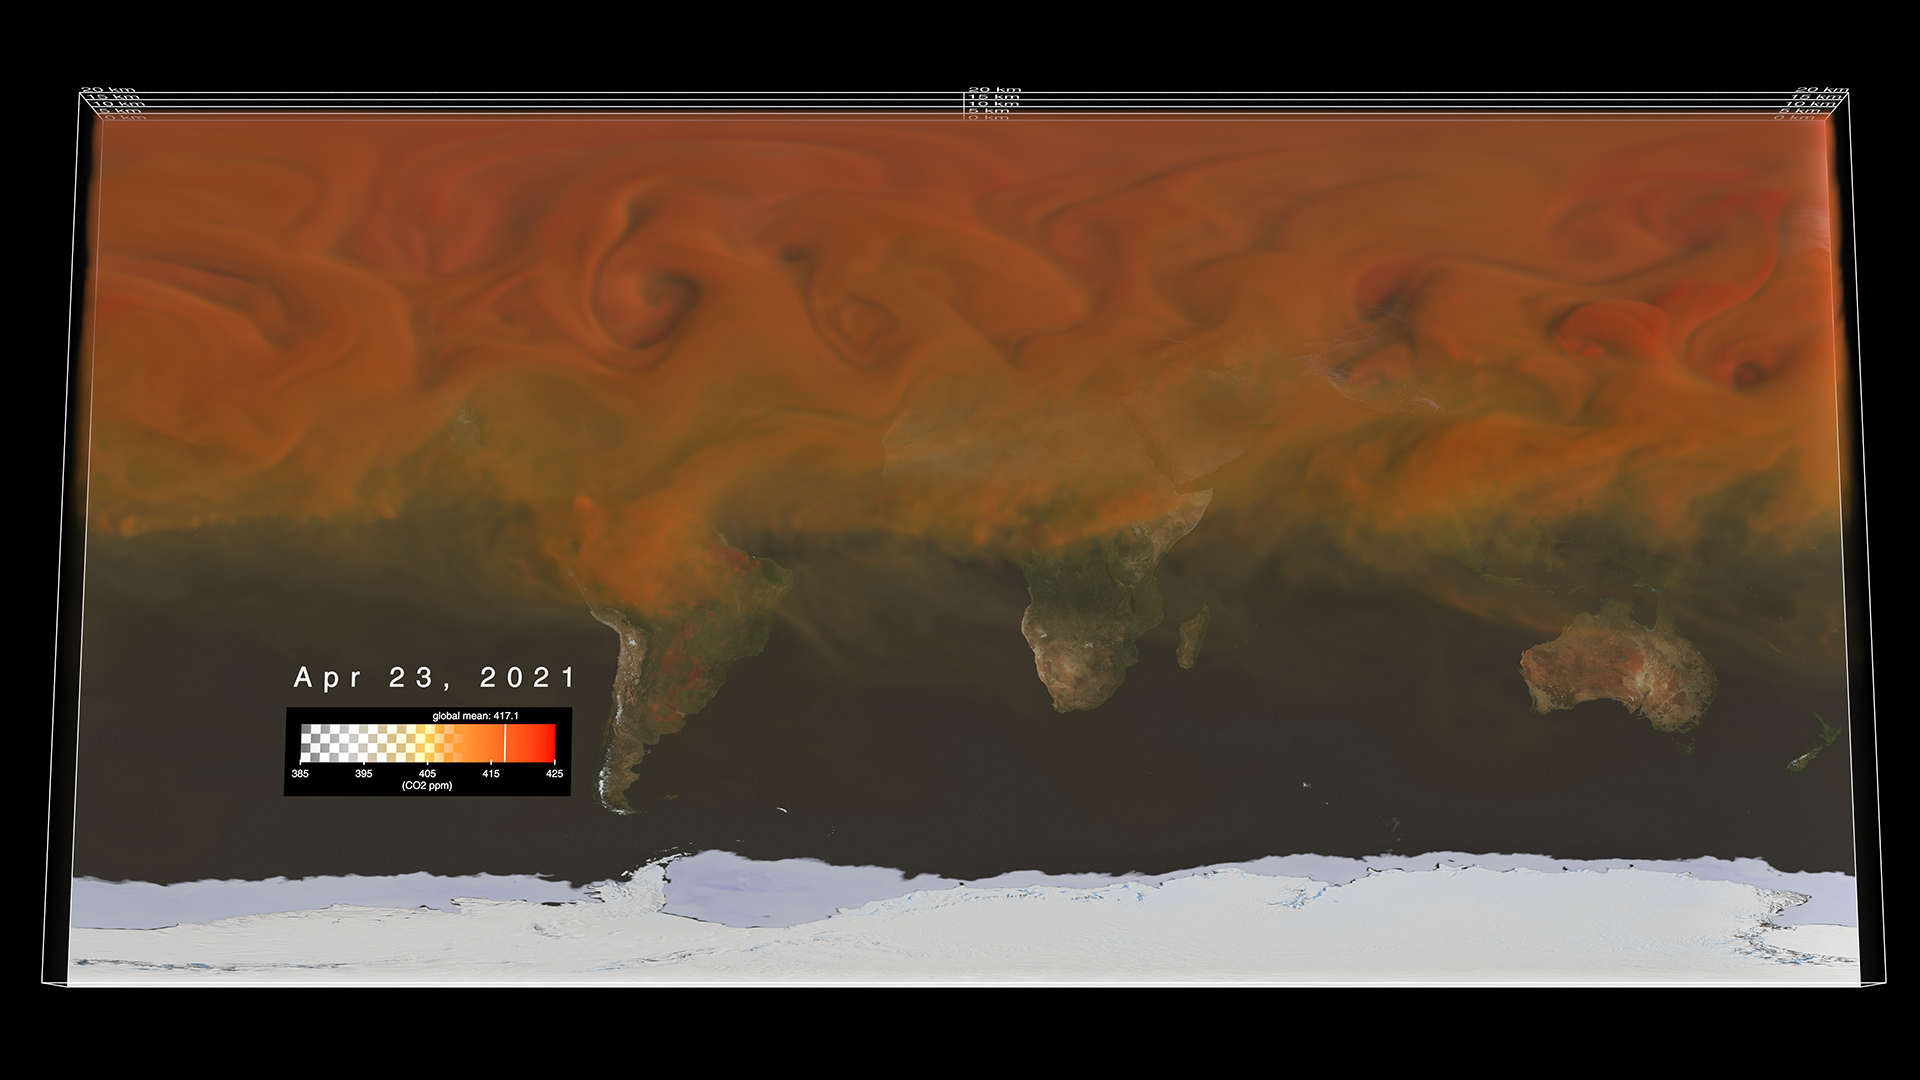
Climate Spiral
NASA Scientific Visualization Studio
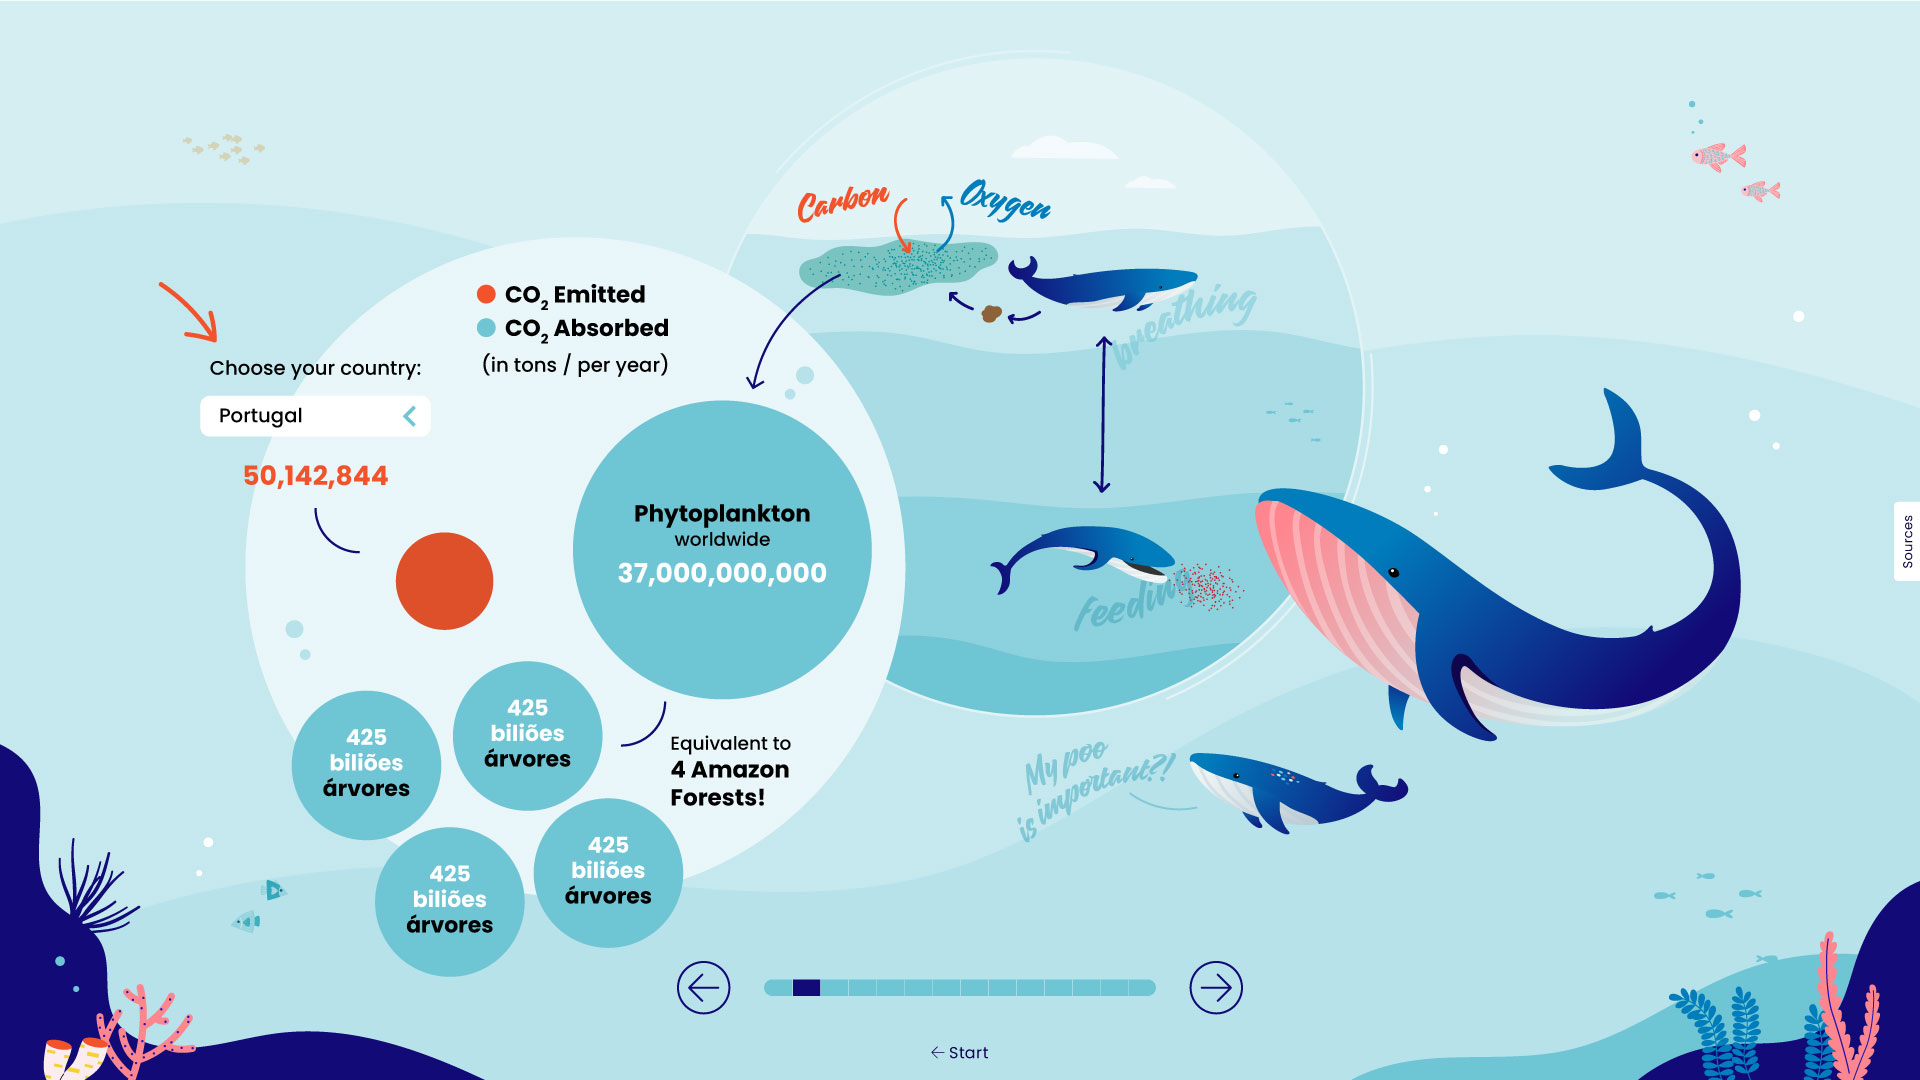
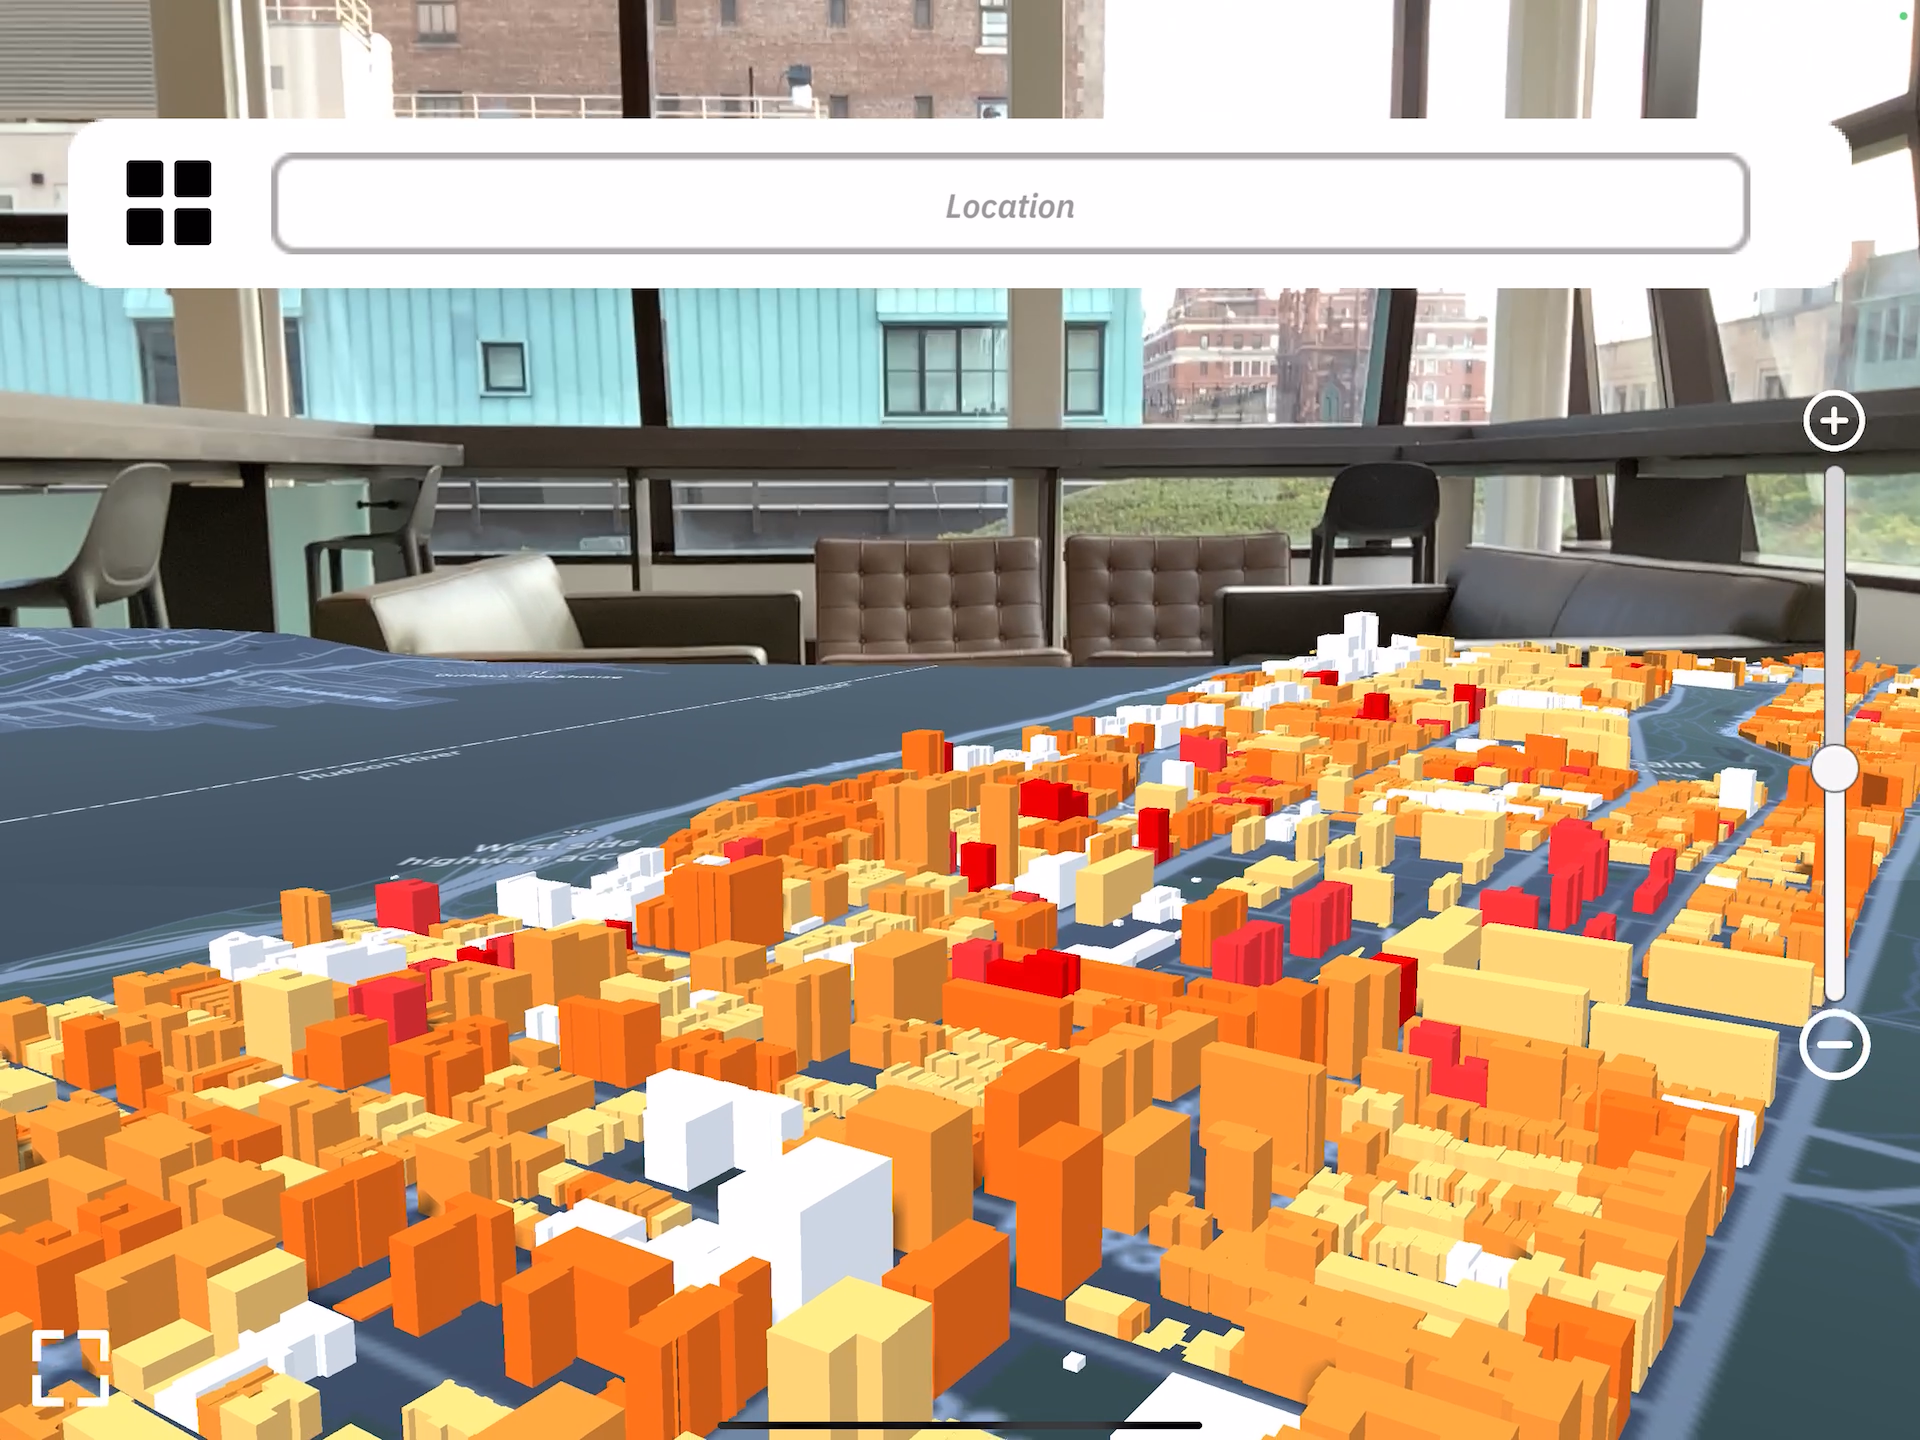
Finding Arcadia
Marta Ferreira, Valentina Nisi, Nuno Nunes
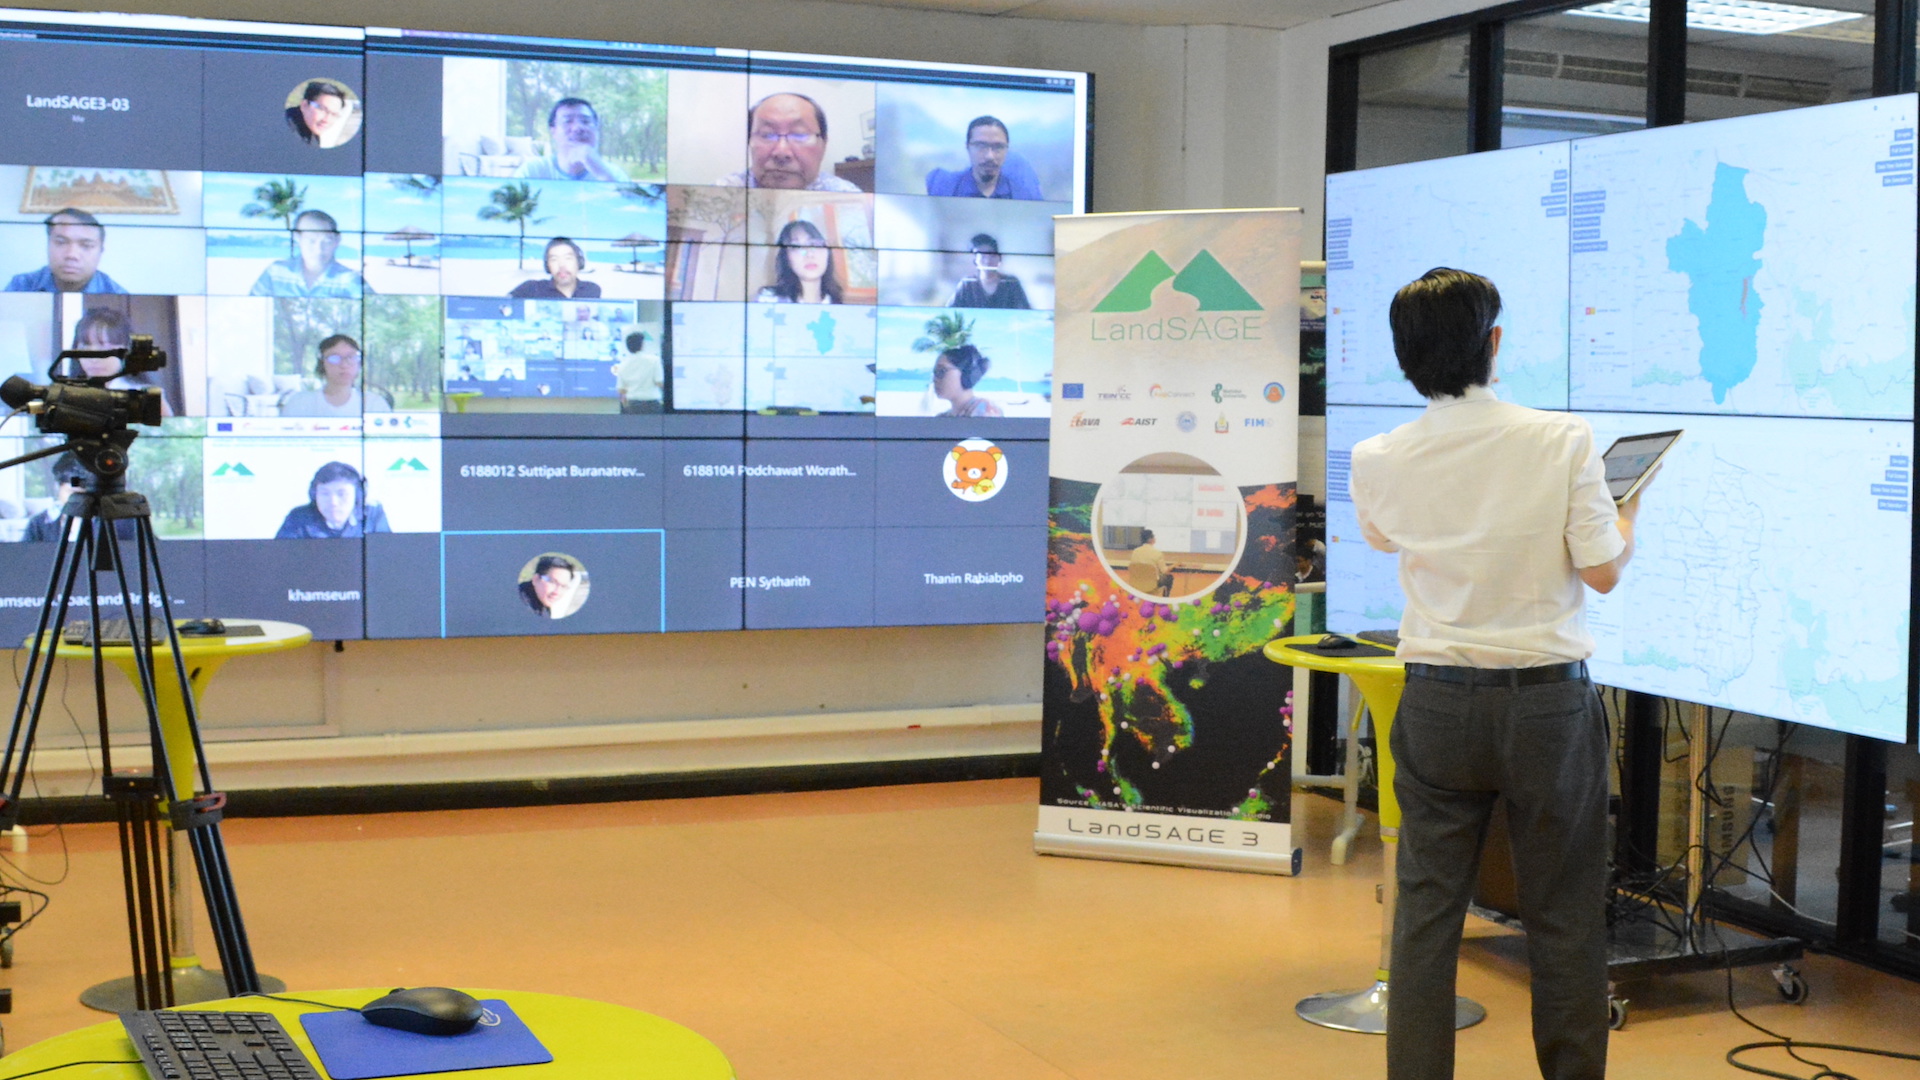
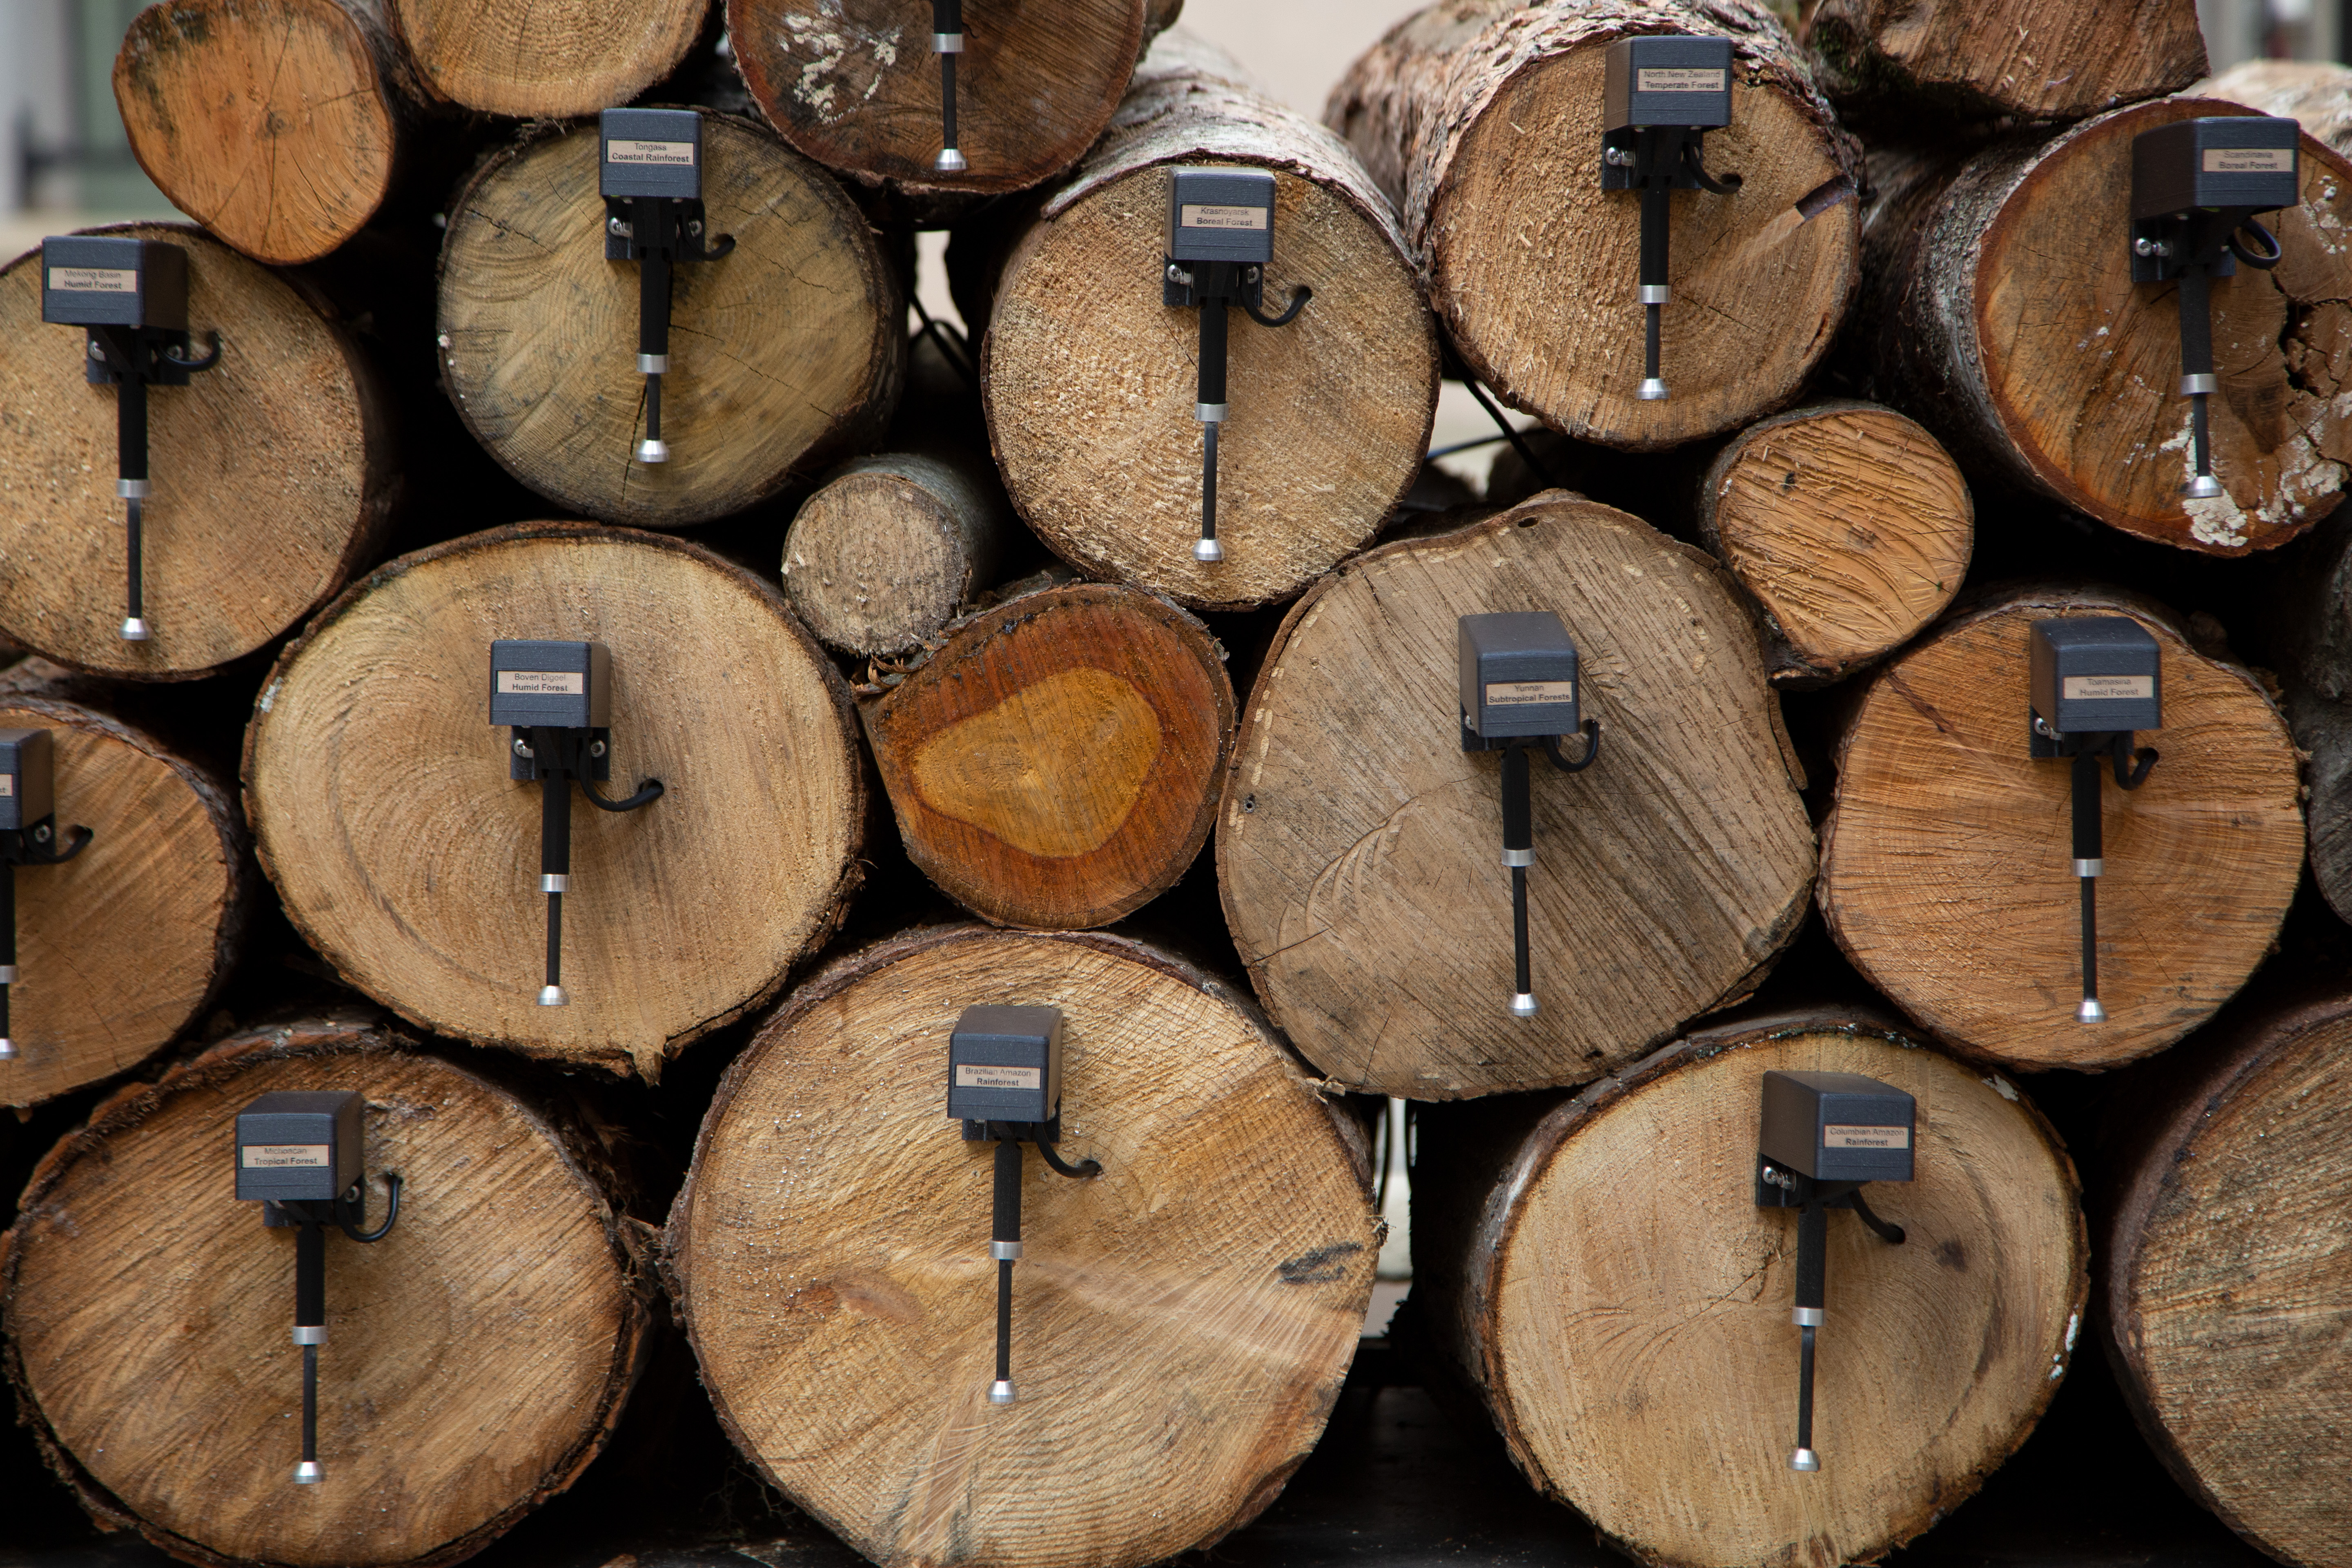
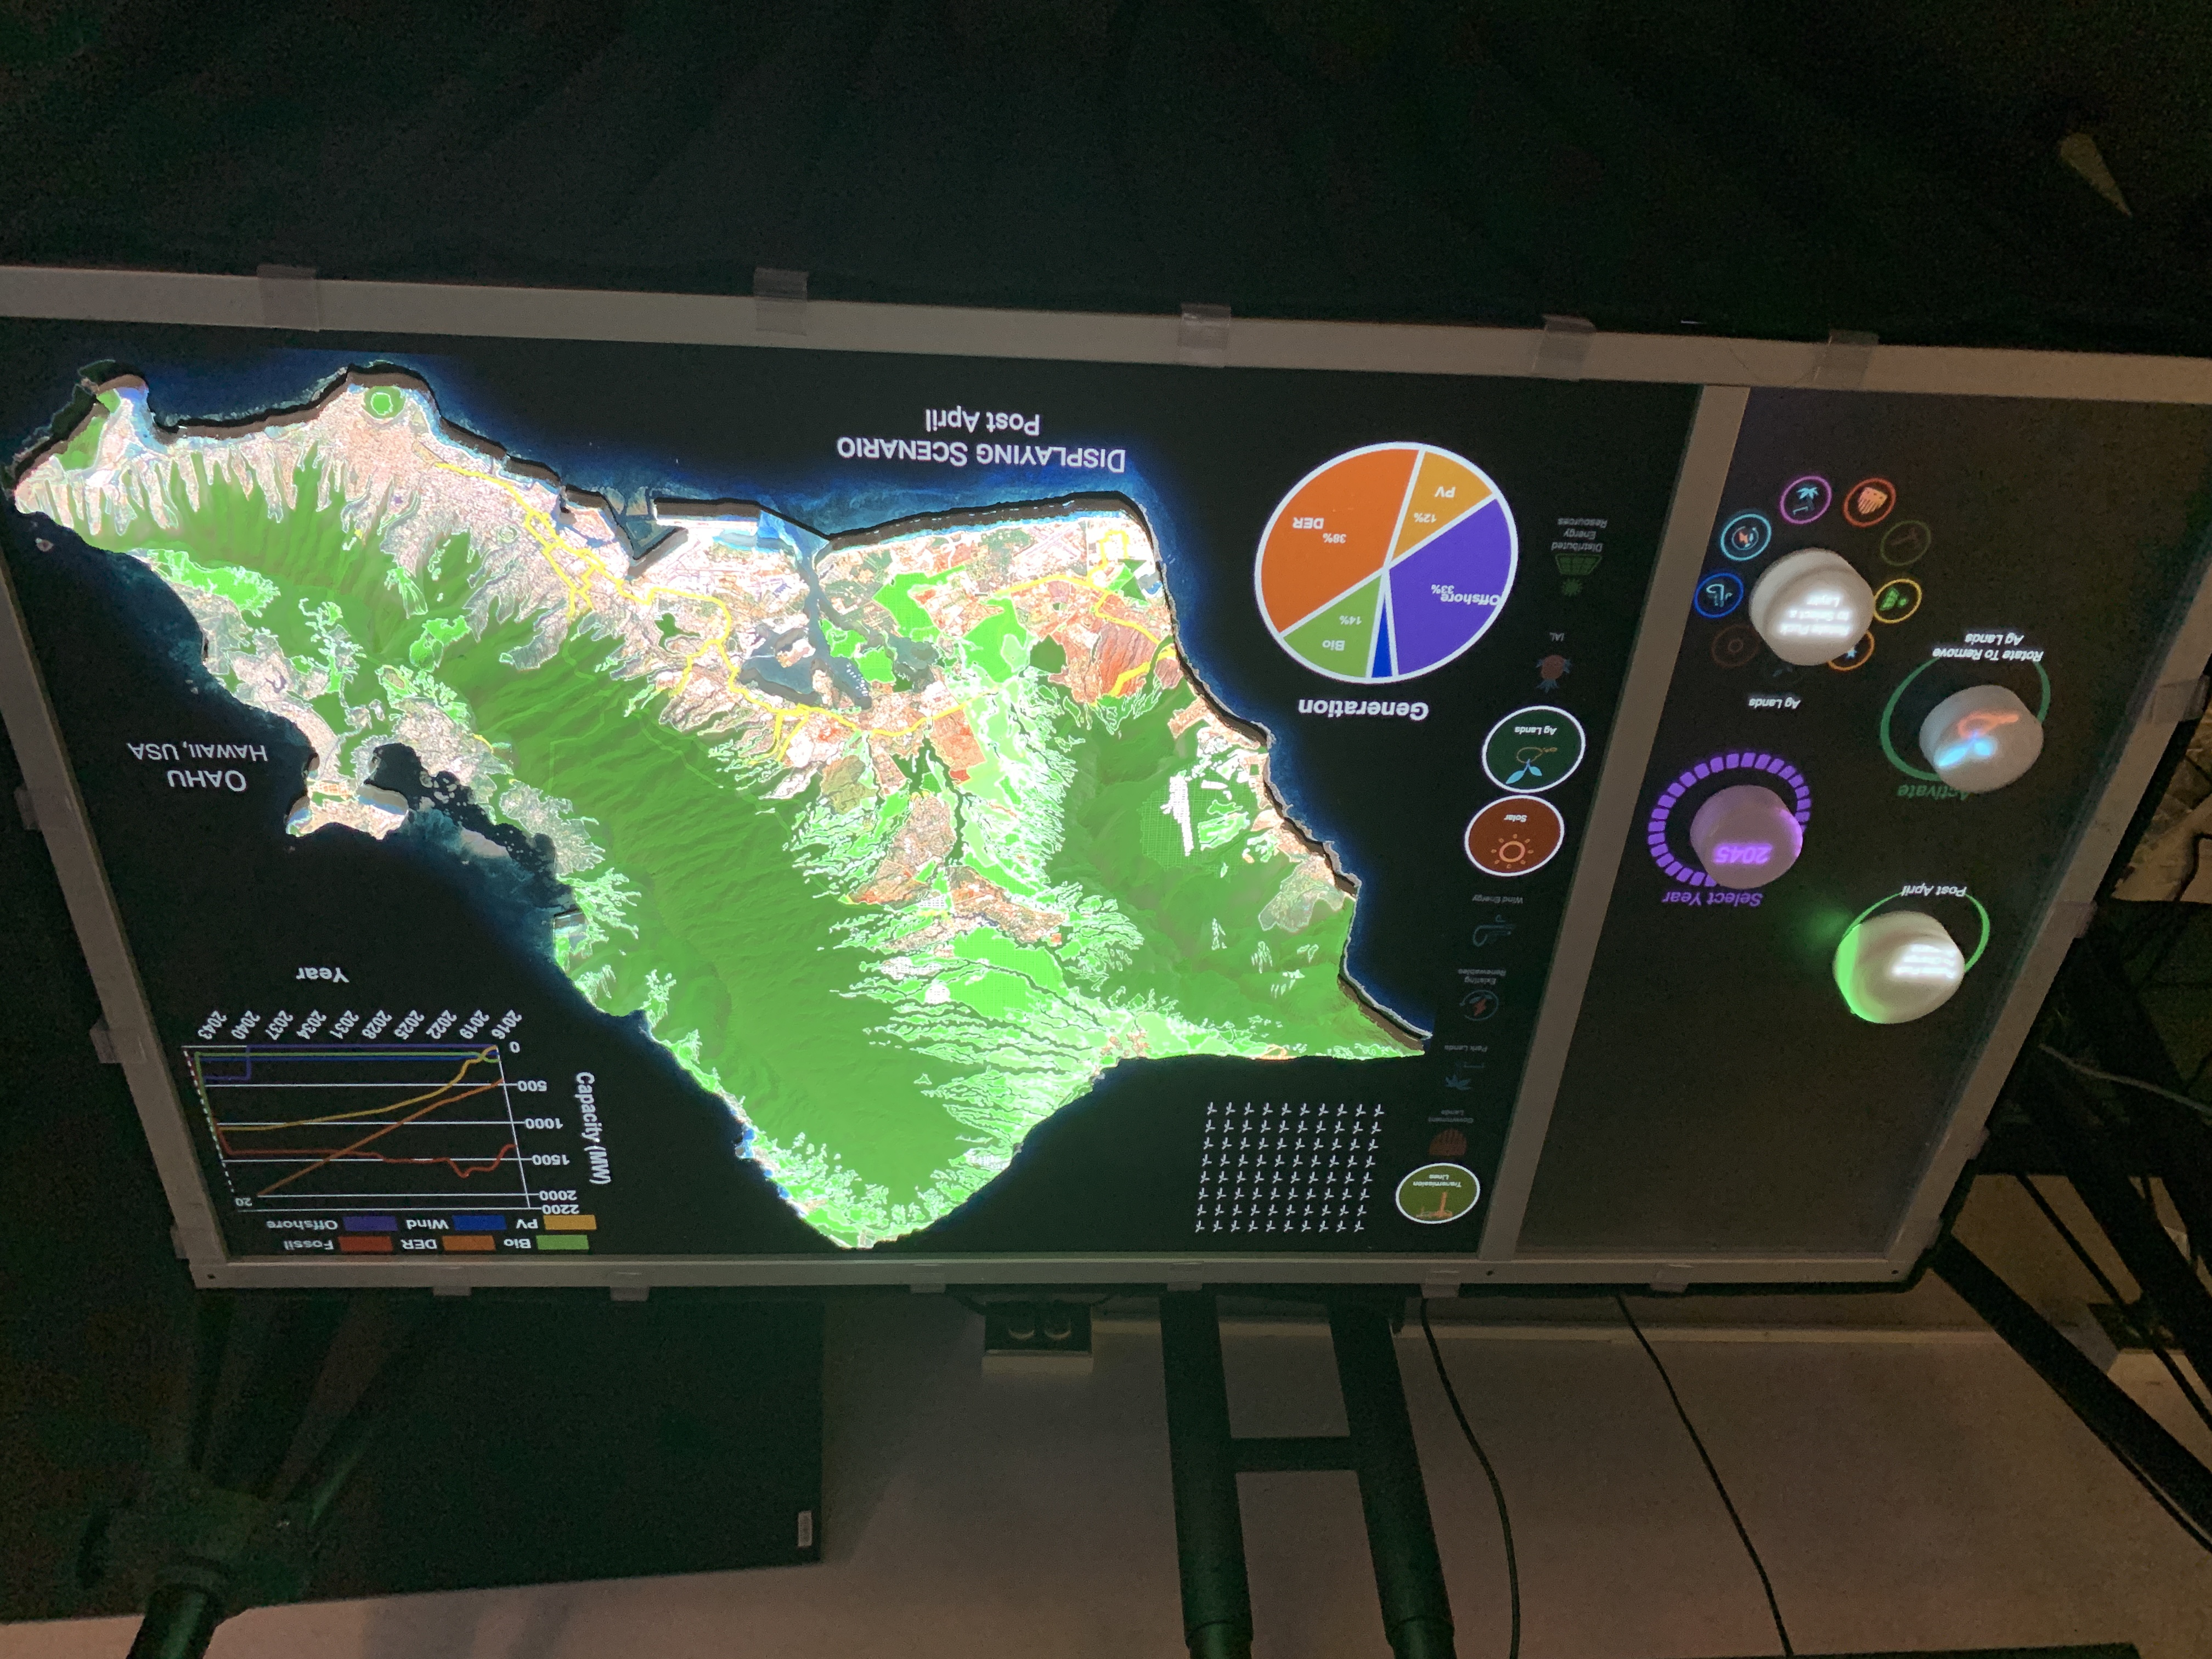
LandSAGE
Jason Haga, Jason Leigh, Mores Prachyabrued
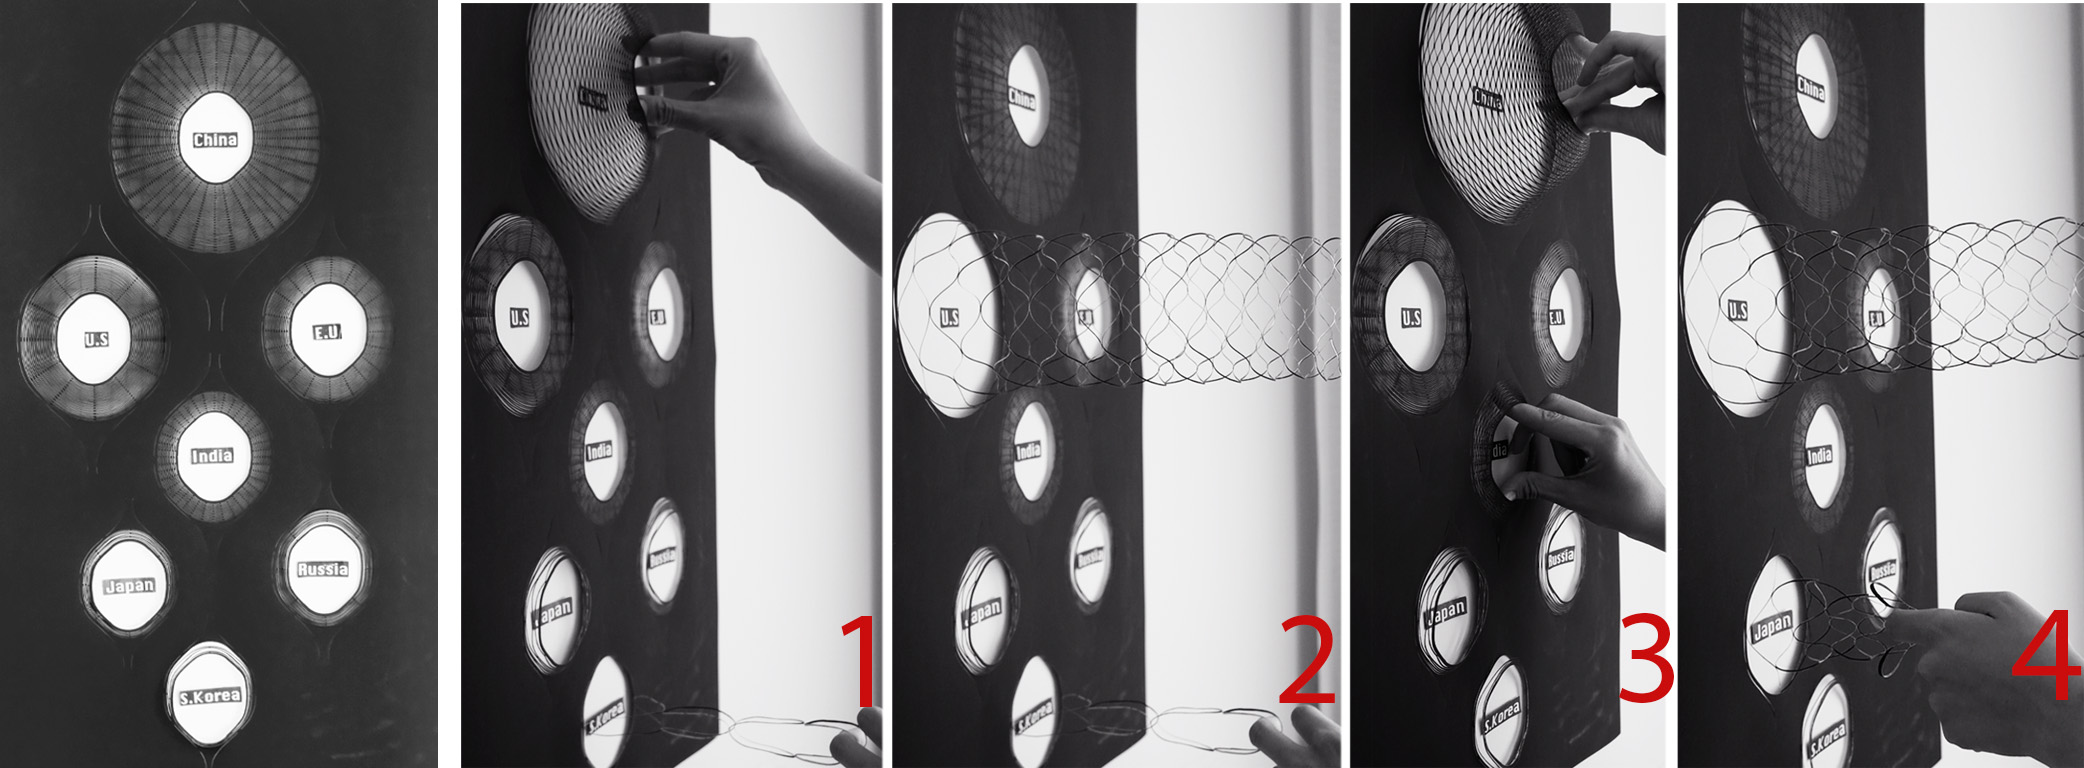
Using KiriPhys to Show Expanding Carbon Emissions
Foroozan Daneshzand, Charles Perin, Sheelagh Carpendale
Viz4Climate: High-Impact Techniques for Visual Climate Science Communication
Join us for a half-day hybrid workshop at Vis 2022
Monday, October 17th @ 2:00pm - 5:00pm CDT (UTC-5)
Omni Oklahoma City Hotel - Level Two, Oklahoma Station 8
Oklahoma City, USA - In person & virtual
Contact us! (viz4climate@gmail.com)
VIS 2022 Registration
About
Goal
Program
The workshop is hybrid and offers Q&A and co-creation sessions. These sessions will take place on virtual platforms to offer a unified experience. In person workshop attendees are highly encouraged to have access to a laptop or mobile device.
- 2:00pm
- Welcome
Helen-Nicole Kostis, Scientific Visualization Studio, NASA
- Co-creation session - Runs virtually alongside the rest of the workshop.
- 2:10pm
-
Keynote
Ed Hawkins, University of Reading, Starting Climate Conversations with Data Visualizations

- 2:35pm
-
EnLightening Session (part 1)
Session Chairs: Helen-Nicole Kostis, Andrew Christensen, Kel Elkins, Scientific Visualization Studio, NASAVirtual Presentations
- 3:15pm
-
Coffee break ☕ ️paired with screening of climate science visualizations
- 3:45pm
-
EnLightening Session (part 2)
Session Chairs: Helen-Nicole Kostis, Andrew Christensen, Kel Elkins, Scientific Visualization Studio, NASAIn-person Presentations
- 4:05pm
-
Panel Session - What does High-Impact mean in the context of Visual Climate Science Communication?
Session Chairs: Mark Subbarao, Andrew Christensen, Kel Elkins, Scientific Visualization Studio, NASA

Min Chen, University of Oxford
Andrea Polli, The University of New Mexico
Zachary Labe, Princeton University & NOAA GFDL
Reyhaneh Maktoufi, Tangled Bank Studios
Mark Subbarao, Scientific Visualization Studio, NASA/GSFC
- 4:55pm
-
Closing remarks
Helen-Nicole Kostis, Scientific Visualization Studio, NASA