2004 Earth Feature Story
Special: NASA SATELLITE SURFACE WIND DATA IMPROVE 2-5 DAY WEATHER FORECASTS
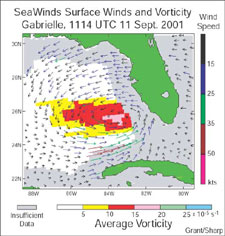
SeaWinds Spots Gabrielle Early
The arrows represent wind speed, color and size indicate the magnitude (larger arrow=stronger wind). The average vorticity, or spin, of the atmosphere is indicated by background color (blue=strongest rotation). This area of low pressure is indicative of the formation of a tropical depression. This depression was spotted using SeaWinds data 10 hours before the National Hurricane Center classified it as a tropical depression at 5 p.m. on Sept. 11, 2001. Gabrielle later strengthened to Hurricane status at 11 p.m. Sept. 16, after crossing Florida from the Gulf of Mexico into the open Atlantic Ocean.
NASA’s QuikSCAT satellite is providing meteorologists with accurate data on surface winds over the global oceans, leading to improved 2- to 5- day forecasts and weather warnings. The increased accuracy, already being used in hurricane forecasts, is bringing economic savings and a reduction in weather-related loss of life, especially at sea, according to a recent NASA study.
Dr. Robert Atlas, a research scientist at NASA’s Goddard Space Flight Center in Greenbelt, Md., demonstrated the initial beneficial impact of scatterometer data on weather prediction. In a recent experiment, he showed how the combined use of data from two scatterometers can lead to an even larger increase in the accuracy of weather analyses and forecasts, especially at the two to five-day range. One scatterometer is onboard NASA’s QuikSCAT satellite and the other is on the Japan Aerospace Exploration Agency’s Midori-II (ADEOS-II) satellite. In 2003, the Midori-II instrument became non-operational, but while both instruments worked, they showed the capability to improve forecasting. These findings will be presented on Jan. 14, at the American Meteorological Society’s Annual Meeting in Seattle.
“QuikSCAT has led to marked improvements in daily marine weather analyses, forecasts and warnings issued by the National Weather Service,” said Atlas. He added these improvements are especially beneficial since “Ninety percent of world trade moves over the oceans. Using QuikSCAT data clearly improves economies and saves the lives by giving the shipping industry more accurate warnings.”
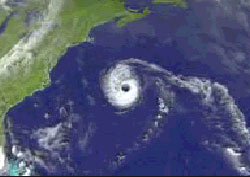
With
the right mix of winds and sea surface temperatures, an ordinary cluster of tropical
thunderstorms can explode into a tropical storm. These "ingredients"
help scientists forecast movement of these intense phenomena. Data from Hurricane
Erin, September 10-15, 2001.
a) wind speed and direction, QuikSCAT/SeaWinds
b) cloud structure, Visible and Infrared Scanner (VIRS) on Tropical Rainfall Measuring
Mission (TRMM) satellite, cooperation with NASDA
c) rainfall rates (green,
in excess of 2 inches per hour), Microwave Imager (TMI) and Precipitation Radar
(PR) on TRMM
d) eye warmth (red), Convection And Moisture EXperiment (CAMEX)
e) Hurricane Erin, GOES, operated by NOAA
The SeaWinds scatterometer is the key instrument aboard QuikSCAT that provides ocean surface wind speed and direction measurements that lead to improved prediction of storms at sea. SeaWinds can acquire hundreds of times more observations of surface wind velocity each day than can ships and buoys, and is the only remote-sensing system able to provide continuous, accurate and high-resolution measurements, regardless of weather conditions. The data is especially valuable where observations are otherwise sparse -- such as the Southern Hemisphere and tropics.
SeaWinds operates by transmitting high-frequency microwave pulses to the ocean surface and measuring the “backscattered” or echoed radar pulse bounced back to the satellite.
Atlas added the satellite “provides better coverage of the Earth’s surface and allows forecasters to detect storms earlier than ever before.” Unlike some other satellites, QuikSCAT’s SeaWinds instrument can “see” through the clouds and scrutinize conditions -- including rainfall and wind at the ocean’s surface.
During the 1999 hurricane season, the National Hurricane Center used QuikSCAT data to identify eight hurricanes. In those cases, QuikSCAT detected circulating winds well before other it could be seen as cloud swirls by other satellites. Additionally, a previous case study of Hurricane Cindy in 2000 found that use of QuikSCAT data lead to substantial reduction in projected storm intensity and movement errors.
East coast forecasters also find QuikSCAT data beneficial in the prediction of intense winter storms, including nor'easters, which travel up the Atlantic seaboard and batter coastal areas with gusty winds and heavy precipitation. In January 2003, QuikSCAT and National Weather Service data showed circling wind anomalies over the North Atlantic drawing that cold air over the United States. These anomalies were part of the North Atlantic Oscillation (NAO), which could be the major contributor to the US January arctic blast. The current phase of the NAO tends to produce more severe winter weather in the north and eastern U.S. by allowing cold Arctic air to penetrate more easily from Canada into the US
Forecasters in the western United States also benefit from QuikSCAT data since most of the weather over the West Coast is produced by storms originating over the Pacific Ocean, where there are relatively few surface observations.
QuikSCAT can aid in determining the location, direction, structure and strength of severe marine storms that often slam into the area during the winter. East coast forecasters also find QuikSCAT data beneficial in the prediction of intense winter storms, including nor’easters, which travel up the Atlantic seaboard and batter coastal areas with gusty winds and heavy precipitation.
Despite the gains made with QuikSCAT, Atlas said “NASA is committed to making further improvements by designing advanced scatterometers to be sure all storm systems are detected in a timely manner.”
NASA’s Earth Science Enterprise is dedicated to understanding the Earth as an integrated system and applying Earth System science to improve prediction of climate, weather, and natural hazards using the unique vantage point of space.
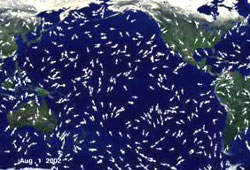
Forecasters in the western United States also benefit from QuikSCAT, since most West Coast weather originates as storms over the Pacific Ocean, where there are relatively few surface observations. QuikSCAT/NWS data indicated the 2003 El Nino winds were quite different from earlier El Ninos. Trade winds weakened over the central equatorial Pacific, and wind anomalies converged near the middle of the equatorial Pacific. The converging wind anomalies kept the warmest sea surface temperature (SST) anomalies in the middle of the equatorial Pacific. During the 1997-1998 El Nino, wind anomalies flowed from west to east across the ocean, and the warmest SST anomalies reached South America. Wind anomalies from Aug. 2002 - Jan. 2003.
Contact Information:
Rob Gutro
Goddard Space Flight Center,
Greenbelt, Md.
Article dated: January 14, 2004