TOPEX/Poseidon:
|

|

|

|
| North America | Asia | World Map |
View Images and Animations
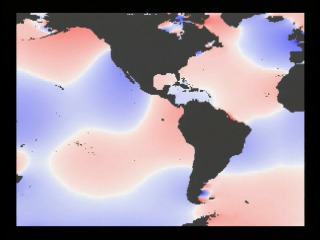
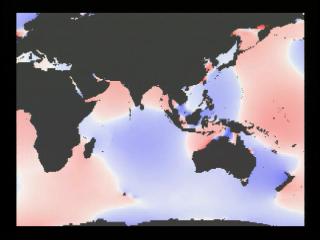
In beginning to look for where the missing tidal energy was lurking amid earth's various geophysical systems, researchers first had to map the ocean tides to a precise degree. Using six years of data from TOPEX/Poseidon, they derived a 16-day set of predictive data, showing a synthetic view of how the tides move around the world's oceans.
In this animation, blue signifies places where the ocean level is lower than the average reference height, and red shows areas where it's higher. The difference is significant: between the darkest blue and the brightest red is a range of more than 49 feet (15 meters), displaced by lunar tidal forces. White areas separating the blues and reds approximate the "zero" point, a reference sea level against which other areas are compared.
A few places on the map show areas where the tides appear to revolve around a generally stable, unmoving point. This is called an amphidrome, a place with little or no tide at all.
Mapping Dissipation Zones

View Images and Animations
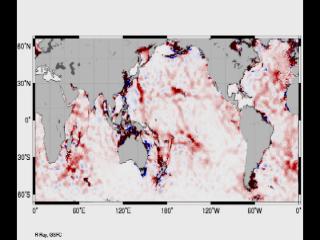
Research suggests that areas of pronounced topography on the floor of the ocean are likely to be where energy dissipates faster than elsewhere. In this map of the world, the red areas show places where this proves to be true. In the Pacific around Hawaii, notice how the red is concentrated; craggy sub-surface ridges formed from young, active volcanoes act as dampers for tidal energy in that area.
Similarly in the Atlantic Ocean, the red appearing in the north is due to a similar dampening caused by the North Atlantic Ridge. Essentially a mountain chain underwater, this ridgeline absorbs and dispels a portion of tidal energy as waves fetch across the span between the Americas and Europe. Other places with sub-sea features causing significant energy include the area south of the Japanese archipelago, the Indonesian island chain, and the area south of Madagascar.
How much energy do undersea ridges and mountains dissipate? The new research suggests that more than a terawatt-- one trillion watts-- of power may be scattered in this manner.
This research goes further than simply determining where missing tidal energy can be found. By more accurately understanding how energy dissipates in the ocean, a clearer picture about the nature of the open sea emerges. Of particular interest is a better understanding of thermohaline circulation ("thermo" referring to heat, and "haline" referring to salinity, or salt, concentration). The researchers solved equations for tidal energy flux by using satellite measurements of height and tidal current velocities. Evaluated over time, height and velocity yield flux, or total changes in energy. This research goes a long way in helping explain the processes of how heat and salinity migrate through the water column.
Catching Waves

View Images and Animations
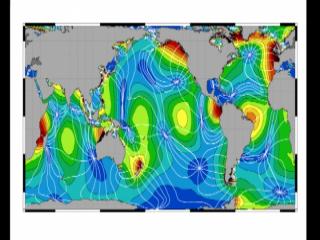
This map shows the patterns of tidal energy played out across the surface of the Earth as lines of force. The colors indicate where tides are strongest, with blues being weaker areas and reds being stronger. In almost a dozen places on this map the lines appear to converge, as if pulled together like a purse. Notice how at each of these places the surrounding color--the tidal force for that region--is blue. These convergent areas are called amphidromes, places where there is little or no apparent tide. This is not to say that the surface of the ocean in these places doesn't move, doesn't rise and fall with wind, momentum, inertia, and other forces acting on it. But for the purposes of studying the tides from space in an effort to understand how energy is conserved and distributed, these areas a mathematically still.
How High the Sea: TOPEX/Poseidon at Work

View Images and Animations
Launched in 1992, TOPEX/Poseidon's primary mission is to measure global ocean circulation patterns by carefully plotting sea levels on a planetary scale. By calculating the round trip travel time of radar pulses between the spacecraft and the ocean surface, precise altitude measurements can be derived. Data from the joint French and American project is valuable in the study of hurricanes, El Nino/La Nina behavior, marine life, climate forecasting, and more. The Jet Propulsion Laboratory manages the TOPEX/Poseidon mission for NASA's Office of Earth Science, Washington, DC.
For further information, check out the following web sites:
This multimedia project is the work of a dedicated team of researchers,
animators, and media specialists. A companion video to this web site is
available from NASA-TV. Below are a list of agencies, departments, and
researchers who provided expertise and data for this production:
Special thanks to
Dr. Richard Ray/Space Geodesy branch, NASA/GSFC
Please give credit for these images to:
NASA - Goddard Space Flight Center
NASA - Jet Propulsion Laboratory
Scientific Visualization Studio
Television Production NASA-TV/GSFC
Content Preparation and Project Production:
Michael Starobin
Last Revised: February 4, 2019 at 06:02 PM EST
