May 29, 2003 - (date of web publication)
HURRICANE RESOURCE REEL 2003
The 2003 hurricane season started early for the United States: In late April, Ana became the earliest tropical storm in U.S.waters since weather- casters started naming storms. Starting May 15 for the Eastern Pacific and June 1 for the Atlantic, hurricanes and tropical storms typically ravage U.S. coastlines through the end of November. The National Oceanic and Atmospheric Administration (NOAA) predicts the 2003 hurricane season will likely have above normal levels of activity. This resource tape contains highlights from NASA's research on hurricanes, animation illustrating the inner workings of these super storms, illustrations showing the impacts of El Nino and La Nina, and some of the best satellite views of hurricanes our researchers could get their hands on.
Hot Water - Hurricane Fuel
|
|
|
Images 1 and 2 |
|
Researchers and forecasters often study sea surface temperatures for an indication of hurricane potential. Scientists say above normal Atlantic Ocean temperatures is one reason for the "above normal" hurricane forecast. Hurricanes convert heat from the tropical atmosphere and oceans to wind and waves, just as a car engine converts gasoline into motion. These animations show a year in the life of global and Atlantic ocean temperatures, June 2, 2002 to May 11, 2003. Green indicates the coolest water, yellow the warmest. The Advanced Microwave Scanning Radiometer (AMSR-E) on the Aqua satellite saw through the clouds to provide sea surface temperatures. (CREDIT: NASA's Scientific Visualization Studio)
El Nino's Demise and the Forecast
|
|
|
Images 3 and 4 |
|
NOAA forecasters attribute their "above normal" hurricane activity predictions for 2003 in part to changing conditions in the Pacific Ocean, such as the demise of El Nino. This sequence traces the evolution of the warmer-than- normal waters associated with the weak El Nino that developed in the late fall 2002. By January, the warm conditions began to dissipate.Fewer Atlantic hurricanes generally form when El Nino is present.Researchers say the Pacific may transition to the colder-than- normal La Nina phase. Areas in red indicate warmer than normal temperatures; areas in blue, cooler than normal. June 2, 2002 to May 11, 2003 SST anomalies from AMSR-E on Aqua. (CREDIT: NASA's Scientific Visualization Studio)
The Africa Connection
Image 5
Increased rainfall in the fall in the Sahel (northwestern) region of Africa often has been associated with an increase in the number and intensity of hurricanes in the North Atlantic the following summer. The Tropical Rainfall Measuring Mission (TRMM) captured these images of higher than normal rainfall (shown in green and light blue) in the Sahel this fall. This sequence shows the monthly average rainfall anomalies in the region for September 2002. TRMM is a joint NASA/ Japanese Space Agency (NASDA) mission. (CREDIT: Hal Pierce, TRMM)

Image 6
Hurricane Heat Engine
This animation shows how heat from warm ocean waters power hurricanes.As water vapor evaporates from the warm ocean surface, it is forced upward in the convective clouds that surround the eyewall and rainband regions of a storm. As the water vapor cools and condenses from a gas back to a liquid state, it releases latent heat. The release of latent heat warms the surrounding air, making it lighter and thus promoting more vigorous cloud development. This movie illustrates how the hurricane extracts heat energy from the water, leaving a trail of cooler water behind. CREDIT: NASA's Scientific Visualization Studio
Cause and Effect: Bonnie's Trail Weakens Danielle's Path
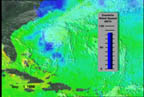
Image 7
A hurricane gathers energy from warm waters found in tropical latitudes. In this image we see Hurricane Bonnie cross the Atlantic, leaving a cooler trail of water in its wake. When Hurricane Danielle crosses Bonnie's path, the wind speed of the second storm drops markedly, as available energy to fuel the storm's engine drops off. But once Danielle crosses Bonnie's wake, notice how winds speed increase due to temperature increases in surface water around the storm.
Hurricane CAT Scans - Rainfall Rates
|
|
|
|
|
Images 8 - 10 |
||
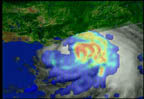
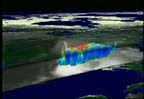
The following hurricane visualizations were developed using data from TRMM's precipitation radar. The images that dissect the storm into layers have come to be known informally as "CAT" scans for their resemblance to the medical technology that can peer inside a person's body. The term crystal towers for the 3-D, rotating images of the storms simply describes their majestic, prismatic spires rendered in electronic paint above the surface of a virtual ocean. High rates of rainfall appear in red, with lesser amounts appearing in blue. By mapping the structure of storms, experts can "take them apart" in the laboratory as they try to understand how they work.TRMM gathered data for these images of hurricanes Mitch, Georges, and Earl in 1998.
"Super-Ensemble" Model for Rainfall Prediction
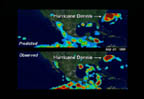
Image 11
Using the new "super-ensemble" forecasting technique, the following visualizations compare one day forecasts from September of that year to the collected daily observations of actual rainfall. This technique combines existing forecast models with satellite rainfall data. Daily rainfall predictions in the tropics are notoriously difficult. In the following images gathered during September 1999, compare the month's collected one-day forecasts to the collected daily observations of actual rainfall. In this representation the overall forecasting trend through time is more significant than precise matching of the rainfall areas depicted by the color map shown.
Image 12
Click here for an animation of Erin's temps
Hurricane CAT Scans - Temperature
This is a 3-dimensional view of Hurricane Erin's eye. The eye itself is a "hole" of descending air which is in the middle of this image that resembles a mountain. The outer part shown here are the clouds that surround the eye (called the eyewall), which contain the warmest air in the storm.
Sensors (dropsondes) dropped from NASA's ER-2 aircraft provided data that showed the warmest portion around Hurricane Erin's eye, depicted in red. The green color represents the spiraled pattern of rainfall in the eyewall as shown by the Tropical Measuring Mission Satellite (TRMM).
Hurricane Erin's eye was very warm from the ocean to the top of the lower atmosphere at around 10 miles altitude. The warmest part of Erin’s eye was almost 21 degrees (Fahrenheit) warmer than the surrounding air, a dramatic difference from the air around it. Above 7.5 miles high, the eye’s temperature dropped quickly to the same temperature as the air outside the eye.
Hurricane Lili
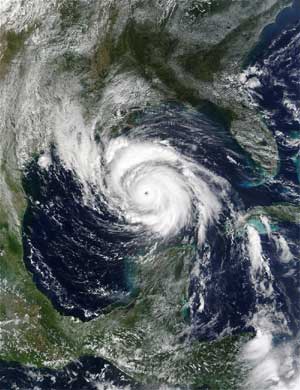
Image 13
Link to high resolution image of above.
Hurricane Lili churned up the Gulf of Mexico, reaching category four on October 2, 2002. Terra's MODIS instrument took the image.Image Courtesy: MODIS Rapid Response team.
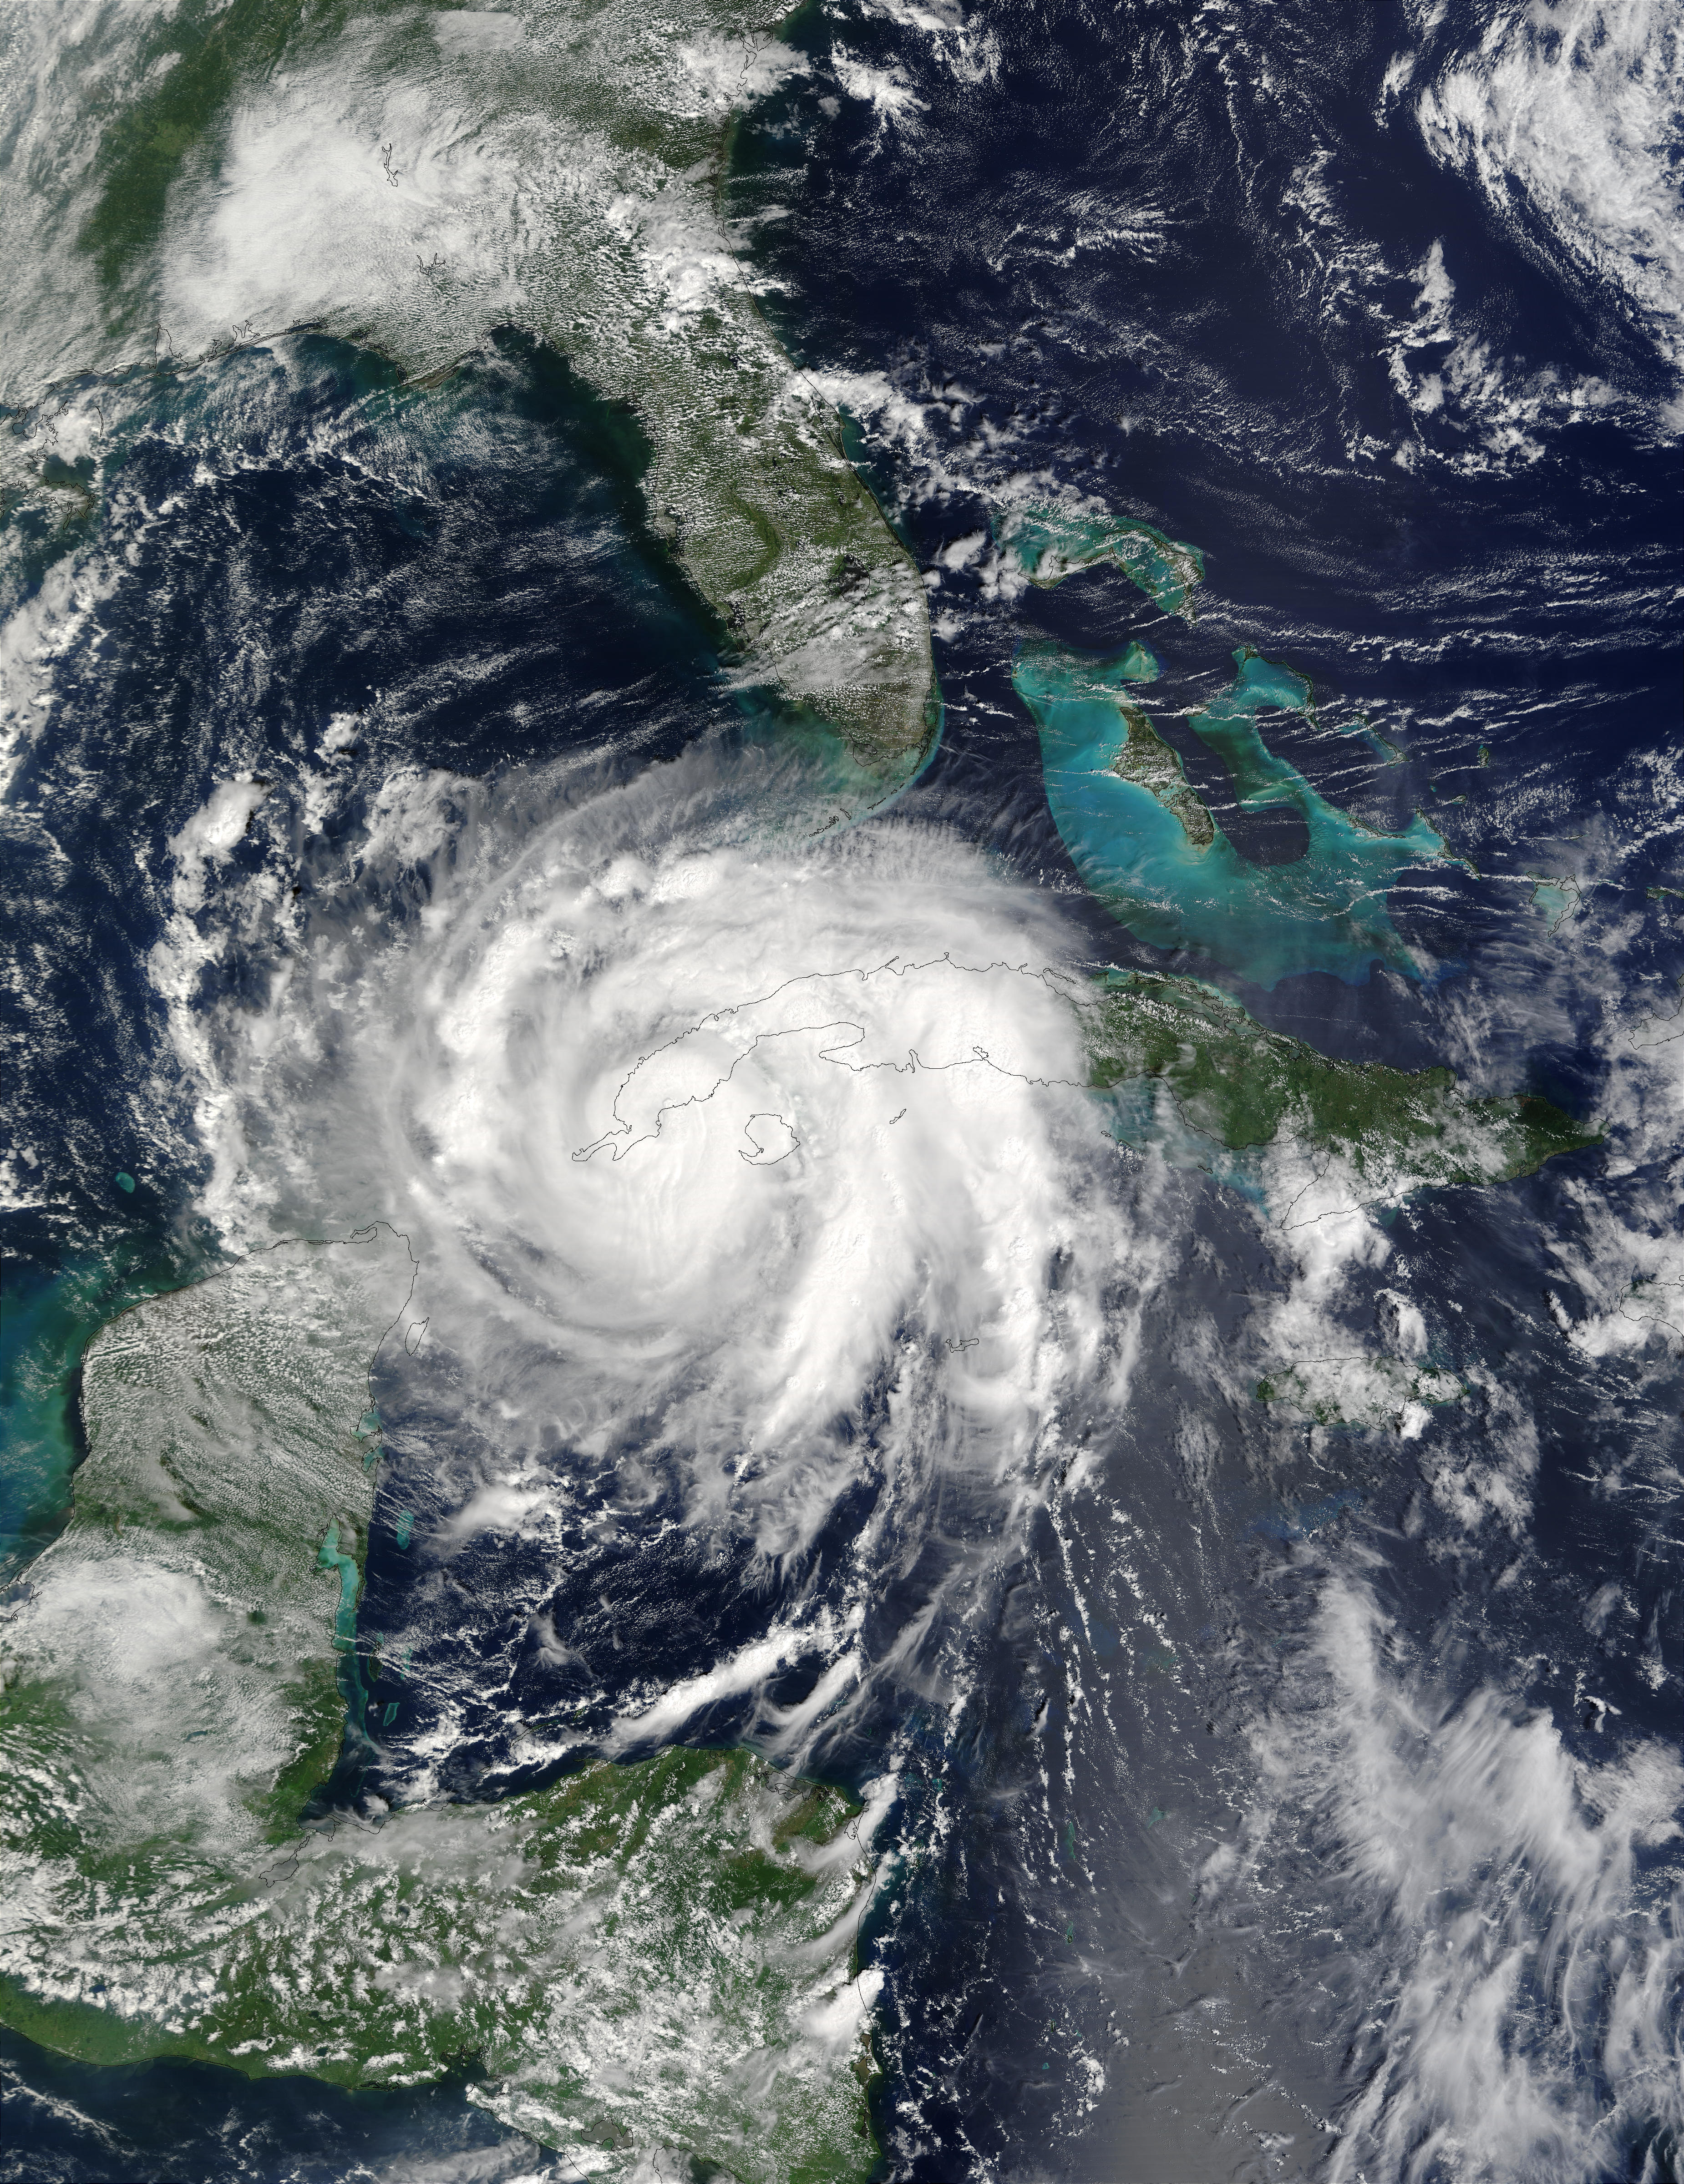
Hurricane Isidore
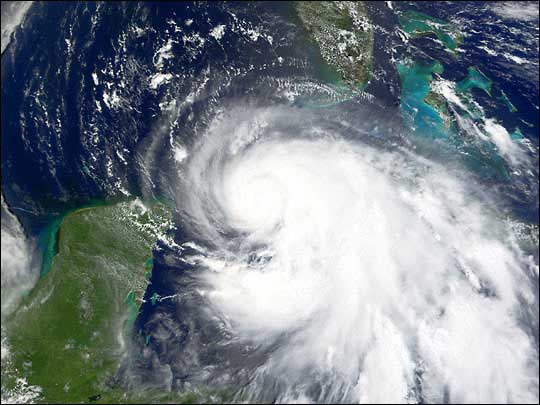
Image 14
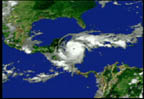
With maximum sustained winds close to 105 mph (165 km/hr), Hurricane Isidore wreake havoc on the island nation of Cuba September 23, 2002. Terra MODIS data captured by direct broadcast at Louisiana State University and processed at the University of Wisconsin-Madison by Liam Gumley, Space Science and Engineering Center.
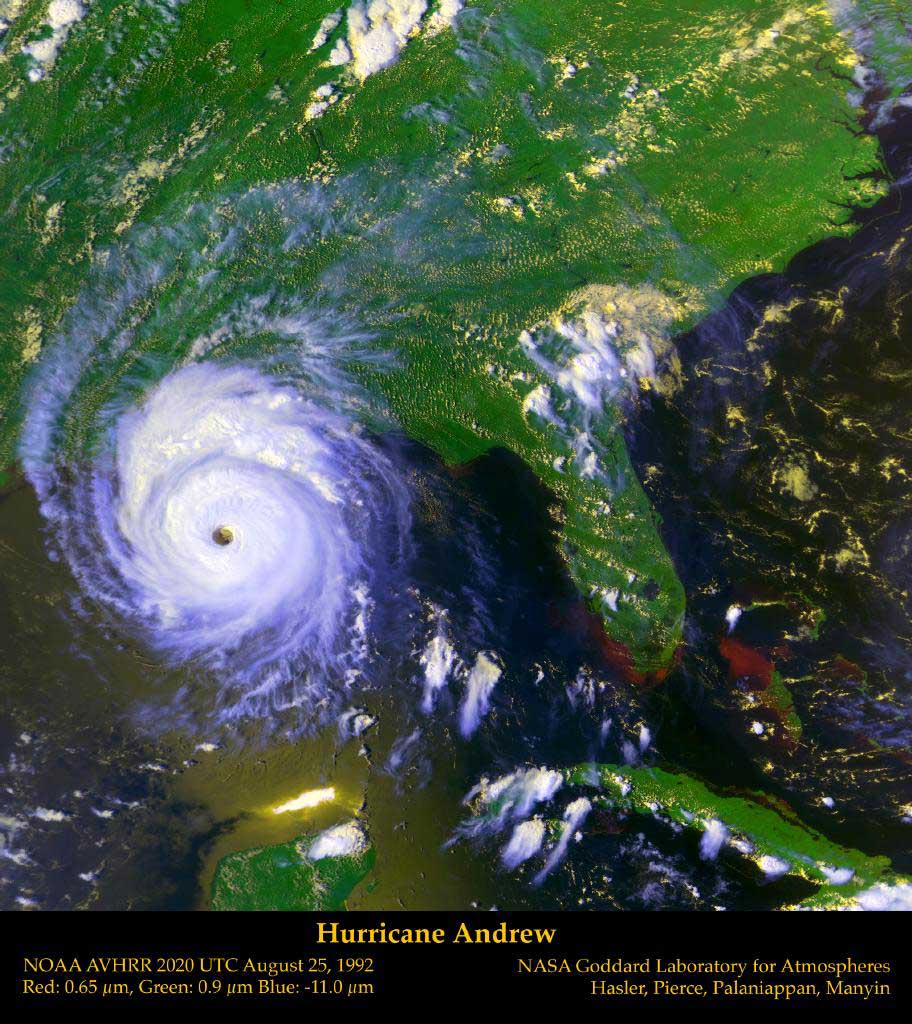
Image 15
Hurricane Andrew
This is an overhead view of Hurricane Andrew as it approaches Louisiana on August 25, 1992 at 20:20 UT. The cloud data are from GOES-7 (Geostationary Operational Environmental Satellite), while the vegetation is derived from AVHRR (Advanced Very High Resolution Radiometers). During the previous day, Hurricane Andrew left a swath of devastation in southern Florida. CREDIT: NOAA and the NASA Goddard Laboratory for Atmospheres
Miracle Swath
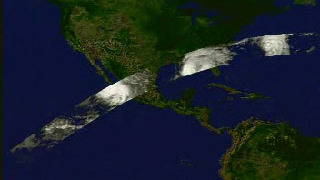
Image 16
In one remarkable pass on September 2, 1998, TRMM captured data from four hurricanes: Howard, Isis, Earl, and Danielle.
For more information contact:
Katie Stofer
NASA Goddard Space Flight Center
Greenbelt, MD 20771
(301) 286-5687
No images are available in high resolution (other than the image noted below).
Image 13 High Resolution image link
For more options on mpegs to view:
Click here to see the SVS Animation Detail page for Image 1.
Click here to see the mpeg that goes with Image 1.
Click here to see the SVS Animation Detail page for Image 2.
Click here to see the mpeg that goes with Image 2.
Click here to see the SVS Animation Detail page for Image 3.
Click here to see the mpeg that goes with Image 3.
Click here to see the SVS Animation Detail page for Image 4.
Click here to see the mpeg that goes with Image 4.