January 29, 2003 - (date of web publication)
Ocean Surface Saltiness Influences El Niño Forecasts
|
|
Caption for Image 1: EL NIÑO CONTINUES TO GROW ON 12-2-02: PACIFIC OCEAN SHOWS HIGHER THAN NORMAL SEA SURFACE HEIGHTS The latest image from NASA's Jason oceanography satellite, taken during a 10-day collection cycle ending December 2, 2002, shows the Pacific dominated by two significant areas of higher-than-normal sea level. In the central equatorial Pacific, the large area of higher than normal sea level (warmer than normal sea surface temperatures) associated with growing El Niño conditions has recently migrated eastward toward the coast of South America. The image shows red areas in the north Pacific and at the equator that are about 10 centimeters (4 inches) above normal; white areas indicate sea surface heights between 14 and 32 centimeters (6 to 13 inches) above normal. These regions contrast with the western tropical Pacific, where lower-than-normal sea levels (blue areas) have developed that are between 5 and 13 centimeters (2 and 5 inches) below normal, while purple areas range from 14 to 18 centimeters (6 to 7 inches) below normal. Along the equator, the red sea surface heights equate to sea surface temperature departures greater than one degree Celsius (two degrees Fahrenheit) and the white sea surface heights are sea surface temperatures 1.5 to 2.5 degrees Celsius (three to five degrees Fahrenheit) above normal. CREDIT: NASA JPL |

NASA sponsored scientists have discovered by knowing the salt content of the ocean's surface, they may be able to improve the ability to predict El Niño events. Scientists, studying the western Pacific Ocean, find regional changes in the saltiness of surface ocean water correspond to changes in upper ocean heat content in the months preceding an El Niño event. Knowing the distribution of surface salinity may help predict events.
Salinity and temperature combine to dictate the ocean's density. Greater salinity, like colder temperatures, results in an increase in ocean density with a corresponding depression of the sea surface height. In warmer, fresher waters, the density is lower resulting in an elevation of the sea surface. These ocean height differences are related to the circulation of the ocean.

Image 2 |

Image 3 |
Caption for Images 2 and 3: WHAT IS AN EL NIÑO? El Niño was named by people who fish off the western coast of Central America to refer to the warm current that invades their coastal waters around Christmas time. El Niño events disrupt fisheries and bring severe weather events worldwide. In a normal year, the trade winds blow westward and push warm surface water near Australia and New Guinea. When warm water builds up in the western Pacific Ocean, nutrient-rich cold water comes up off the west coast of South America and fosters the growth of the fish population. During an El Niño event, the trade winds weaken and warm, nutrient-poor water occupies the entire tropical Pacific Ocean. Heavy rains that are tied to the warm water move into the central Pacific Ocean and cause drought in Indonesia and Australia, while causing floods on the east over Peru and Chile. This also alters the path of the atmospheric jet stream over North and South America. CREDIT: NASA JPL |
The surface salinity in two regions contributes to El Niño events: an area of warmer temperatures and lower salinity in the western Pacific, and the higher salinity and cooler temperatures in the eastern Pacific. Differences in surface salinity are related to changes in temperature and upper ocean heat content, which are part of the El Niño phenomenon. They have the potential to influence the Earth's climate through air-sea interaction at the ocean's surface.
|
|
Credit for Image 4: AREA OF STUDY: THE WEST PACIFIC WARM POOL Ballabrera and his colleagues studied salinity in the West Pacific Warm Pool, a large area of ocean centered in the seas around Indonesia. This region contains the warmest ocean water in the world, and slowly fluctuates in size. The extent of the West Pacific Warm Pool affects the size and frequency of El Niño. In the image at left, cold waters are blue, purple, red and orange waters are warmer, and yellow indicates sea surface temperatures up to 35°C. CREDIT: Image by Robert Simmon, based on sea surface temperature data from the Physical Oceanography DAAC at NASA's Jet Propulsion Laboratory |

The study, conducted for NASA by University of Maryland researchers Joaquim Ballabrera, Tony Busalacchi, and Ragu Murtugudde, is one of the first to look at ocean salinity in El Niño, Southern Oscillation (ENSO) predictions and their relationship to tropical sea surface temperatures, sea level, winds, and fresh water from rain. Results of the study are in the latest issue of the Journal of Geophysical Research - Oceans.
Ballabrera and his colleagues looked at data, from 1980 to 1995, about sea surface temperatures, winds, rainfall, evaporation, sea surface height, and latent heat, the energy released when water vapor condenses into droplets.
|
|
Credit for Image/Animation 5: WINDS AND THE FORMATION OF EL NIÑO This animation shows the relationship between the direction and intensity of the Pacific trade winds, and the formation of El Niño. The arrows show surface wind dynamics, while the colors represent sea surface temperature. Notice how the warmer water expands, while cooler water contracts. This animation was made using ADEOS scatterometer data to show winds and Topex-Poseidon data to show water temperature and topography. CREDIT: Goddard Scientific Visualization Studio |

Using computer models, they performed a series of statistical predictions of the El Niño events for such a period. The results indicate short-term predictions only require monitoring sea surface temperatures, while predictions over a season require the observation of sea level. They concluded observations of salinity significantly improve predictions. When changes in salinity occur, they affect the El Niño event for the next six to 12 months. In this lag time, salinity changes have the potential to modify the layers of the ocean and affect the heat content of the western Pacific Ocean; the region where the unusual atmospheric and oceanic behavior associated to El Niño first develops. "As a result, when changes in ocean saltiness are considered, improvements are found in El Niño forecasts six to 12 months in advance," Ballabrera said.
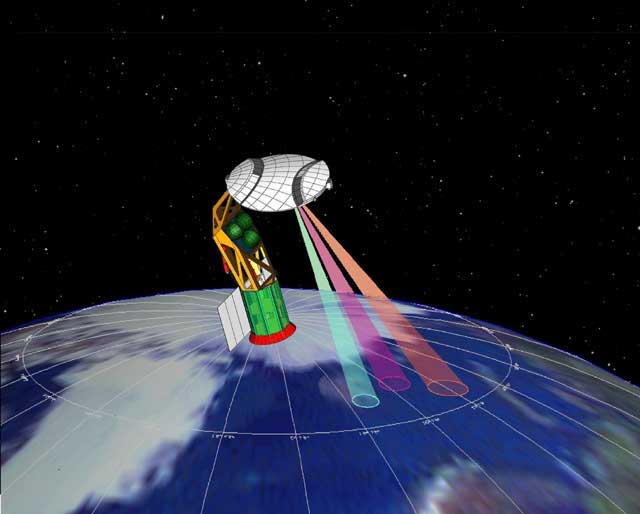
Image 6 |
Caption for Image 6: THE UPCOMING AQUARIUS MISSION Aquarius will provide global maps of ocean-salt concentration on a monthly basis over its planned three-year mission life. By exploring such information, researchers can better understand the nature of Earth's oceans and their role in storage and distribution of heat and thus their role in global climate change. The proposed launch for the Aquarius mission is sometime in 2006 - 2007. The mission will be managed by NASA's Jet Propulsion Laboratory, Pasadena, Calif. CREDIT: NASA JPL |
"This research holds tremendous potential for the NASA Aquarius mission to monitor the surface salinity of the global ocean," Busalacchi said. Aquarius is scheduled for launch during 2006-2007. Aquarius will provide the first global maps of salt concentration on the ocean surface. Salt concentration is a key area of scientific uncertainty in the oceans' capacity to store and transport heat, which in turn affects Earth's climate and water cycle.
By using remote sensing data from satellites, scientists will be able to see changes in ocean salinity. Knowing the lag time factor, computer models simulating the movement of the atmosphere may be able to accurately predict El Niño episodes. This may lead to longer lead-time for predictions of ENSO events.
Florida State University, the National Center for Environmental Prediction, National Center for Atmospheric Research and the Etudes Climatiques de l'Ocean Pacifique tropical program at Institut de Recherche pour le Developpement, Centre de Noumea contributed ocean and atmosphere data to this study.
For more information contact:
Elvia H. Thompson Headquarters, Washington, DC (Phone: 202/358-1696)
Rob Gutro NASA Goddard Space Flight Center, Greenbelt, Md. (Phone: 301/286-4044)
Lee Tune University of Maryland Phone: 301-405-4679
Harvey Leifert American Geophysical Union Phone: 202-777-7507
National Oceanic and Atmospheric Administration's El Niño webpage