December 12, 2002 - (date of web publication)
NASA DATA INDICATES EL NINO WILL INTENSIFY AND MOVE EAST
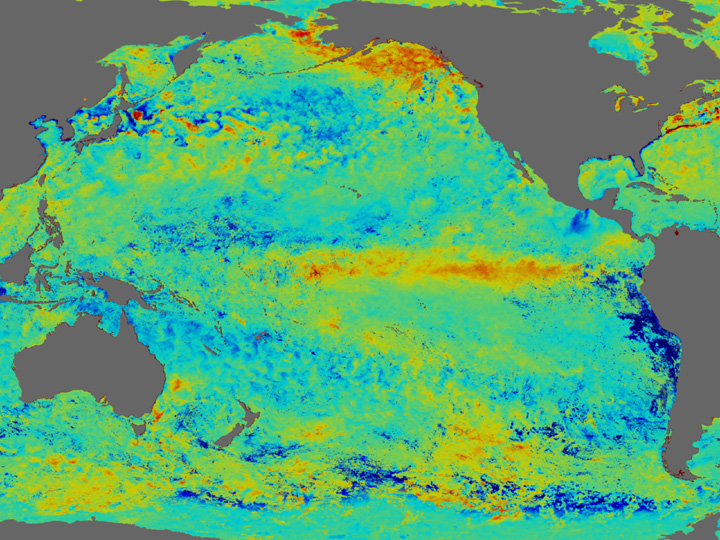
Image 1
![]()
Satellite data shows that warmer than normal waters are in the central Pacific Ocean unlike the last El Nino. During 1997-1998 El Nino, waters warmer than average were right up against the South American coast. Historically, El Nino’s effects on United States weather are greatest when the warm waters are nearing the coast of South America.

Image 2
NASA's seasonal to Interannual Prediction Project climate model(NSIPP) predicts that the El Nino will get a bit stronger and extend to the east. The January 15, 2002 NSIPP prediction shows a slight intensification of the warmer than normal Pacific waters in January. In the past, El Nino’s impact on U.S. weather was strongest from mid-January to early spring.
For more information contact:
Rani Chohan
Goddard Space Flight Center, Greenbelt, MD 20771
(Phone: 301/286-2483)
Caption for Image 1: SEA SURFACE TEMPERATURE ANOMALIES - November 24, 2002
The Moderate Resolution Imaging Spectrometer (MODIS) aboard the Terra satellite provided the data for this sea surface temperature anomaly image. It shows that El Nino’s warmest waters, reflected in yellows and reds, are concentrated in the middle of the equatorial Pacific Ocean throughout the fall. Courtesy: NASA
More high resolution images of Sea Surface Temperature Anomalies:
June 24, 2002 (9 MB)
July 24, 2002 (9 MB)
August 24, 2002 (9 MB)
September 24, 2002 (9 MB)
October 24, 2002 (10 MB)
Caption for Image 2: NSIPP BASED Sea Surface Temperature Anomaly forecast
This January 15, 2003 NSIPP prediction shows a slight intensification of the warmer than normal Pacific waters in January. Courtesy: NASA