Virtual Rain,
Electronic Storms:
|
 |
 |
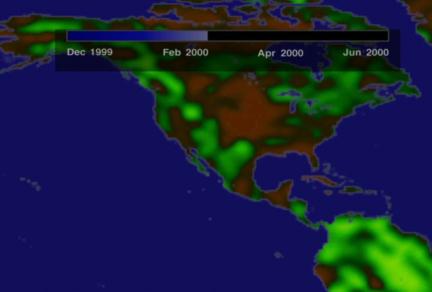
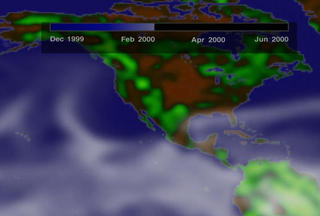
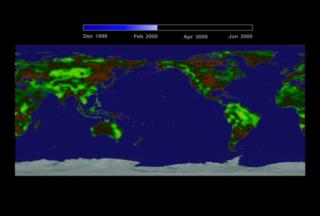
| Global Flat Map | Map With Water Vapor |
Looking Up by Looking Down: How Soil Moisture Affects Rainfall
For the purposes of this presentation, there are two important regions to the atmosphere: the planetary boundary layer, and the atmosphere above it. The boundary layer is the air found directly above the ground. It's a roiling, churning section of the atmosphere, mainly stirred up by friction against the surface of the planet. Within the confines of certain variables, the boundary layer's maximum height is limited; the atmosphere above it is generally far calmer and colder. In the following animations we see how soil moisture affects rainfall. The first shows summer weather trends with moist soil conditions. The second gives a corresponding look at dry soil conditions.An Affinity for Water: Soil Moisture Coaxes Repeated Soakings
View Images and Movies
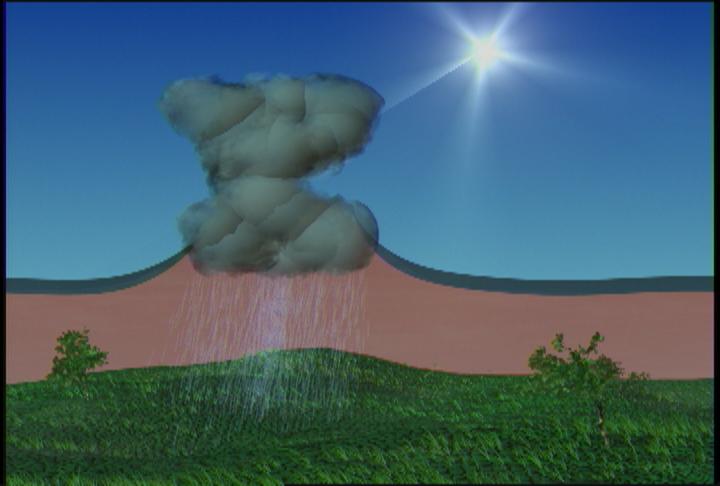
Unlike wintertime precipitation, which is primarily a function of organized storm systems, summertime precipitation is mostly a function of convection. For convective processes during the warm months to yield rain, however, an adequate level of soil moisture is necessary. In this animation we see warm, moist ground being heated by the rising sun. As the temperature climbs, moisture evaporates from the ground, saturating the air.. This creates a higher "virtual temperature" for the layer of air close to the ground, as water vapor can store larger amounts of energy than the surrounding air molecules. That energetic, saturated mass rises as it warms until it breaks through the planetary boundary layer, rushing into the colder, less dense upper atmosphere. As it rises, the air rapidly cools, causing the suspended water vapor to condense. This creates the familiar thunderclouds that often accompany summer rains. Continued condensation inside those clouds ultimately form droplets that become too heavy to remain aloft and they fall from the sky as rain.
It's interesting to note that the reason most thunderstorms occur in the late afternoon or early evening is precisely due to this convective cycle. It takes most of the day for the sun to sufficiently warm the moist air near the ground so that it has enough energy to rise high enough, break through the boundary layer, and form a thundercloud.
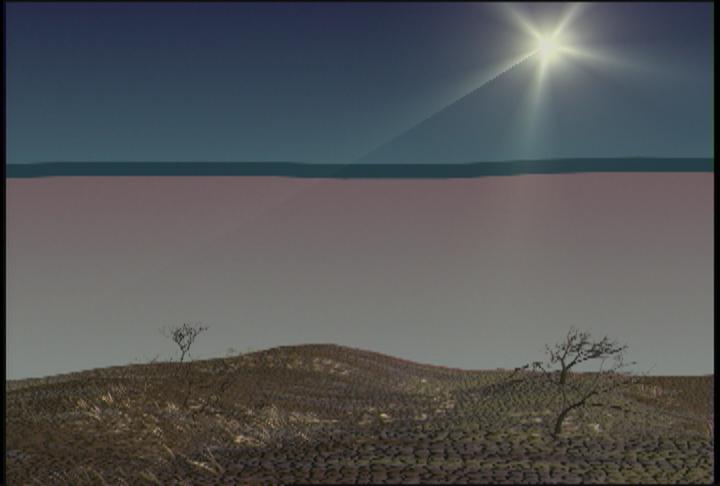
Dry Spring, Dry Summer: Arid Ground Inhibits Rainfall
View Images and Movies
Spring and summer seasons that start out dry are likely to remain dry. That's because inadequate soil moisture in the beginning inhibits the production of rain clouds, thus perpetuating an inhibited cycle of rain, evaporation, and condensation.
Here's what happens: dry soil heats up during the day. The planetary boundary layer warms and rises. As it rises, it expands. But without the added energy contained in evaporated moisture, it does not have either enough power to break into the upper regions of the sky, nor enough moisture to condense into rain clouds if it does manage to poke through. In other words, the boundary layer expands as it warms, but rain clouds do not form. Dry conditions at the beginning of the season often mean dry conditions for months.
This is one of the reasons large parts of the United States showed such severe drought this summer. A lack of initial soil moisture from weak spring rains inhibited continued precipitation cycles. The record-breaking Texas dry spell, particularly around Dallas, is a perfect example. Without high enough soil moisture across Texas's wide open spaces, the sun simply beat down on the already parched ground each day, pulling residual moisture out of the earth without being able to generate enough atmospheric energy to cause a significant condensation event.
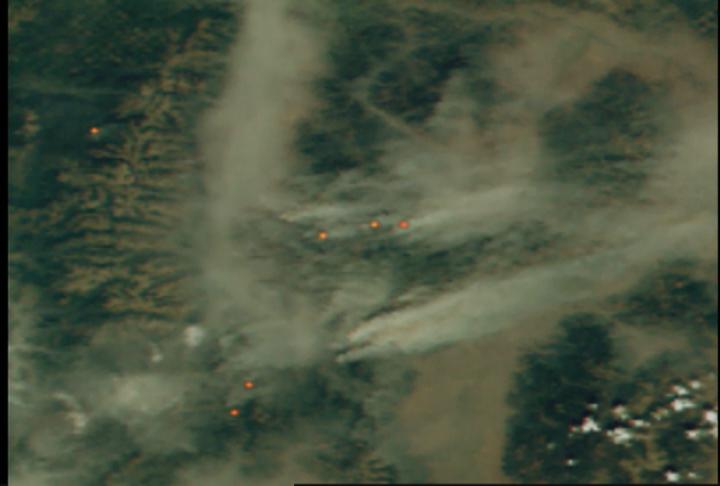
The Western Pall of 2000: NASA Studies US Fire Season from Space
MODIS--Terra 9/4/2000
View Images and Movies
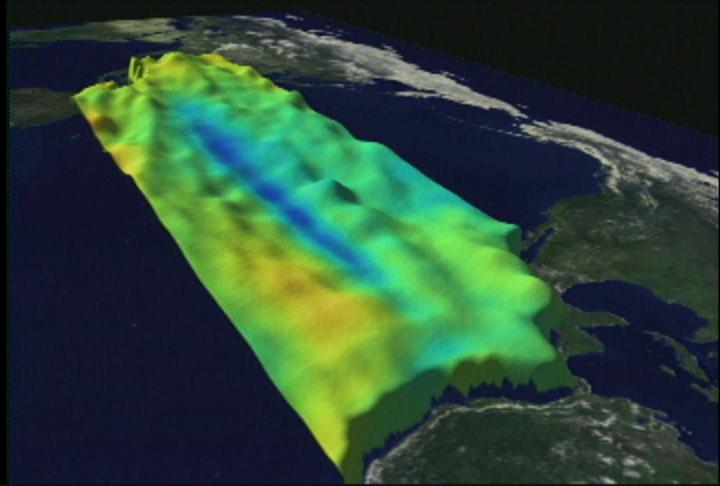
The Earth's climate is a dynamic system held in delicate balance. While minor variations in that system may not be manifest and singular causes of major events, they can have enormous contributing influence. Consider the following image taken September 4th by an instrument called MODIS (Moderate Resolution Imaging Spectroradiometer) onboard NASA's new satellite Terra. In it we see the scale and range of the devastating fires that continue to chew through huge stretches of the American West. While not directly the result of subtle changes in the climate, the risks of western fires greatly increased as drier than normal conditions pervaded much of North America.
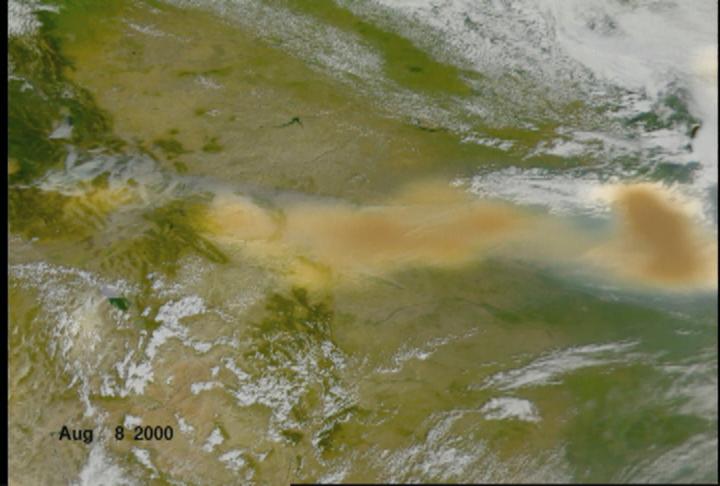
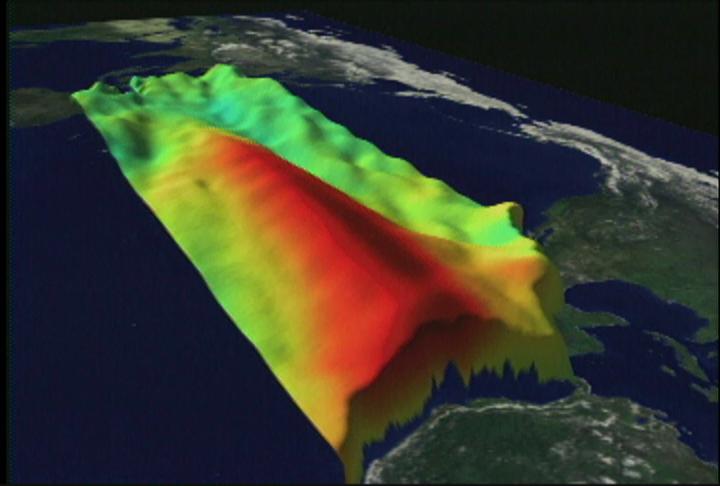
SeaWiFS 8/11/2000
View Images and Movies
While fires tormented authorities and residents across the western United States, evidence of the disaster's immense scale floated across the country.. In the following satellite images, heavy smoke and aerosols can be seen travelling as far East as the Great Lakes. The image of the United States and the smoke drifting across it like a gauzy veil were collected by NASA's SeaWiFS (Sea-viewing Wide Field of View Sensor) instrument. The patches of amber that fade onto the screen show information collected by the space agency's TOMS (Total Ozone Mapping Spectrometer) instrument. The TOMS data show that heavy smoke from the western blazes significantly raised ambient particulate concentrations more than a thousand miles away from the fires themselves.
The Pacific Siblings--El Niño and La Niña
 |
 |
| El Niño | La Niña |
Rarely a week goes by that at least one of these two Pacific Ocean phenomena isn't at least mentioned in a weather broadcast. That's because research into the dynamics of these powerful climatological forces continues to provoke new questions into how the planet's climate system works as a whole.
During an El Niño event, vast regions of the Pacific Ocean are measurably warmer than average; a La Niña phase manifests itself with measurably cooler temperatures in the Pacific. Considering the immense size of the Pacific and the energy required to cause significant thermal changes to so much water, it's easy to see how these sibling phenomena might dramatically affect wider climate conditions around the planet.
Bet Your Desktop System Can't Do This!

View Images and Movies
While fires tormented authorities and residents across the western United If scientific computers were competitive runners, this one would be going to the olympics. The Cray T3E supercomputer at the Goddard Space Flight Center is no longer state of the art, but it still makes short work of heavy-duty data crunching tasks like climate modeling. Due to advances in computer technology, folks at Goddard admit that this system no longer holds the title of 5th fastest computer in the world, a title dating back to its activation in 1996.
But the machine is still in the top thirty--fast enough to simulate the intricacies of weather and climate systems around the world. In terms of speed, this system cooks--really! The computer gets rid of excess heat through an intricate circulatory system pumping custom designed coolant. While the personal computer on your desk might simply get warm as it runs, consider the needs of a system that packs more than 1300 processors and attendant system circuits into one tight space, all running at the same time.
EYES ON THE EARTH:
NASA'S REMOTE SENSING FLEET
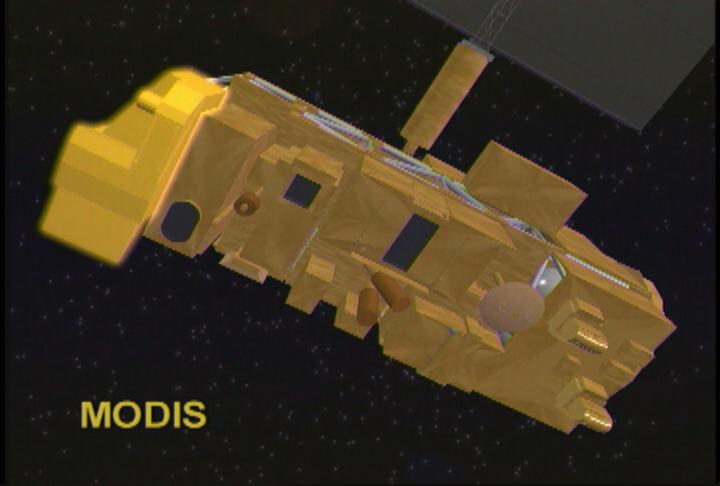
MODIS -- Terra's Worldwide Biosphere Instrument
View Images and Movies
In science, color is more than simply a characteristic. It's information. MODIS collects images of the Earth's surface, reading the various spectra (or color) of reflected radiation from different points on the globe . Primary investigative pursuits for MODIS include the study of surface temperature (including fire detection), ocean sediment and phytoplankton concentrations, vegetation maps, pollution, snow cover, and more.
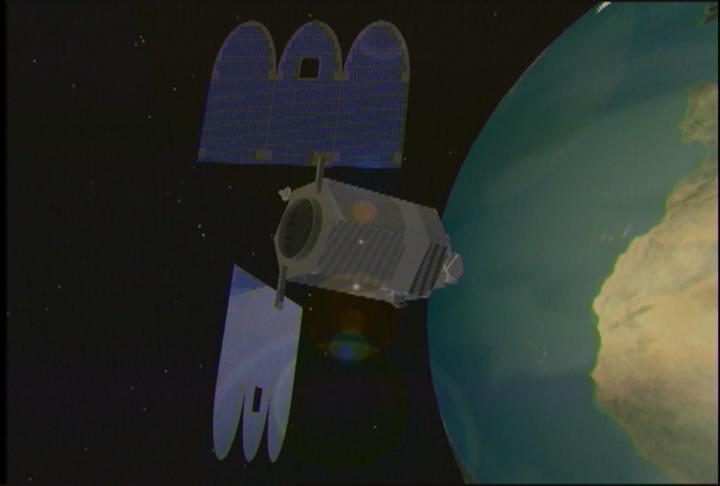
TOMS -- An Orbiting Ozone Observatory
View Images and Movies
The current TOMS instrument flies on NASA's Earth Probe, launched in July 1996. Its ozone mapping capabilities come from the instrument's abilities to monitor reflected ultraviolet light. By making nearly 200,000 daily measurements, the instrument can survey nearly the entire planet on a regular basis, offering scientists a powerful tool for measuring both sudden and long-term climatological changes.
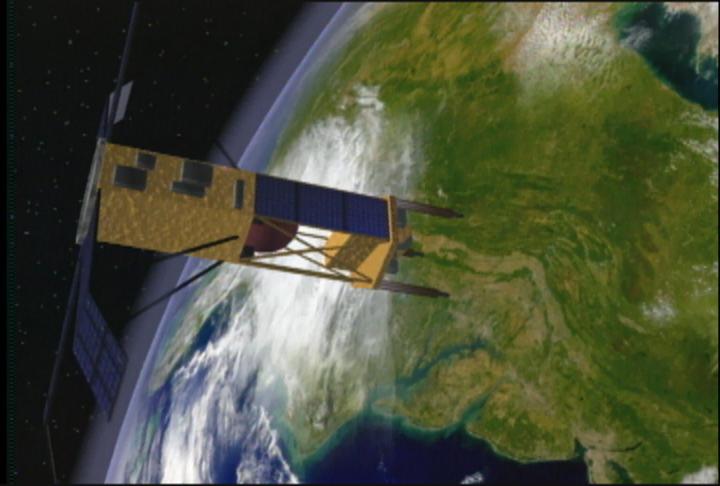
SeaWiFS -- Monitoring Ocean Color and More
View Images and Movies
The Sea-Viewing Wide Field-of-View Sensor onboard the SeaSat satellite has proved to be one of the most productive and successful Earth observing instruments in NASA's fleet. Designed to monitor the color of the ocean as a means for studying its productivity, SeaWiFS also has proved to be invaluable in its abilities to resolve land color. The instrument has enabled consistent, accurate monitoring of a wide variety of planetary processes, while far exceeding the goals of its primary mission.
For further information about climate change, soil moisture forecasts, weather models, fire research, remote sensing, and other related topics, check out the following web sites:
- The NASA Seasonal-to-Interannual Prediction Project
- The SeaWiFS Instrument
- The TOMS Instrument
- The MODIS Instrument
- The TOPEX/Poseidon Satellite
- The Earth Observatory
- Forest Service Fire & Aviation
- USGS Water Resources
- Hydrologic Information Center
- National Drought Mitigation Center
Special Thanks to Dr. David Adamec, NSIPP
This multimedia project is the work of a dedicated team of researchers, animators, and media specialists. A companion video to this web site is available from NASA-TV. Below are a list of agencies, departments, and researchers who provided expertise and data for this production:
NOTE: All SeaWiFs images and data presented on this website are for research and educational use only. All commercial use of SeaWiFs data must be coordinated with ORBIMAGE.
Please give credit for these images to:
NASA - Goddard Space Flight Center
Scientific Visualization Studio
Television Production NASA-TV/GSFC
The SeaWiFs Project and ORBIMAGE
Content Preparation and Project Production: Michael Starobin
Last Revised: February 4, 2019 at 06:02 PM EST