CELEBRATING 30 YEARS OF IMAGING THE EARTH (Go to images/animations)
NASA and the U.S. Geological Survey this week celebrate Landsat's 30th anniversary of imaging the Earth.
On July 23, 1972, NASA launched the first Landsat satellite, beginning the longest-running record of Earth's continental surfaces as seen from space -- a record unmatched in quality, detail, coverage and importance. This 30-year archive of imagery, a scientific partnership between NASA and the U.S. Geological Survey (USGS), provides invaluable historical detail that helps us understand and protect our home planet.
"In essence, this archive of Landsat imagery is the equivalent of having a periodically refreshed family photo album for the entire Earth," said Dr. Ghassem R. Asrar, NASA Associate Administrator of the Office of Earth Science. "The scientific data gathered by these spacecraft allow us to see changes on the Earth's surface over time, giving us insight into what is happening and helping us plan for the future."
In celebration of the 30th anniversary of the first Landsat launch, NASA and the USGS have assembled an exhibit called "Landsat: Earth as Art." These images, created by the USGS using Landsat 7 data, introduce the general public to the Landsat Program, administered jointly by USGS and NASA. The USGS operates Landsat 5 and 7 and manages the national archive of data collected by all the Landsat satellites, distributing these data to researchers around the world.
"This archive of imagery is a valuable tool for scientists and researchers as they work to gain a better understanding of the Earth and its complex systems," said Charles Groat, USGS Director. "Long-term monitoring information is critical for maintaining the health and safety of our communities, our economy and our environment."
The "Landsat: Earth as Art" exhibit highlights 41 images selected on the basis of aesthetic appeal. The exhibit opens July 23 at the Library of Congress in Washington. A selection of "Landsat: Earth as Art" images will be on display in the Russell Senate Office Building Rotunda in Washington, July 22-26, and in the fall at the Arizona Science Center in Phoenix. A similar exhibit is currently on display in Rapid City, S.D., at the Children's Science Center.
The first Landsat -- originally called ERTS, for Earth Resources Technology Satellite -- was developed and launched by NASA in 1972. Landsat 5 is still transmitting images, and the Landsat 7 mission has built upon the historic strengths of the Landsat program. The low cost of Landsat 7 data, as well as the elimination of data copyright, has fostered an environment in which users are free to experiment with novel applications, and use large quantities of data for existing applications.
Data from Landsat satellites serve many purposes. Landsat satellites monitor important natural processes and human land use such as vegetation growth, deforestation, agriculture, coastal and river erosion, snow accumulation and fresh-water reservoir replenishment, and urbanization. The USGS uses Landsat data to spot the amount and condition of dry biomass on the ground, which are potential sources for feeding wildfires that can threaten humans, animals and natural resources. Farmers and land managers use Landsat data to help increase crop yields and cut costs while reducing environmental pollution.
Continuity of data with previous Landsat missions is a fundamental goal of the Landsat program. Landsat Program Management (NASA and USGS) is required by public law to continue gathering and preserving this important scientific data. The planned follow-on to the Landsat program, the Landsat Data Continuity Mission (LDCM), is a cooperative effort between government and private industry to provide continuity of land surface measurements, with no data gaps, beyond Landsat 7.
Landsat is part of NASA's Earth Science Enterprise, a long- term research effort to understand and protect our home planet. Through the study of Earth, NASA will help to provide sound science to policy and economic decision-makers so as to better life here, while developing the technologies needed to explore the universe and search for life beyond our home planet.
LANDSAT PAINTS A PORTRAIT OF OUR CHANGING PLANET
Thanks to Landsat satellites, we now have a 30-year record of the Earth's surface. These satellites, along with documentation of our planet, provide valuable information that will help us understand and protect our home planet. Continuity of data with previous Landsat missions is a fundamental goal of the Landsat program. No other current or planned remote-sensing system, public or private, fills the role of Landsat in global change research or in civil and commercial applications. The thirty-years of data acquired by the Landsat satellites constitutes the longest continuous record of the Earth's continental surfaces. (Note: numbers in parenthesis beginning with the letter "G" refer to the resource tape number for the ordering of videos--see http://www.gsfc.nasa.gov/indepth/gtv_catalog_earth.html for more information about these tapes.)
THE ART EXHIBIT:
Landsat imagery is beautiful whether you're looking at it from an
artistic standpoint or trying to extract useful information.
In celebration of the 30th Anniversary of the first Landsat
launch, NASA and the U.S. Geological Survey created an exhibit
called "Earth as Art." The exhibit will be open
July 17th at the Library of Congress in Washington, D.C. A
selection of the "Earth as Art" images will be on
display in the Russell Office Building Rotunda in the District
of Columbia July 20-26, and through the month of August at
the Arizona Science Center in Phoenix and Roanoke Virginia
Center in the Square. Another exhibit is on display in Rapid
City, S.D. at Children's Science Center. The "Landsat:
Earth as Art" exhibit highlights images that were selected on the basis of aesthetic appeal. These images use the visceral
avenue of art to convey the thrilling perspective of the Earth
that Landsat provides to the viewer. The images, created by
the USGS EROS Data Center, introduce the world to the Landsat
Program administered jointly by USGS and NASA.
"EARTH IS ART" SEQUENCES:
Animation 1
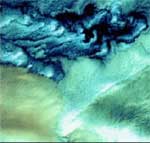
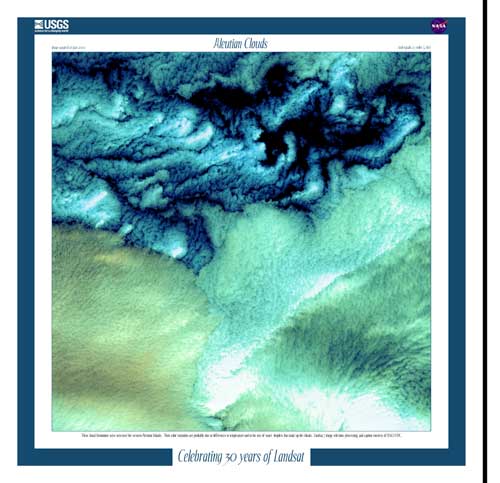
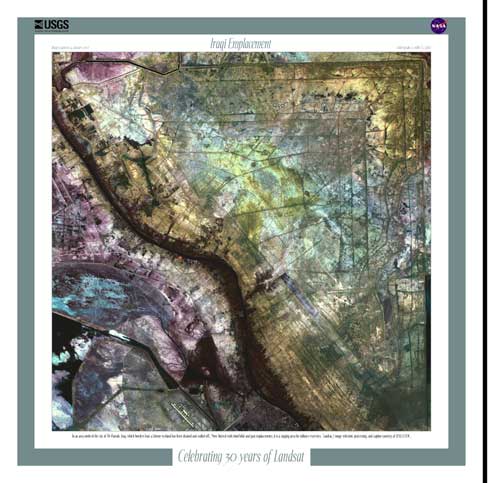
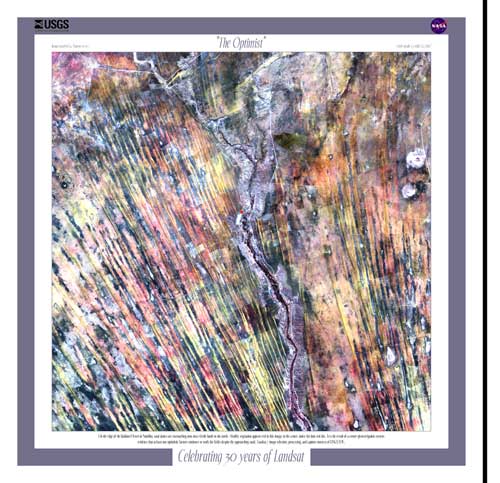
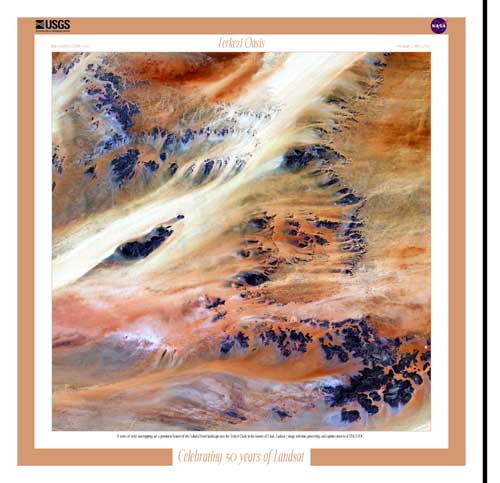
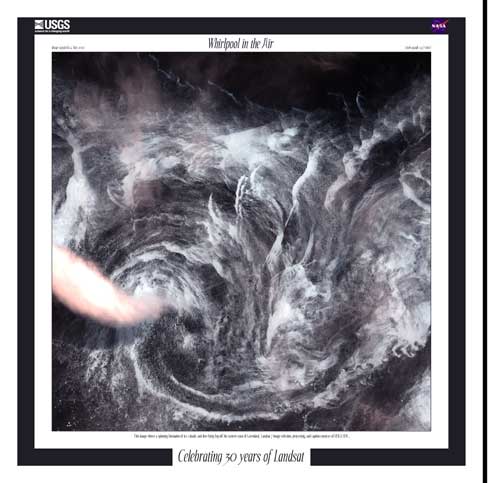
Morph Sequence - This sequence includes 6 six images from the "Earth Is Art" Exhibit. The following Landsat images were used to create the sequence: Aleutian Clouds; "The Optimist," Kalahari Desert - Namibia; Terkezi Oasis - Chad; Iraqi Emplacement; Dasht-e Kevir, Iran (Great Salt Desert); Whirlpool in the Air off of Greenland.
Animation 2
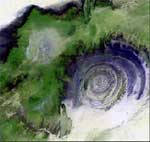
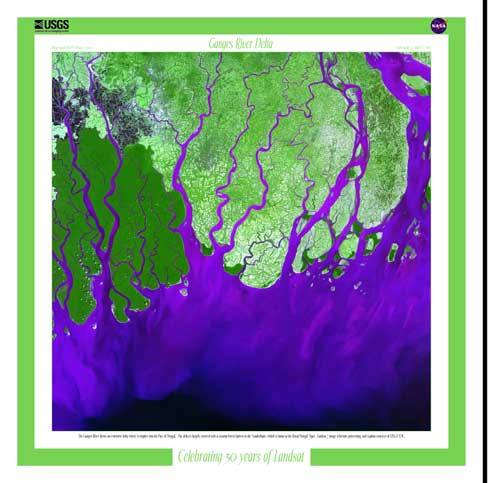
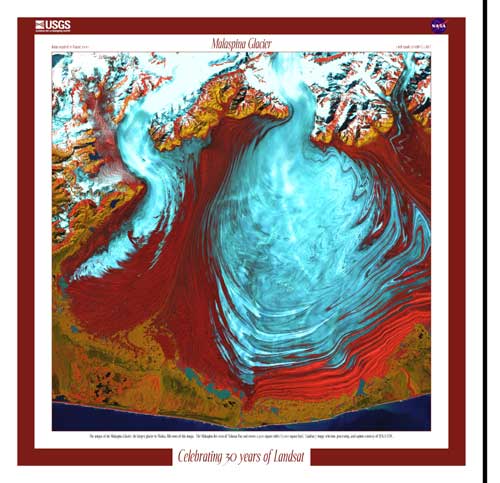
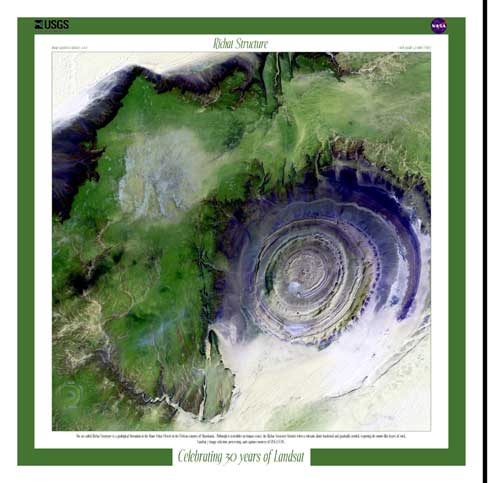
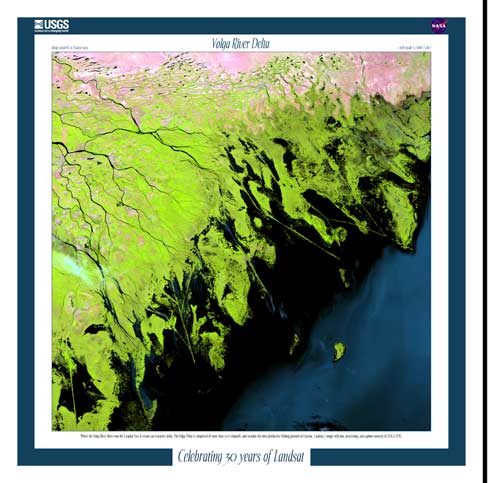
Bright Blur Sequence - This sequence includes 6 six images from the "Earth Is Art" Exhibit. The following Landsat images were used to create the sequence: Richat Structure - Mauritania; Lena Delta - Russia; Ganges River Delta; Volga River Delta; Malaspina Glacier - Alaska; Florida Everglades.
| THE IMAGES - Here are the original 12 images used to create the art sequences. | |||
 |
 |
 |
 |
| Aleutian Clouds (6/16/2000) |
Dasht-e Kevir, Iran (Great Salt Desert) (10/24/2000) |
Florida Everglades (2/5/2000) |
Ganges River Delta (2/28/2000) |
 |
 |
 |
 |
| Iraqi Emplacement (1/24/2001) |
Lena Delta - Russia (7/27/2000) |
Malaspina Glacier - Alaska (8/31/2000) |
The Optimist, Kalahari Desert, Namibia (8/14/2000) |
 |
 |
 |
 |
| Richat Structure - Mauritania (1/11/2001) |
Terkezi Oasis - Chad (10/22/2000) |
Volga River Delta (8/29/1999) |
Whirlpool in the Air off of Greenland. (5/14/2001) |
A LEGACY OF CHANGE:
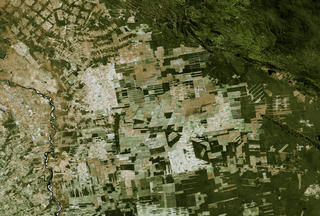
Data collected from various Landsat spacecraft show dramatic changes to the environment from natural events and human influence. By collecting images of the same areas over long stretches of time, complex trend analyses are possible to a degree unattainable without remote sensing technologies. Observing urban areas over time with Landsat imagery can show just where growth is occurring and provide valuable information for urban planners. Farmers and land managers are using Landsat data to help increase crop yields and cut costs while reducing environmental pollution. Scientists also use Landsat data to study land surfaces and coastal regions and to determine how distinct environments are affected by global and regional climate change.
Animation 3
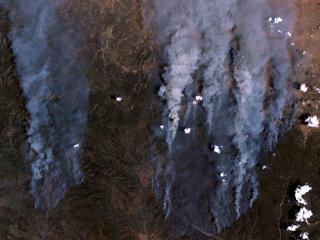
RODEO AND CHEDISKI FIRES IN ARIZONA - On June 21, 2002, the Rodeo and Chediski Fires in east-central Arizona were still two separate fires. This true-color scene from the Enhanced Thematic Mapper Plus aboard the Landsat 7 satellite shows the massive quantities of smoke streaming northward from the fires, which are burning about 100 miles east-northeast of Phoenix. The smaller Chediski Fire is on the right, and the Rodeo Fire is on the left. Over the weekend of June 22, the two fires merged into a single 300,000+ acre blaze.
Animation 4
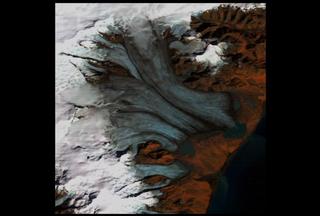
CHANGE AT BREIDAMERKURJÖKULL ICELAND, 1973-2000 (G01-085)
- Images taken by Landsat 1 on September 22, 1973 and Landsat
7 on September 23, 2000 show the almost two kilometer (1.2
mile) recession of the Breidamerkurjökull over the 27
year period. You can see the creation of icebergs in the lake
in front of the glacier. In these scenes, bare glacier ice
surfaces appear bluish-white, while those covered in snow
are bright white. Water surfaces are dark blue and land surfaces
appear reddish. CREDIT:
USGS/NASA

Animation 5
DISAPPEARING WATER: THE ARAL SEA OVER TIME (G01-A027) - The Aral Sea
is actually not a sea at all. It is an immense lake, and in
the last thirty years, more than sixty percent of it has disappeared.
Poor management of regional water resources, from irrigation
to urban and industrial development has dramatically affected
the Aral. In the following sequence of images, we see a series
of Landsat scenes taken several years apart. As the years
pass, we see the profound reduction in overall area, and a
commensurate increase in land area as the floor of the sea
now lies exposed. CREDIT: USGS/NASA
Animation 6
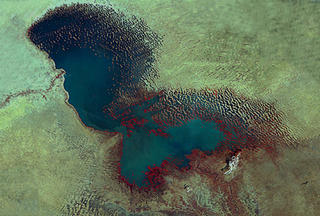
FIFTEEN YEARS OF A SHRINKING LAKE (G01-085) - When it thrived, Lake Chad was one of those ironic points of planetary formation in that it seemed to defy the vast ocean of sand directly to its north. Persistent drought has caused the lake to drop from its former sixth place position in the list of world's largest lakes; it is now one tenth it's former size. The most dramatic decrease in the size of the lake is shown in the fifteen years between January 1973 and January 1987. Beginning in 1983 the amount of water used for irrigation began to increase. Ultimately, between 1983 and 1994, the amount of water diverted for purposes of irrigation quadrupled from the amount used in the previous 25 years. The red color denotes vegetation on the lakebed and the ripples on the western edge of the lake denote sand dunes formed by the wind. CREDIT: USGS/NASA
Animation 7
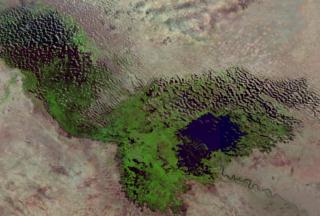
LAKE CHAD TODAY (G01-085) - In this composite of Landsat-7 images from November 2000 to February 2001 we see Lake Chad as it appears today. The small patch of visible blue that is now the lake stands in stark contrast to the wide swath of the old lakebed (shown in green, indicating vegetation.) CREDIT: USGS/NASA
Animation 8
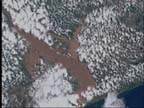
MOZAMBIQUE FLOODING (G01-A027) - Following weeks of heavy rains in late Winter 2000, massive flooding inundated wide tracts of eastern and southern Africa, displacing more than 200,000 people. This side by side Landsat sequence shows the comparative size of rivers in Mozambique before and during the floods. Notice how the high waters have all but covered the lowlands, far exceeding the boundaries of the normal river system. CREDIT: USGS/NASA
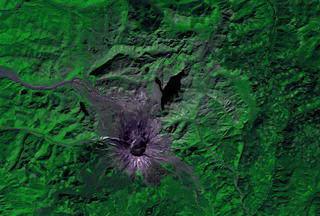
MT. ST. HELENS OVER TIME (G01-A027) -
Animation 9
The explosion of Mt. St. Helens volcano in Washington State on May 18, 1980 sets the scene for one of Landsat's most important capabilities. As a means for archiving surface features, researchers can study how the Earth changes over time. In this sequence, pictures of the mountain taken in 1973, 1983, and 2000 show how the eruption changed the surrounding area. Notice how the north face of the mountain dramatically changed following the blast. The crater's mouth elongated, and significant ash deposits altered the down slope terrain. CREDIT: USGS/NASA
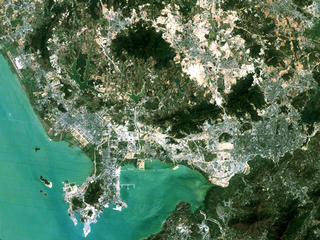
SHENZHEN, CHINA 1988-1996: EXPLOSIVE URBAN GROWTH CHANGES A CONTINENT (G01-A027)
Animation 10
True Color Sequence - The People's Republic of China is one of the fastest growing economies in the world. Additionally, much of the Chinese political and cultural landscape is in a state of transition, and economic development is remarkably strong, particularly in southern industrial cities. As seen by Landsat, Shenzen, China practically transforms from a regional urban center to a metropolitan powerhouse in the space of roughly ten years. Notice along the southern peninsula as the actual outline of the land changes, with huge structures emerging in the waters off-shore. Landsat 5 collected the data. You can see how roads, bridges, and massive construction projects transform the landscape. New structures appear off the southern coast, and highways grow less distinct against the background as significant building spreads along the sides of the roads. Also notice how the massive growth alters lakes and mountains in the area, adding sediment and changing borders. CREDIT: USGS/NASA
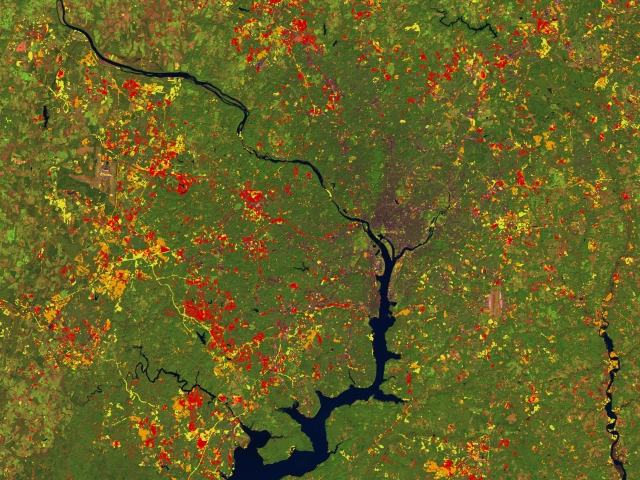
URBAN GROWTH IN WASHINGTON, DC
Animation 11
(G01-043) - These images show the progression of urban growth in the DC area from 1973 to 1996. Urban sprawl results in more paved surfaces and less area for water to drain into soils. Reduced drainage areas then bring more water into drainage systems at a faster rate, eroding stream and rivers and reducing water quality because more sediments are mixed into the water. According to researchers, if you increase an impervious surface near a stream by creating a paved parking lot, for example, you directly affect the quality of life in the stream because of the runoff that surface will generate. CREDIT: USGS/NASA
LOSING FORESTS IN BOLIVIA
Animation 12
(G01-A027) - This scene starts in space, high above South America. As we zoom in closer, we see the national outlines of Bolivia come into view on the map. By focusing on one particular region, we're able to see effects of deforestation in the equatorial forest. The sequence that follows shows two images of the Santa Cruz region of Bolivia. The first was taken in 1984. Landsat 7 took the second in 2000. In just a few short years, we see how intense agricultural development has transformed the forest. CREDIT: USGS/NASA
TOUR OF GREAT SPACES (G99-071-016):
Visualizations generated from Landsat 7 data depict U.S. national parks and other locations in spectacular detail.
Animation 13
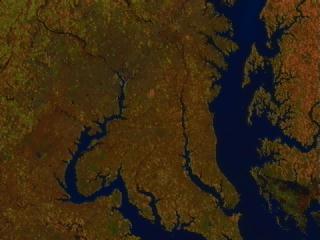
a)Chesapeake Bay Region
Animation 14
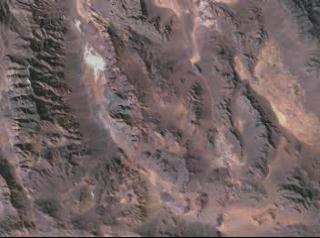
b) Death Valley
Animation 15
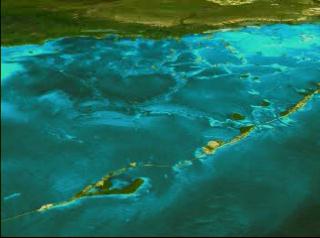
c) Florida Everglades
Animation 16
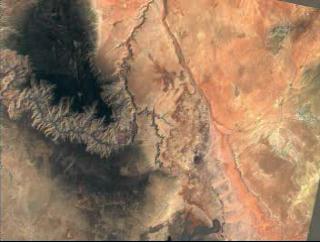
d) Grand Canyon
CREDIT: USGS/NASA
CREATING THE IMAGES:
Animation 17
LANDSAT ANIMATIONS (G99-019) - Landsat 7 is the latest in a series of Earth observing satellites that have provided remotely sensed observations of the Earth's land surface and coastal regions for over 26 years. Landsat 7 marks a new direction in the program to reduce the costs of data and increase global coverage for use in global change research.
FUTURE OF REMOTE SENSING:
The planned follow-on to the Landsat program, the Landsat Data Continuity Mission (LDCM), is a cooperative effort between Government and private industry to provide continuity of land surface measurements beyond Landsat 7 without any data gaps. Based on the Science Data Specification and Data Policy, jointly specified by NASA and the United States Geological Survey, LDCM data and data products will be provided by a commercially owned and operated system.
Animation 18
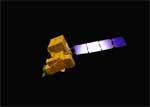
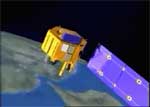
FASTER, BETTER, CHEAPER - (G00-A093) - In the future, exploration of the Earth will
demand research tools that can not only make some of their own decisions, but
deliver results faster, better and cheaper than their forebears. NASA's launch
of the experimental EO-1 satellite is a significant milestone in that journey.
Part of the space agency's New Millennium Program, engineers designed EO-1 to
test advanced technologies for instruments pointed at our own planet. The satellite
will not only demonstrate significant improvements in data collection capabilities,
but will also test methods for dramatically reducing costs and complexity to achieve
state of the art goals. CREDIT:
NASA
For more information contact:
Lynn Chandler
Goddard Space Flight Center
Greenbelt, MD 20771
301-286-2806
Elvia H. Thompson
Headquarters, Washington
(Phone: 202/358-1696)
Karen Wood
U.S. Geological Survey, Reston, Va.
(Phone: 703/648-4447)
Landsat website
Landsat Earth as Art website
July 22, 2002 - (date of web publication)