| Next Tape |
Goddard TV Video Tape: G2000-028 |
||
Movie |
Title |
|
|
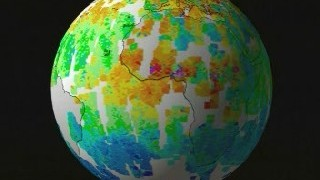
MOPITT Globe Unwrap with Zoom into TRMM Fire Data | |
|
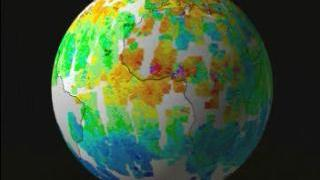
MOPITT Globe Unwrap | |
|
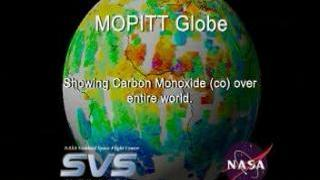
MOPITT Globe | |