Sun
ID: 4737
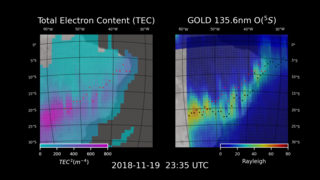
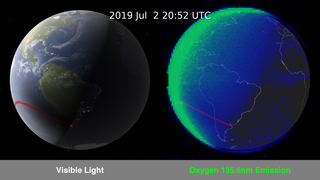
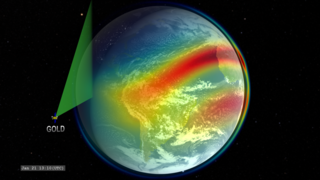
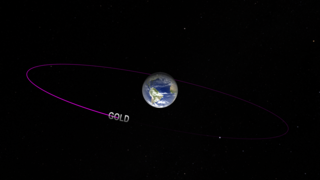
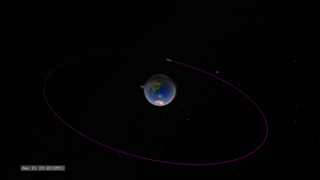
This is a visualization of data taken by the GOLD spectrometer aboard the SES-14 satellite. SES 14 is positioned in a geostationary orbit above 47.5 degrees west longitude so it always observes the same hemisphere. This data is of ultraviolet emission from Earth's ionosphere in a band near the wavelength of 135.6 nanometers, an emission line of atomic oxygen.
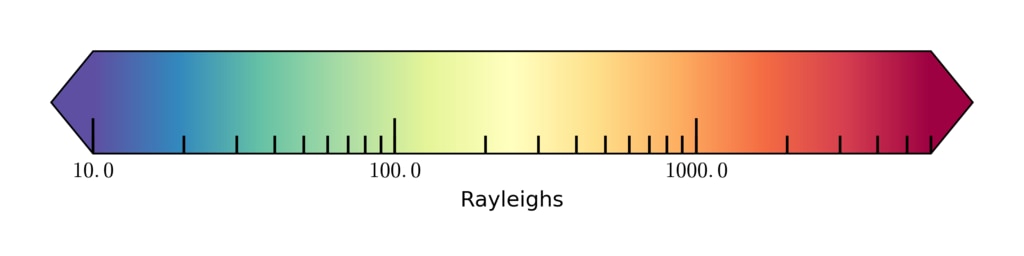
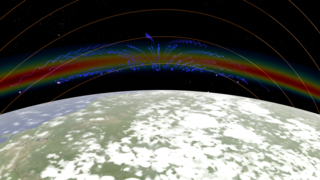
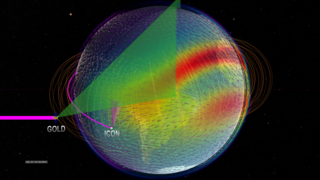
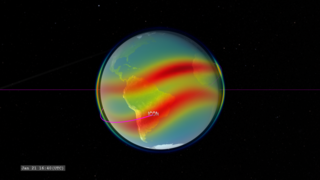
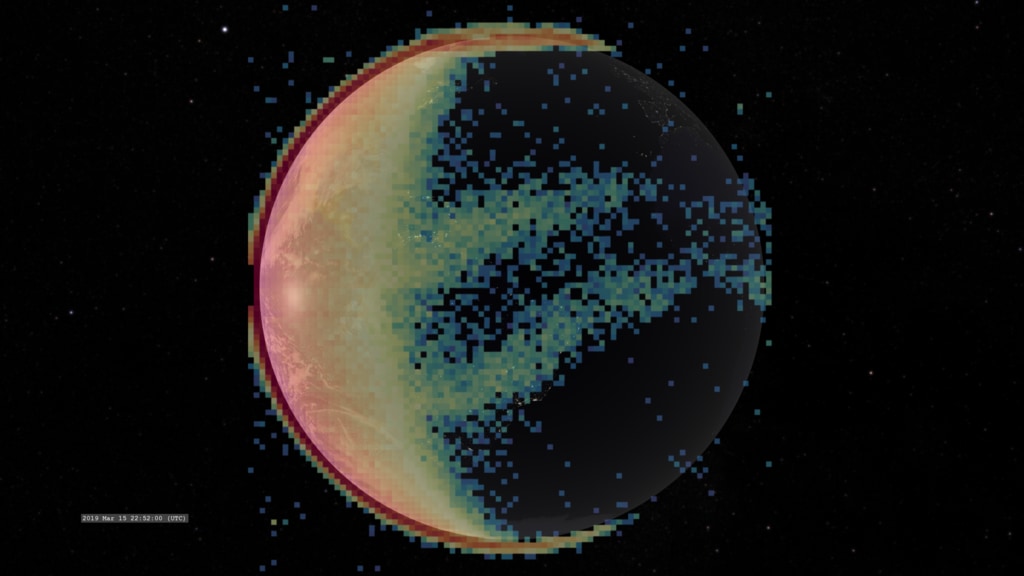
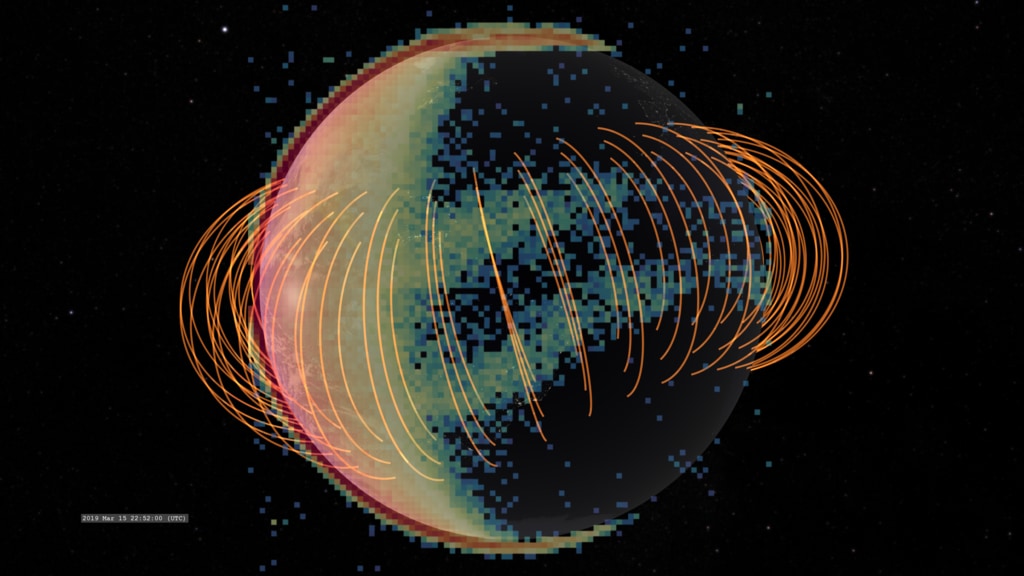
This data is presented with a spectral color table, where red is the bright and violet is dim. We see some this emission in the aurora (visible at the north and south polar regions), energized by electrons and ions streaming in from Earth's magnetic field. More emission is created during the day by sunlight pumping atomic oxygen into an energetic state. As the sun sets, the oxygen decays from the energized state, releasing a photon of ultraviolet light. We see more emission from two bands near the equator after sunset. This double-lobed enhancement straddles the magnetic equator which is offset around the geographic equator, especially over South America. This enhancement corresponds to the Appleton anomaly, originally discovered in 1946. In the version showing the geomagnetic field, it is easy to see how the field channels the excited atoms. See also Interface to Space: The Equatorial Fountain.
GOLD is a scanning instrument that alternates between scanning the northern hemisphere, and then the southern hemisphere (other scanning modes are possible, but not included in this visualization). The full-disk images shown here are created by combining these two hemisphere scans. The time difference between the scans creates a discontinuity at the equator which is particularly visible at the day-night terminator when these scans are combined for full-disk imaging. Differences between the north-south scan interval and south-north interval makes changes in this edge.
Between about 22:00 UT and 06:00UT the next day, there is a large data gap because the Sun would appear behind the Earth from the position of GOLD and potentially shine directly into the GOLD instrument.
Observing Earth's Ionosphere with GOLD
This data is presented with a spectral color table, where red is the bright and violet is dim. We see some this emission in the aurora (visible at the north and south polar regions), energized by electrons and ions streaming in from Earth's magnetic field. More emission is created during the day by sunlight pumping atomic oxygen into an energetic state. As the sun sets, the oxygen decays from the energized state, releasing a photon of ultraviolet light. We see more emission from two bands near the equator after sunset. This double-lobed enhancement straddles the magnetic equator which is offset around the geographic equator, especially over South America. This enhancement corresponds to the Appleton anomaly, originally discovered in 1946. In the version showing the geomagnetic field, it is easy to see how the field channels the excited atoms. See also Interface to Space: The Equatorial Fountain.
GOLD is a scanning instrument that alternates between scanning the northern hemisphere, and then the southern hemisphere (other scanning modes are possible, but not included in this visualization). The full-disk images shown here are created by combining these two hemisphere scans. The time difference between the scans creates a discontinuity at the equator which is particularly visible at the day-night terminator when these scans are combined for full-disk imaging. Differences between the north-south scan interval and south-north interval makes changes in this edge.
Between about 22:00 UT and 06:00UT the next day, there is a large data gap because the Sun would appear behind the Earth from the position of GOLD and potentially shine directly into the GOLD instrument.
Related

For More Information
Visualization Credits
Sarah L. Jones (NASA/GSFC): Scientist
Tom Bridgman (Global Science and Technology, Inc.): Lead Visualizer
Laurence Schuler (ADNET Systems, Inc.): Technical Support
Ian Jones (ADNET Systems, Inc.): Technical Support
Tom Bridgman (Global Science and Technology, Inc.): Lead Visualizer
Laurence Schuler (ADNET Systems, Inc.): Technical Support
Ian Jones (ADNET Systems, Inc.): Technical Support
Please give credit for this item to:
NASA's Scientific Visualization Studio
NASA's Scientific Visualization Studio
Short URL to share this page:
https://svs.gsfc.nasa.gov/4737
Mission:
Global-scale Observations of the Limb and Disk (GOLD)
Data Used:
Note: While we identify the data sets used in these visualizations, we do not store any further details nor the data sets themselves on our site.
This item is part of this series:
Interface to Space
Keywords:
GCMD >> Earth Science >> Sun-earth Interactions >> Ionosphere/Magnetosphere Particles
GCMD >> Earth Science >> Atmosphere >> Atmospheric Radiation >> Airglow
GCMD >> Location >> Ionosphere
GCMD >> Location >> Mesosphere
NASA Science >> Sun
GCMD >> Earth Science >> Sun-earth Interactions >> Ionosphere/Magnetosphere Dynamics
SVS >> Geostationary Orbit
GCMD keywords can be found on the Internet with the following citation: Olsen, L.M., G. Major, K. Shein, J. Scialdone, S. Ritz, T. Stevens, M. Morahan, A. Aleman, R. Vogel, S. Leicester, H. Weir, M. Meaux, S. Grebas, C.Solomon, M. Holland, T. Northcutt, R. A. Restrepo, R. Bilodeau, 2013. NASA/Global Change Master Directory (GCMD) Earth Science Keywords. Version 8.0.0.0.0
https://svs.gsfc.nasa.gov/4737
Mission:
Global-scale Observations of the Limb and Disk (GOLD)
Data Used:
SES 14/GOLD
Observed Data - 2019-03-13T06:10 - 2019-03-15T22:50
Global-scale Observations of the Limb and Disk (GOLD) is an ultraviolet imaging spectrograph to measure temperatures and densities in the Earth's thermosphere & ionosphere.
This item is part of this series:
Interface to Space
Keywords:
GCMD >> Earth Science >> Sun-earth Interactions >> Ionosphere/Magnetosphere Particles
GCMD >> Earth Science >> Atmosphere >> Atmospheric Radiation >> Airglow
GCMD >> Location >> Ionosphere
GCMD >> Location >> Mesosphere
NASA Science >> Sun
GCMD >> Earth Science >> Sun-earth Interactions >> Ionosphere/Magnetosphere Dynamics
SVS >> Geostationary Orbit
GCMD keywords can be found on the Internet with the following citation: Olsen, L.M., G. Major, K. Shein, J. Scialdone, S. Ritz, T. Stevens, M. Morahan, A. Aleman, R. Vogel, S. Leicester, H. Weir, M. Meaux, S. Grebas, C.Solomon, M. Holland, T. Northcutt, R. A. Restrepo, R. Bilodeau, 2013. NASA/Global Change Master Directory (GCMD) Earth Science Keywords. Version 8.0.0.0.0


