Earth
ID: 3953
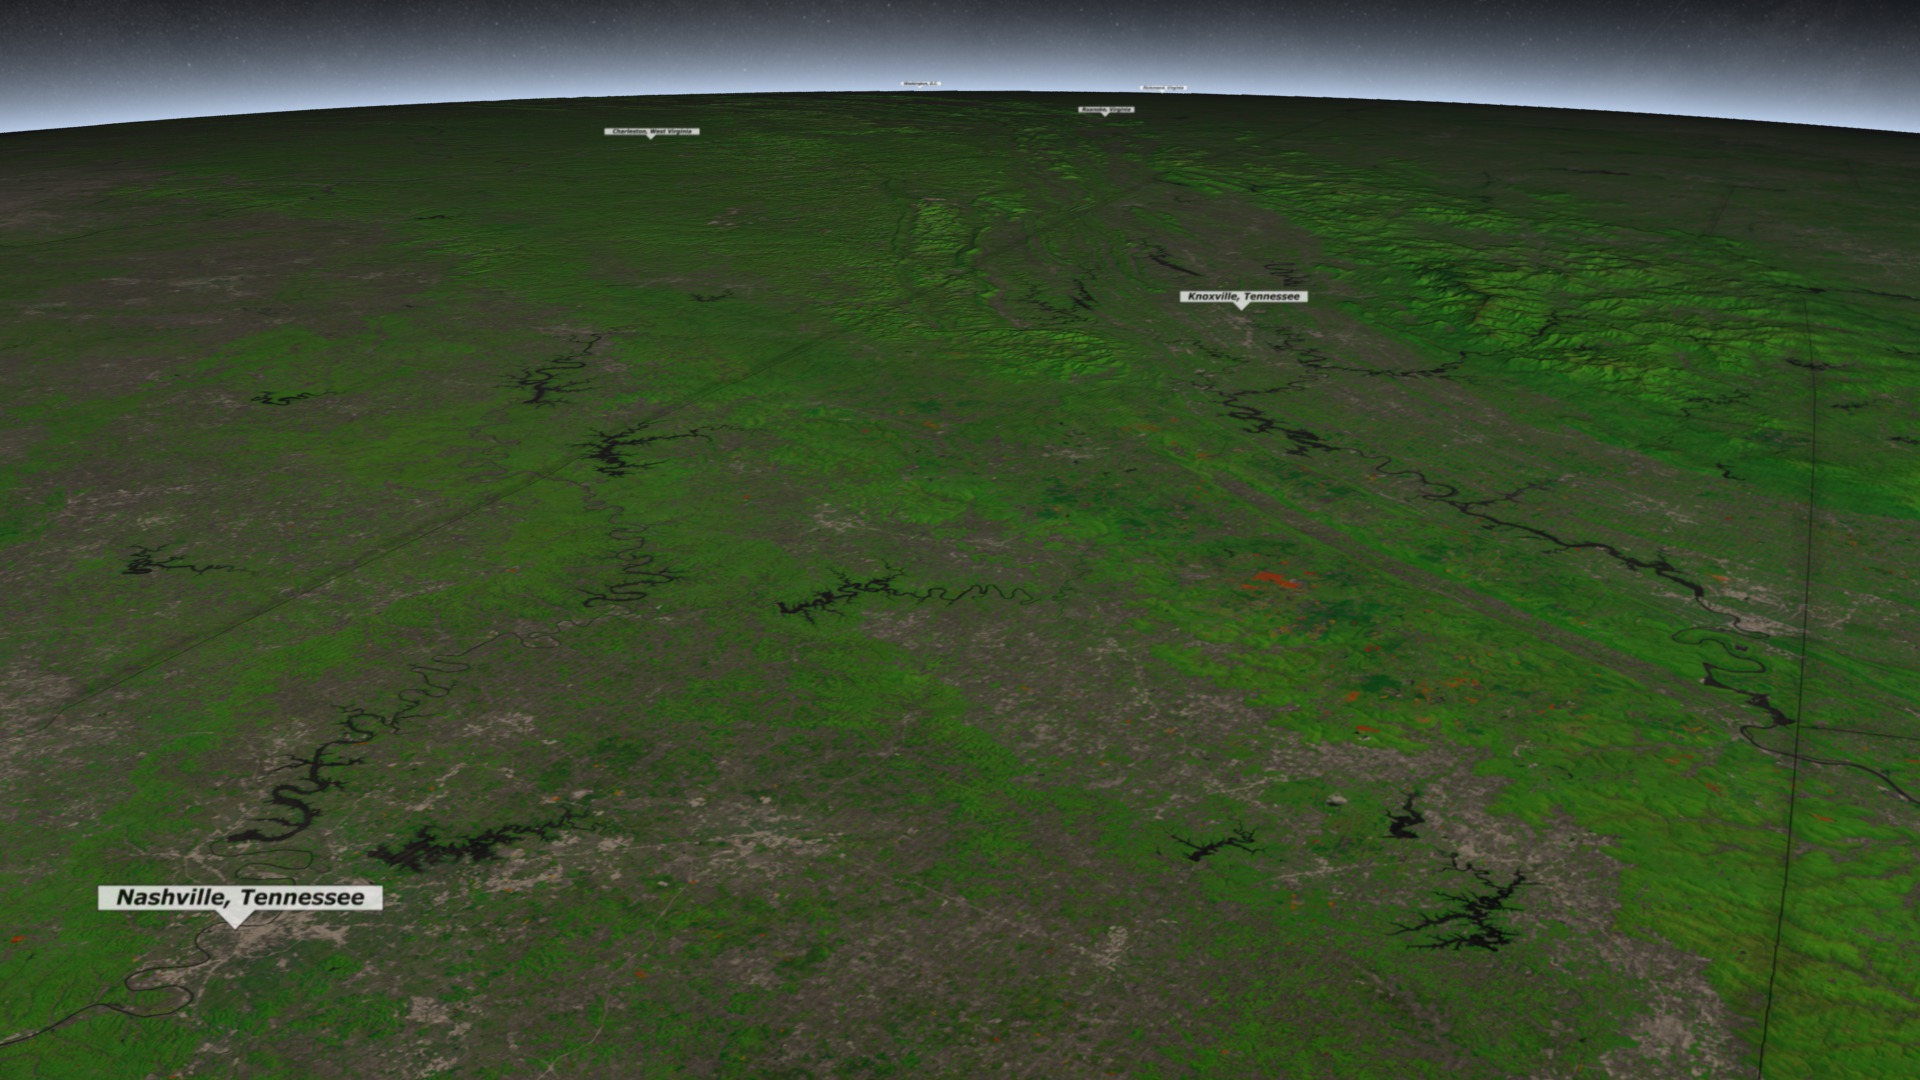
Humans actively change the Earth's landscape. Some of these changes can be seen from space through careful analysis of satellite data. In this visualization, we fly over the United States eastern seaboard highlighting large areas of deforestation and mountain top removal (in shades of orange and red) throughout the region. NASA scientists have worked on complex algorithms that allow us to see these changes through time more easily. The data depicted here covers the years 2006-2010. Areas in orange and red are the regions have have sustained the greatest change in this 4 year period. Oranges areas represent older change (closer to 2006) and darker reds are more current (2010). Only areas with greater than 25% tree cover are shown in shades of green. A muted gray-brown color is used for areas with less than 25% tree cover.


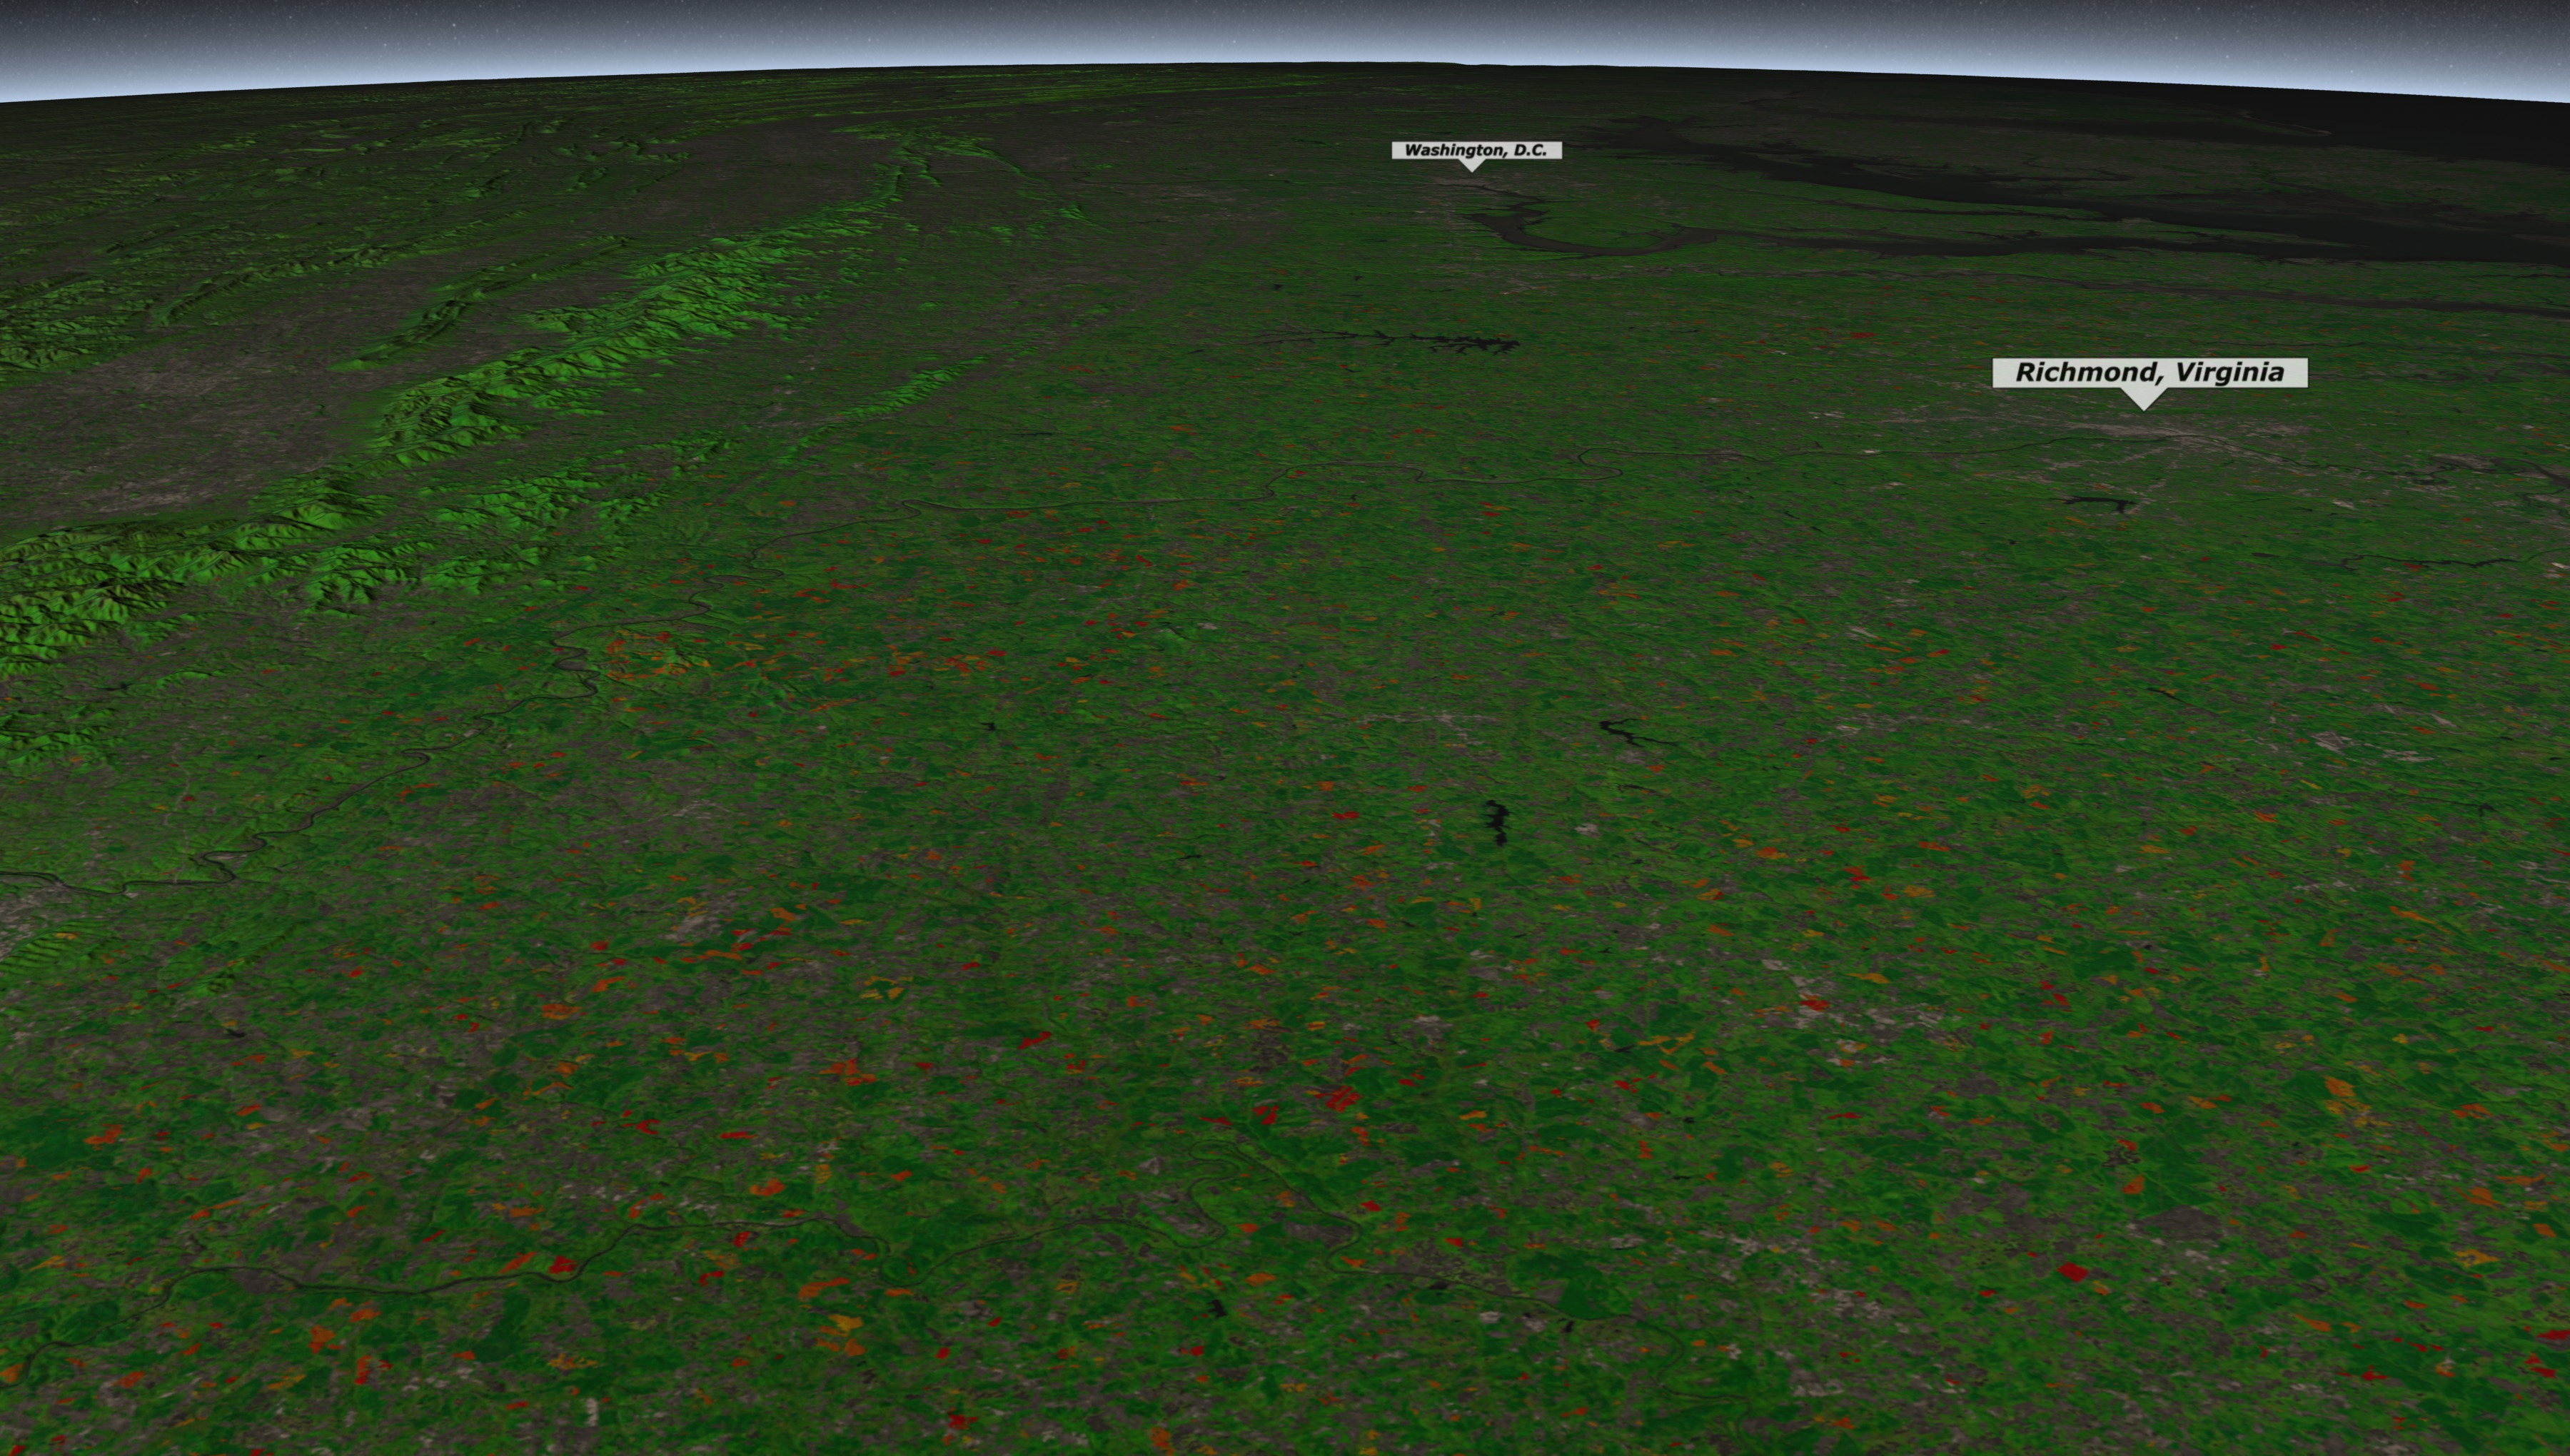
Mountain Top Removal and Deforestation Throughout the Eastern Seaboard from 2006-2010
Visualization Credits
Alex Kekesi (Global Science and Technology, Inc.): Lead Animator
Greg Shirah (NASA/GSFC): Animator
Matthew R. Radcliff (USRA): Producer
Alison Schuyler Ogden (NASA/GSFC): Producer
Matt C. Hansen (University of Maryland): Scientist
Laurence Schuler (ADNET Systems, Inc.): Project Support
Ian Jones (ADNET Systems, Inc.): Project Support
Greg Shirah (NASA/GSFC): Animator
Matthew R. Radcliff (USRA): Producer
Alison Schuyler Ogden (NASA/GSFC): Producer
Matt C. Hansen (University of Maryland): Scientist
Laurence Schuler (ADNET Systems, Inc.): Project Support
Ian Jones (ADNET Systems, Inc.): Project Support
Please give credit for this item to:
NASA/Goddard Space Flight Center Scientific Visualization Studio
NASA/Goddard Space Flight Center Scientific Visualization Studio
Short URL to share this page:
https://svs.gsfc.nasa.gov/3953
Mission:
Landsat
Data Used:
Note: While we identify the data sets used in these visualizations, we do not store any further details nor the data sets themselves on our site.
This item is part of this series:
LDCM
Keywords:
SVS >> HDTV
GCMD >> Earth Science >> Human Dimensions >> Habitat Conversion/Fragmentation >> Deforestation
NASA Science >> Earth
GCMD keywords can be found on the Internet with the following citation: Olsen, L.M., G. Major, K. Shein, J. Scialdone, S. Ritz, T. Stevens, M. Morahan, A. Aleman, R. Vogel, S. Leicester, H. Weir, M. Meaux, S. Grebas, C.Solomon, M. Holland, T. Northcutt, R. A. Restrepo, R. Bilodeau, 2013. NASA/Global Change Master Directory (GCMD) Earth Science Keywords. Version 8.0.0.0.0
https://svs.gsfc.nasa.gov/3953
Mission:
Landsat
Data Used:
Landsat-7/ETM+/Band Combination 5, 4, 3
2006-2010This item is part of this series:
LDCM
Keywords:
SVS >> HDTV
GCMD >> Earth Science >> Human Dimensions >> Habitat Conversion/Fragmentation >> Deforestation
NASA Science >> Earth
GCMD keywords can be found on the Internet with the following citation: Olsen, L.M., G. Major, K. Shein, J. Scialdone, S. Ritz, T. Stevens, M. Morahan, A. Aleman, R. Vogel, S. Leicester, H. Weir, M. Meaux, S. Grebas, C.Solomon, M. Holland, T. Northcutt, R. A. Restrepo, R. Bilodeau, 2013. NASA/Global Change Master Directory (GCMD) Earth Science Keywords. Version 8.0.0.0.0


