Earth
ID: 30786
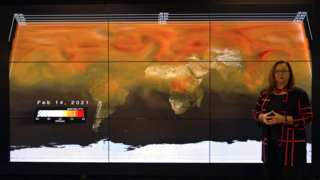
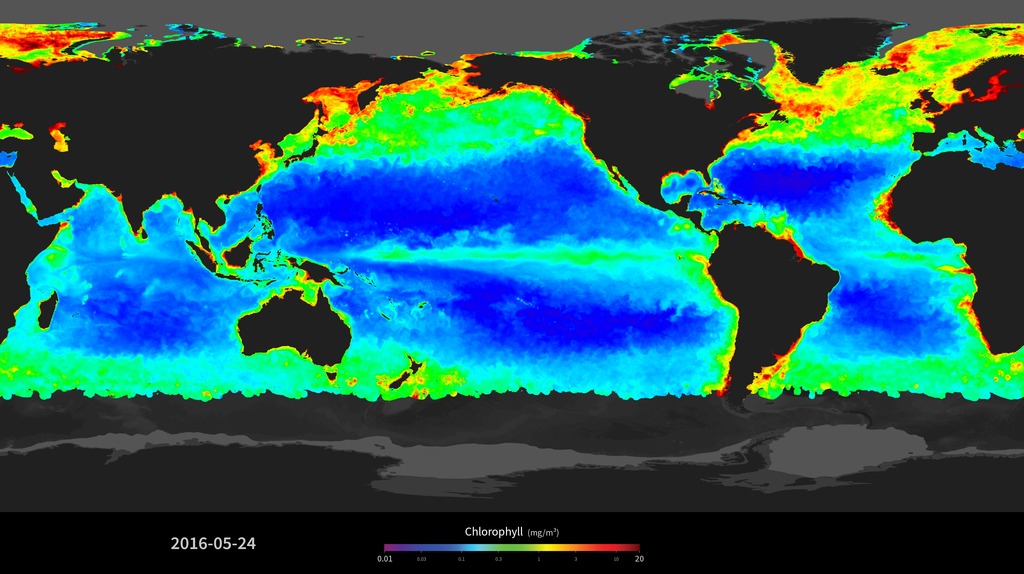
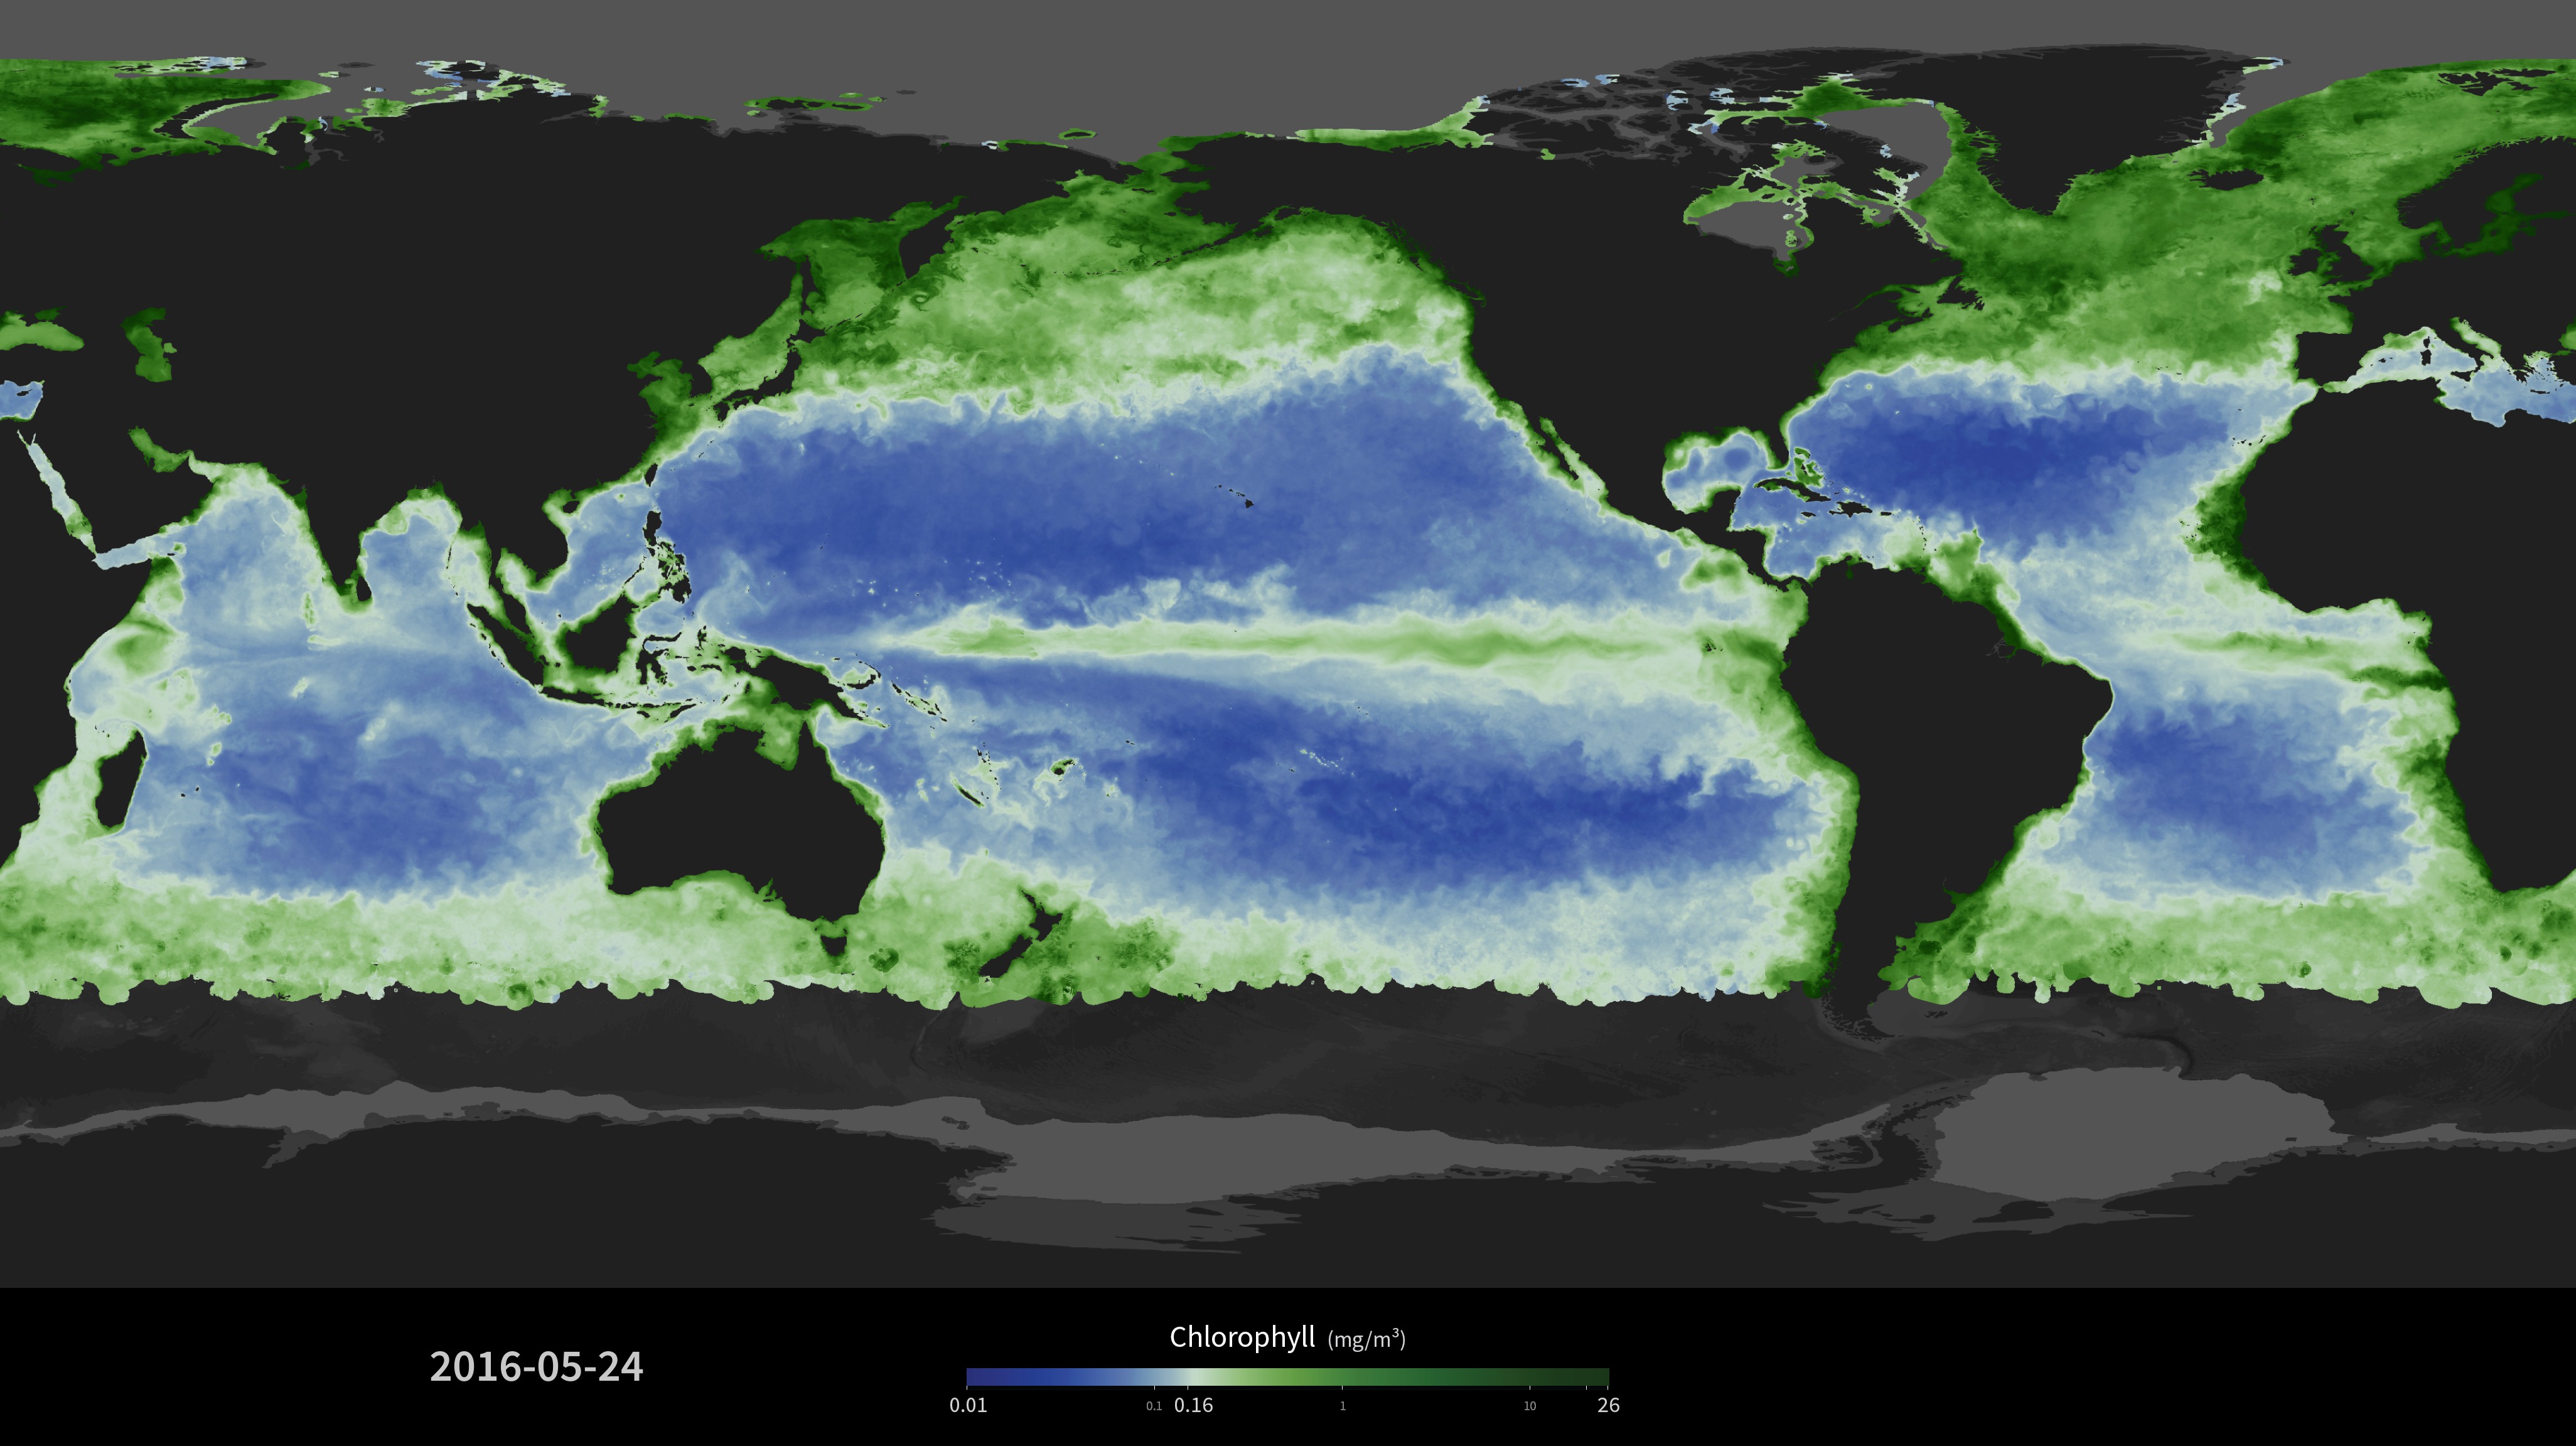
This visualization, derived using data from the Moderate Resolution Imaging Spectroradiometer (MODIS) instrument, shows a daily running weighted 31 day average of sea surface chlorophyll from January 2010 through May 2016. The MODIS data have also been smoothed with a spatial filter to fill in areas of missing data caused by clouds.
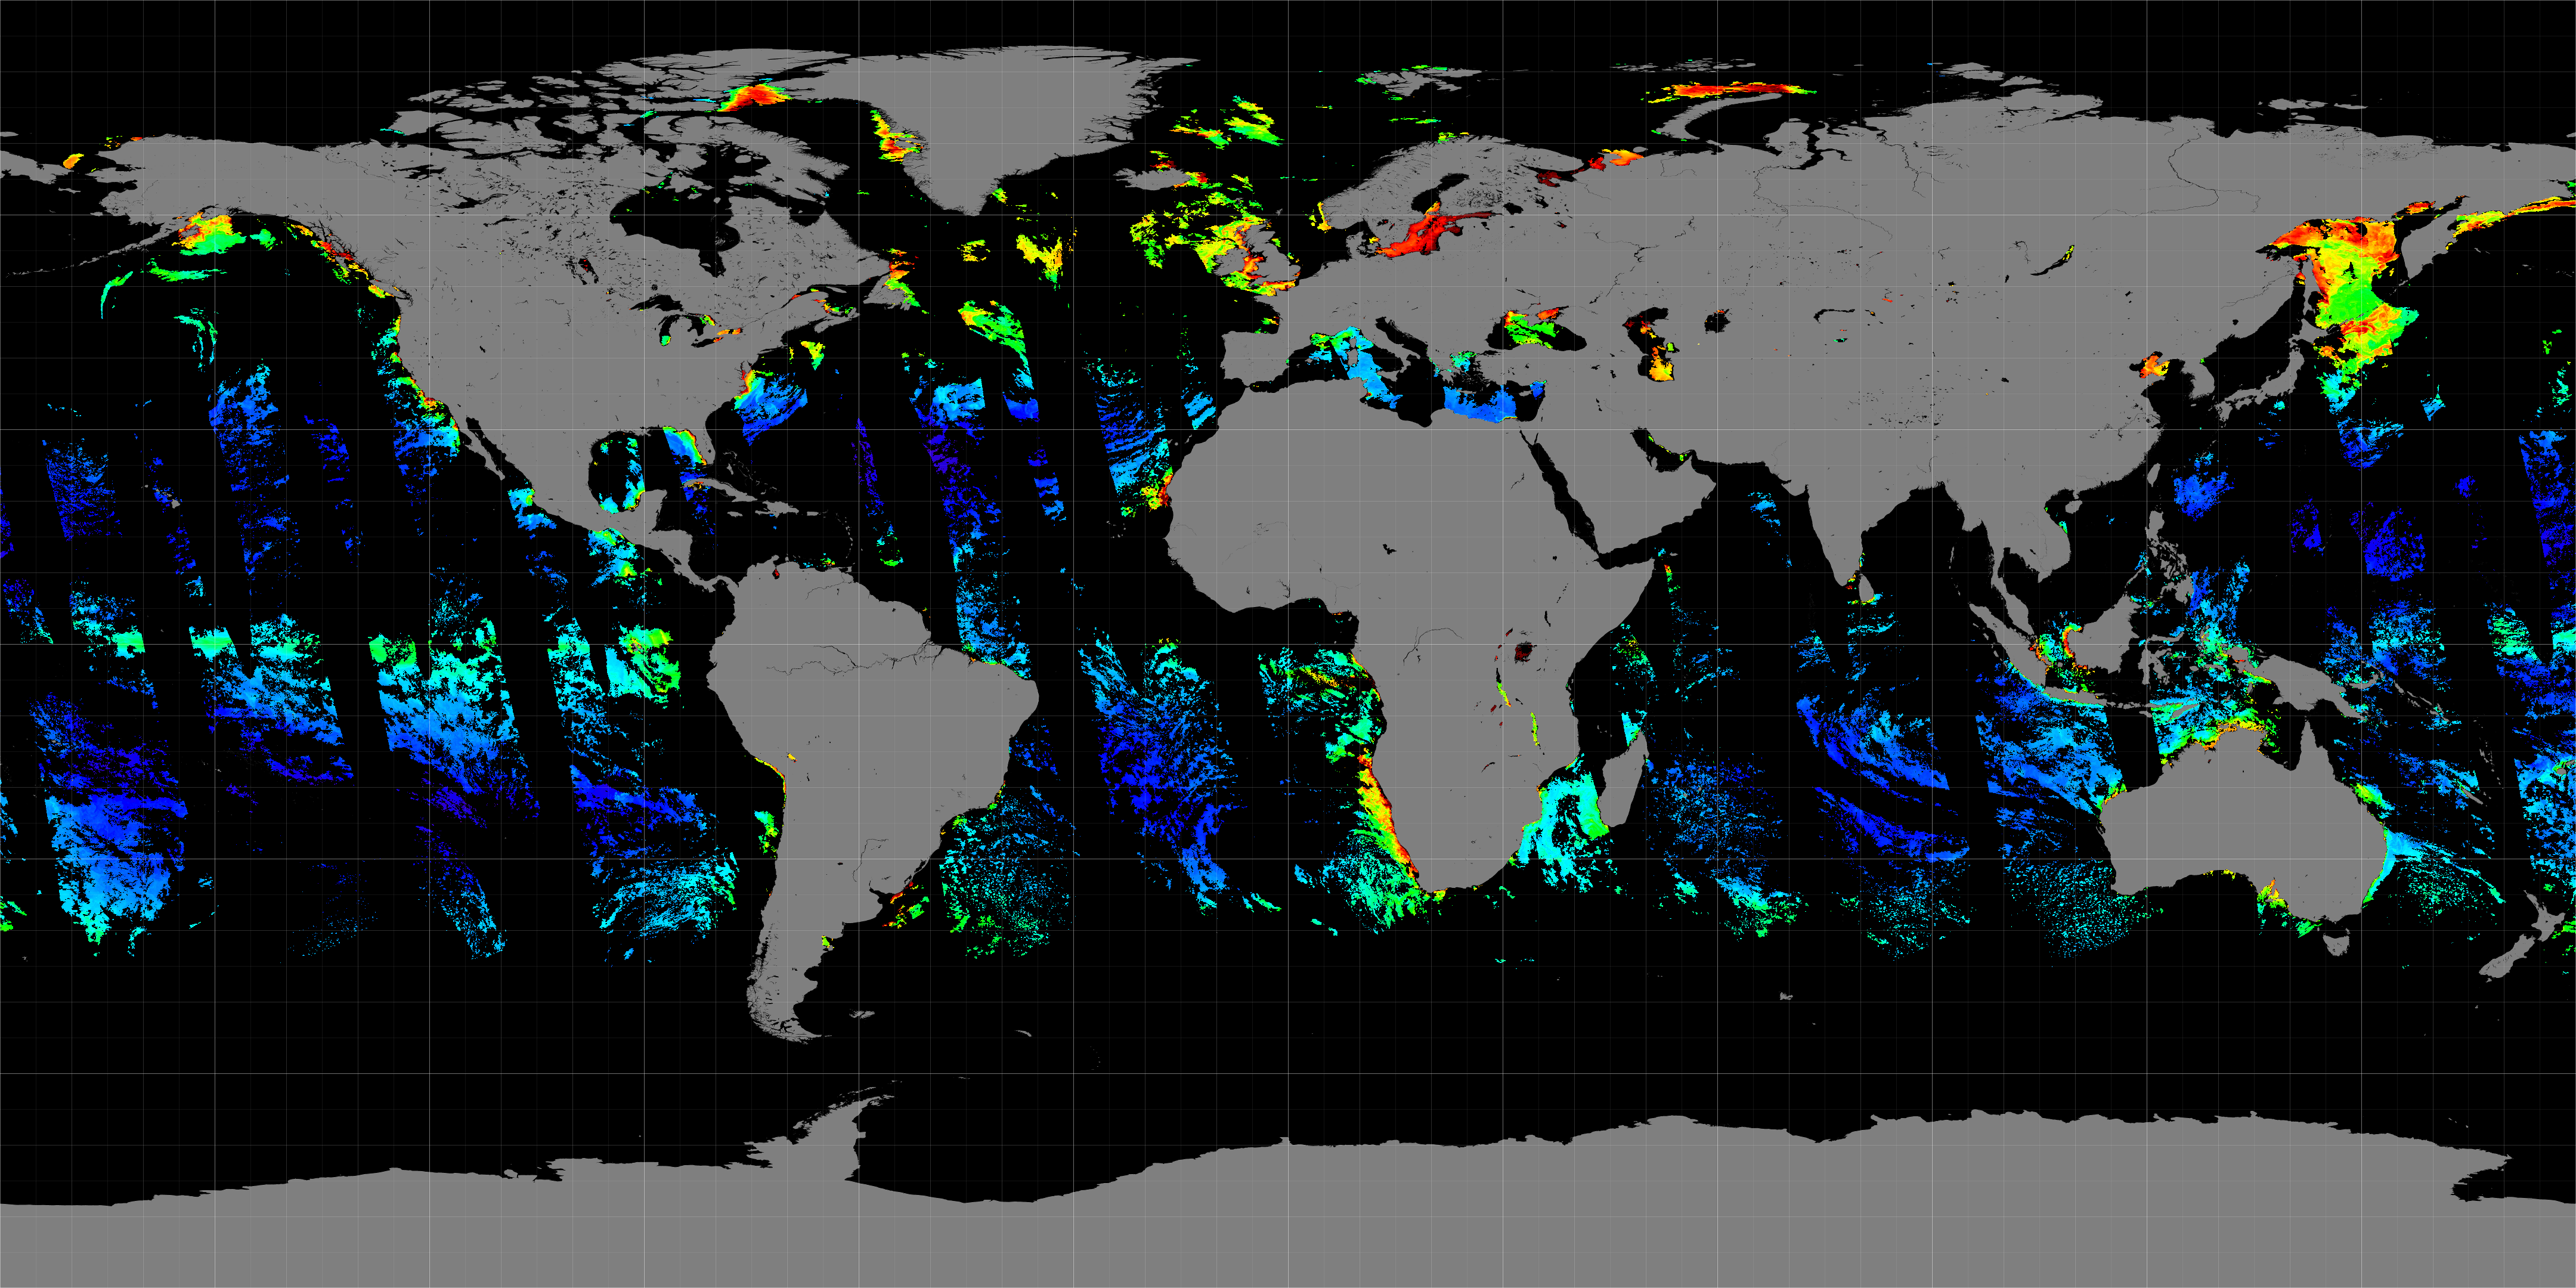
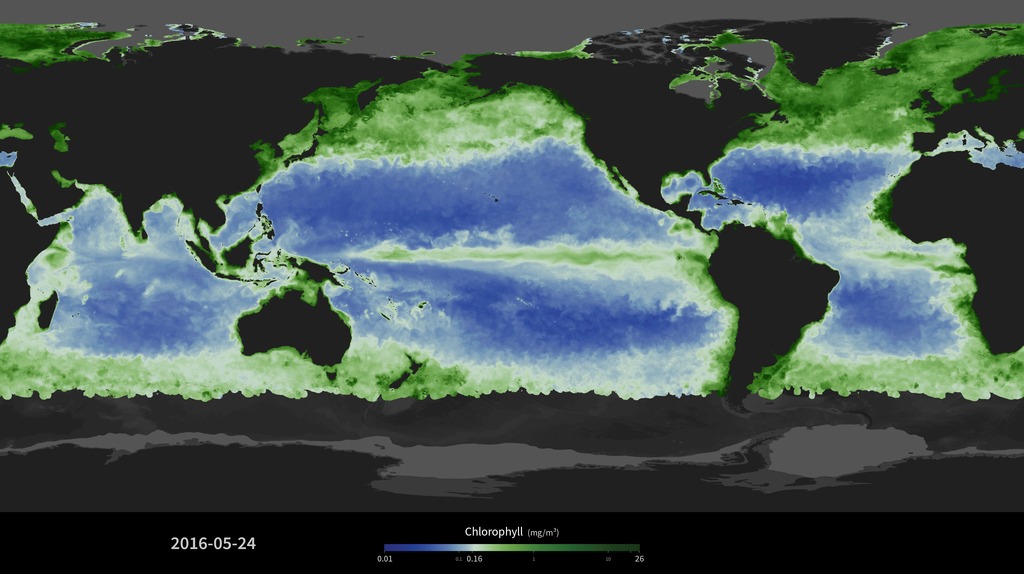
The second image below shows a typical day's worth of data from one MODIS instrument. In addition to gaps caused by the instrument's scan width, there are many areas where clouds obstruct its view of the ocean. To make a movie of ocean color that plays more smoothly, the missing values are filled in with averages from pixels nearby in space or time. For this visualization, data from up to +-15 days and up to 2 degrees away spatially were used to fill in missing values. Pixels closer in time or space are given more weight in the average to prevent the result from appearing too smoothed. Even with this relatively large amount of data filling, there are still areas with missing data - for example over the Arabian Sea during the summer monsoon.
The source data for this visualization are the daily MODIS Chlorophyll concentration files available at oceancolor.gsfc.nasa.gov.

MODIS Ocean Bioproductivity
The second image below shows a typical day's worth of data from one MODIS instrument. In addition to gaps caused by the instrument's scan width, there are many areas where clouds obstruct its view of the ocean. To make a movie of ocean color that plays more smoothly, the missing values are filled in with averages from pixels nearby in space or time. For this visualization, data from up to +-15 days and up to 2 degrees away spatially were used to fill in missing values. Pixels closer in time or space are given more weight in the average to prevent the result from appearing too smoothed. Even with this relatively large amount of data filling, there are still areas with missing data - for example over the Arabian Sea during the summer monsoon.
The source data for this visualization are the daily MODIS Chlorophyll concentration files available at oceancolor.gsfc.nasa.gov.
For More Information
Credits
Marit Jentoft-Nilsen: Lead Visualizer
Please give credit for this item to:
NASA's Goddard Space Flight Center
NASA's Goddard Space Flight Center
Short URL to share this page:
https://svs.gsfc.nasa.gov/30786
Data Used:
Note: While we identify the data sets used in these visualizations, we do not store any further details nor the data sets themselves on our site.
Keywords:
SVS >> HDTV
SVS >> Phytoplankton
GCMD >> Earth Science >> Biosphere >> Vegetation >> Chlorophyll
GCMD >> Earth Science >> Oceans >> Ocean Optics >> Ocean Color
SVS >> Hyperwall
SVS >> Ocean Chlorophyll
SVS >> MODIS
NASA Science >> Earth
GCMD keywords can be found on the Internet with the following citation: Olsen, L.M., G. Major, K. Shein, J. Scialdone, S. Ritz, T. Stevens, M. Morahan, A. Aleman, R. Vogel, S. Leicester, H. Weir, M. Meaux, S. Grebas, C.Solomon, M. Holland, T. Northcutt, R. A. Restrepo, R. Bilodeau, 2013. NASA/Global Change Master Directory (GCMD) Earth Science Keywords. Version 8.0.0.0.0
https://svs.gsfc.nasa.gov/30786
Data Used:
Aqua/MODIS/Chlorophyll Concentration OCl also referred to as: chlor_a
Credit:
Ocean Biology Processing Group (OBPG)
Ocean Biology Processing Group (OBPG)
Terra/MODIS/chlorophyll concentration also referred to as: chlor_a
Keywords:
SVS >> HDTV
SVS >> Phytoplankton
GCMD >> Earth Science >> Biosphere >> Vegetation >> Chlorophyll
GCMD >> Earth Science >> Oceans >> Ocean Optics >> Ocean Color
SVS >> Hyperwall
SVS >> Ocean Chlorophyll
SVS >> MODIS
NASA Science >> Earth
GCMD keywords can be found on the Internet with the following citation: Olsen, L.M., G. Major, K. Shein, J. Scialdone, S. Ritz, T. Stevens, M. Morahan, A. Aleman, R. Vogel, S. Leicester, H. Weir, M. Meaux, S. Grebas, C.Solomon, M. Holland, T. Northcutt, R. A. Restrepo, R. Bilodeau, 2013. NASA/Global Change Master Directory (GCMD) Earth Science Keywords. Version 8.0.0.0.0

