Earth
ID: 3063
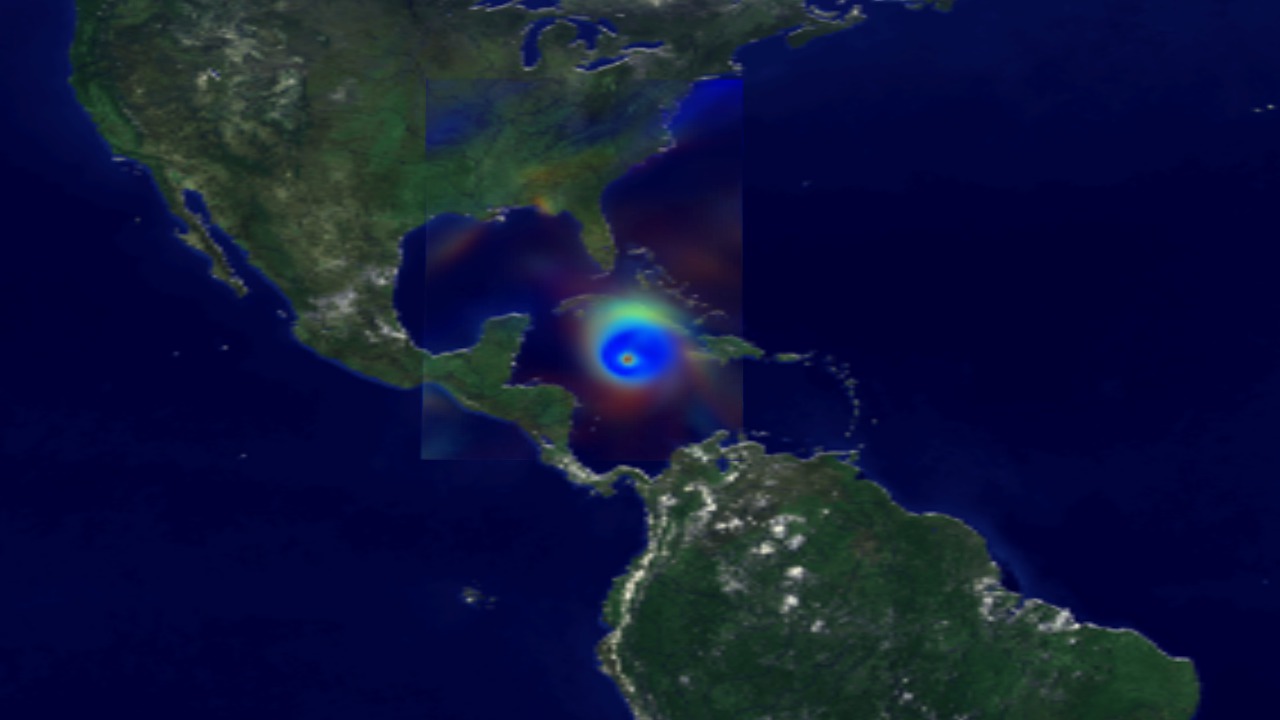
This animation illustrates the output of NASA's finite-volume General Circulation Model (fvGCM) during the five day period just prior to the landfall of hurricane Ivan.
fvGCM Climate Model of Hurricane Ivan (hourly/closeup view)
The data used for this animation was computed for each hour. The visible structure of the hurricane is defined by areas of high wind. The color represents the amount of total precipitable water (blue is low, red is high).
Visualization Credits
Greg Shirah (NASA/GSFC): Lead Animator
James W. Williams (GST): Animator
William Putman (NASA/GSFC): Scientist
James W. Williams (GST): Animator
William Putman (NASA/GSFC): Scientist
Please give credit for this item to:
NASA/Goddard Space Flight Center Scientific Visualization Studio
NASA/Goddard Space Flight Center Scientific Visualization Studio
Short URL to share this page:
https://svs.gsfc.nasa.gov/3063
Data Used:
Note: While we identify the data sets used in these visualizations, we do not store any further details nor the data sets themselves on our site.
This item is part of this series:
fvGCM
Keywords:
SVS >> HDTV
GCMD >> Earth Science >> Atmosphere >> Atmospheric Phenomena >> Hurricanes
SVS >> Hurricane Ivan
SVS >> Global Climate Models
NASA Science >> Earth
GCMD keywords can be found on the Internet with the following citation: Olsen, L.M., G. Major, K. Shein, J. Scialdone, S. Ritz, T. Stevens, M. Morahan, A. Aleman, R. Vogel, S. Leicester, H. Weir, M. Meaux, S. Grebas, C.Solomon, M. Holland, T. Northcutt, R. A. Restrepo, R. Bilodeau, 2013. NASA/Global Change Master Directory (GCMD) Earth Science Keywords. Version 8.0.0.0.0
https://svs.gsfc.nasa.gov/3063
Data Used:
Airborne Topographic Mapper
fvGCM
Model - NASA - 2004/09/11-2004/09/16This item is part of this series:
fvGCM
Keywords:
SVS >> HDTV
GCMD >> Earth Science >> Atmosphere >> Atmospheric Phenomena >> Hurricanes
SVS >> Hurricane Ivan
SVS >> Global Climate Models
NASA Science >> Earth
GCMD keywords can be found on the Internet with the following citation: Olsen, L.M., G. Major, K. Shein, J. Scialdone, S. Ritz, T. Stevens, M. Morahan, A. Aleman, R. Vogel, S. Leicester, H. Weir, M. Meaux, S. Grebas, C.Solomon, M. Holland, T. Northcutt, R. A. Restrepo, R. Bilodeau, 2013. NASA/Global Change Master Directory (GCMD) Earth Science Keywords. Version 8.0.0.0.0


