Earth
ID: 30369
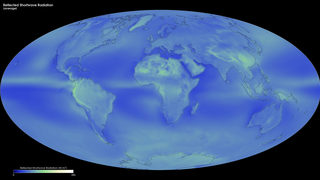
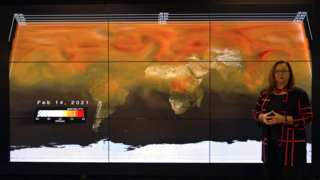
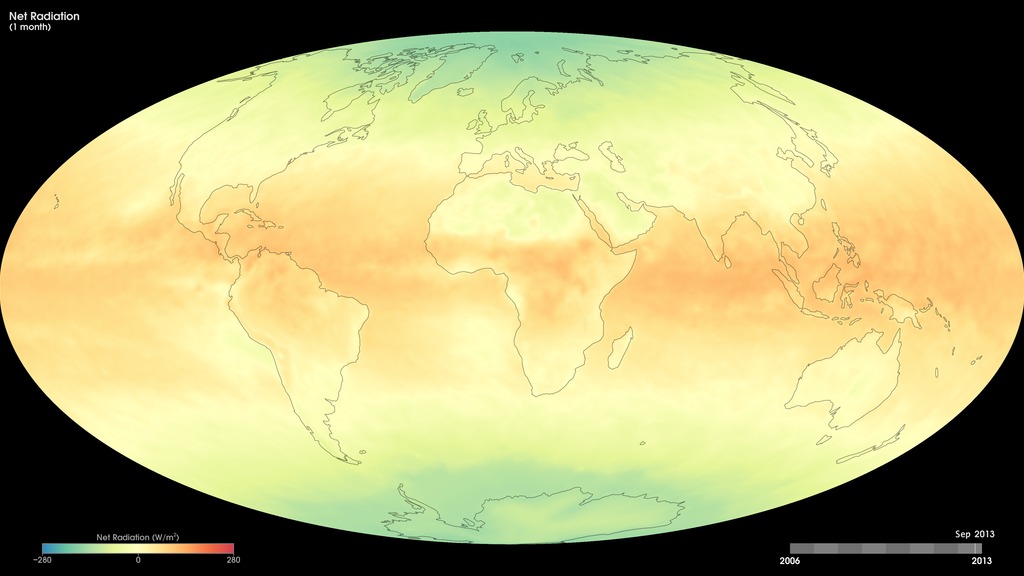
The difference between how much solar energy enters the Earth system and how much heat energy escapes into space is called net radiation. Some places absorb more energy than they give off back to space, so they have an energy surplus. Other places lose more energy to space than they absorb, so they have an energy deficit. These maps show monthly net radiation from July 2006 to the present, from the Fast Longwave And Shortwave Radiative Fluxes, or FLASHFlux, Time Interpolation and Spatial Averaging (TISA) data product. The product contains daily observations collected by the Clouds and the Earth's Radiant Energy System (CERES) sensors on NASA's Aqua and Terra satellites. The colors show the net radiation (in Watts per square meter) that was contained in the Earth system. The maps illustrate the fundamental imbalance between net radiation surpluses at the equator (red areas), where sunlight is direct year-round, and net radiation deficits at high latitudes (blue areas), where direct sunlight is seasonal.
Monthly Net Radiation
There is a newer version of this story located here: https://svs.gsfc.nasa.gov/30604
Newer Version
For More Information
Credits
Based on imagery by Jesse Allen, NASA Earth Observatory, based on FLASHFlux data. FLASHFlux data are produced using CERES observations convolved with MODIS measurements from both the Terra and Aqua satellite. Data provided by the FLASHFlux team, NASA Langley Research Center.
Short URL to share this page:
https://svs.gsfc.nasa.gov/30369
Missions:
Aqua
Terra
Data Used:
Note: While we identify the data sets used in these visualizations, we do not store any further details nor the data sets themselves on our site.
This item is part of this series:
NASA Earth Observations
Keywords:
SVS >> HDTV
SVS >> Radiation budget
GCMD >> Earth Science >> Atmosphere >> Atmospheric Radiation >> Net Radiation
SVS >> Hyperwall
NASA Science >> Earth
SVS >> Presentation
GCMD keywords can be found on the Internet with the following citation: Olsen, L.M., G. Major, K. Shein, J. Scialdone, S. Ritz, T. Stevens, M. Morahan, A. Aleman, R. Vogel, S. Leicester, H. Weir, M. Meaux, S. Grebas, C.Solomon, M. Holland, T. Northcutt, R. A. Restrepo, R. Bilodeau, 2013. NASA/Global Change Master Directory (GCMD) Earth Science Keywords. Version 8.0.0.0.0
https://svs.gsfc.nasa.gov/30369
Missions:
Aqua
Terra
Data Used:
Terra/CERES
The CERES instrument aboard many Earth-orbiting satellites records the flow of reflected Solar radiation and reprocessed longwave radiation in the Earth's radiation budget.
Aqua/CERES/Net Radiant Flux
This item is part of this series:
NASA Earth Observations
Keywords:
SVS >> HDTV
SVS >> Radiation budget
GCMD >> Earth Science >> Atmosphere >> Atmospheric Radiation >> Net Radiation
SVS >> Hyperwall
NASA Science >> Earth
SVS >> Presentation
GCMD keywords can be found on the Internet with the following citation: Olsen, L.M., G. Major, K. Shein, J. Scialdone, S. Ritz, T. Stevens, M. Morahan, A. Aleman, R. Vogel, S. Leicester, H. Weir, M. Meaux, S. Grebas, C.Solomon, M. Holland, T. Northcutt, R. A. Restrepo, R. Bilodeau, 2013. NASA/Global Change Master Directory (GCMD) Earth Science Keywords. Version 8.0.0.0.0


