TOMS Links
Overview
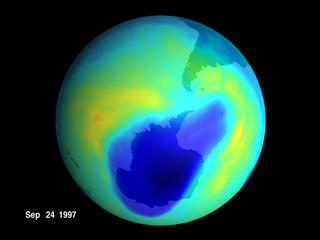
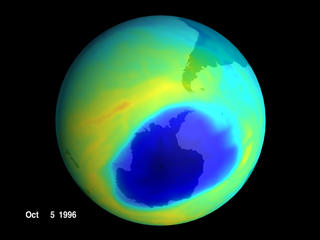
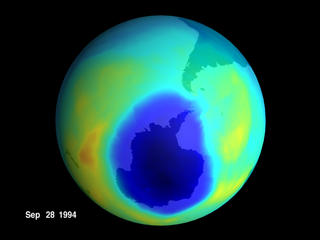
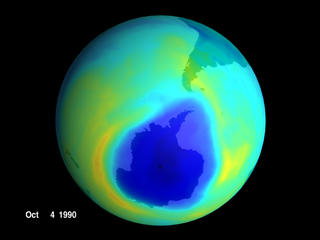
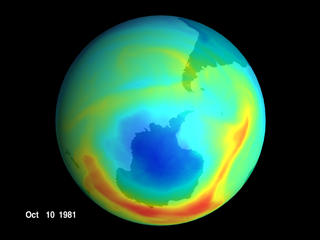
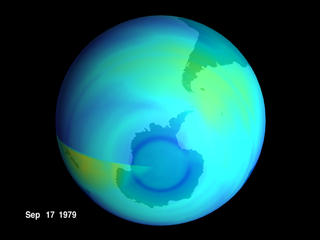
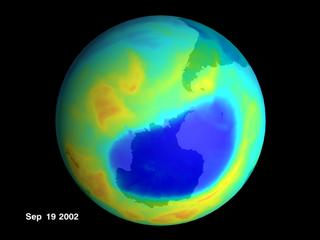
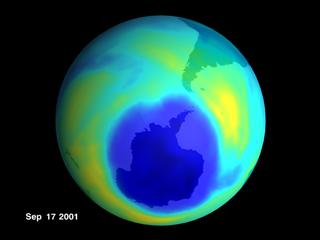
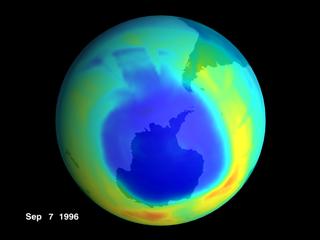
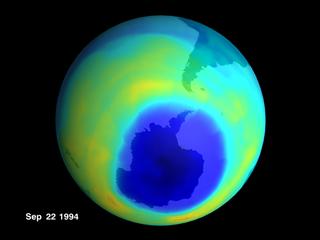
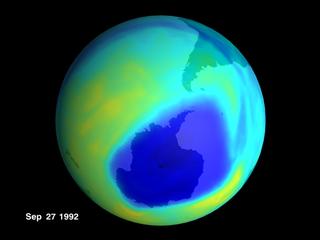
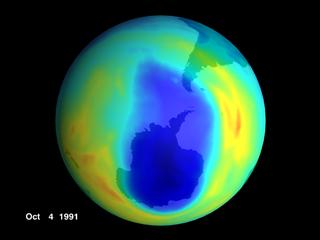
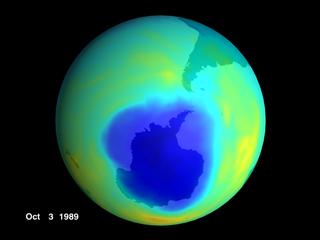
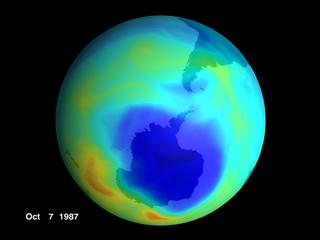
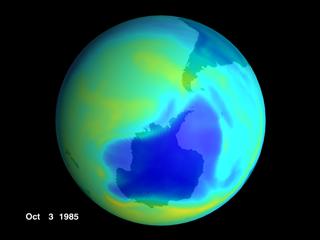
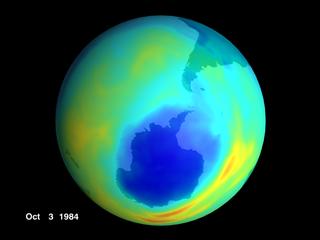
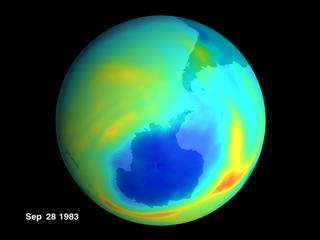
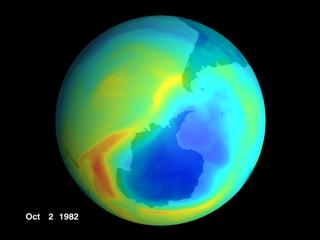
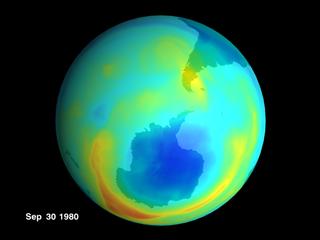
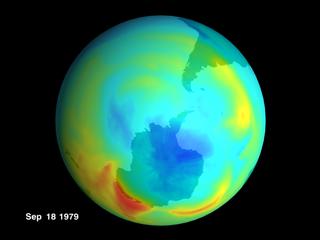
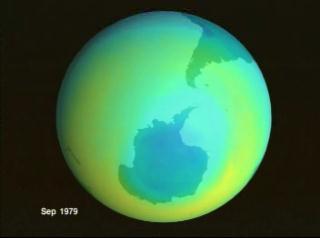
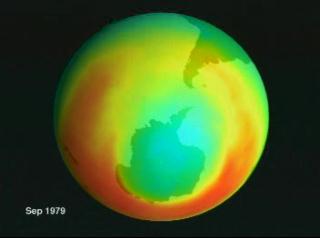
The Total Ozone Mapping Spectrometer, launched in July 1996 onboard an Earth Probe Satellite (TOMS/EP), continues NASA's long-term daily mapping of the global distribution of the Earth's atmospheric ozone. TOMS/EP will again take high-resolution measurements of the total column amount of ozone from space that began with NASA's Nimbus-7 satellite in 1978 and continued with the TOMS aboard a Russian Meteor-3 satellite until the instrument stopped working in December 1994. This NASA-developed instrument, measures ozone indirectly by mapping ultraviolet light emitted by the Sun to that scattered from the Earth's atmosphere back to the satellite. The TOMS instrument has mapped in detail the global ozone distribution as well as the Antarctic "ozone hole," which forms September through November of each year.
This is a list of visualizations relating to TOMS.
For more information on TOMS, please visit https://science.nasa.gov/missions/toms.
General Ozone Visualizations
- ID: 834 Visualization
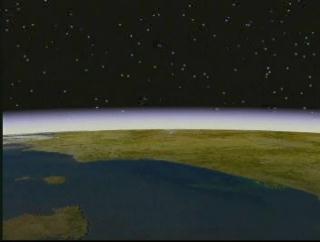
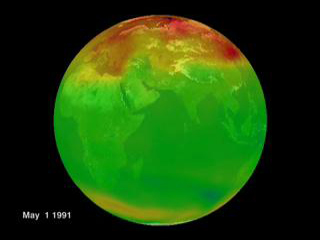
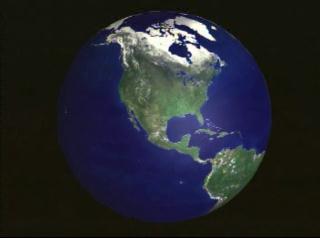
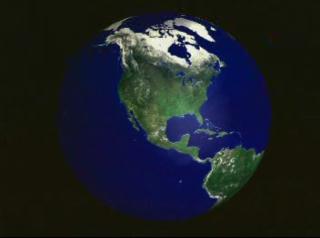
Ozone Layer Shielding Our Planet
Go to this pageAn animation showing the ozone layer shielding our planet from the sun's intense ultraviolet radiation. Ozone absorbs nearly all of the biologically damaging UV radiation from the sun. ||
- ID: 828 Visualization
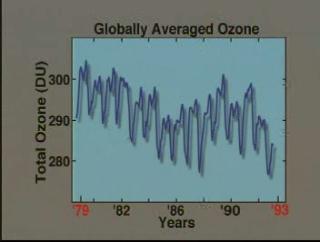
Graph Showing Ozone Decreasing by 5% from 1979 to 1993
Go to this pageFrom 1979 to 1993, the average amount of ozone in the stratosphere has decreased by about 5%. || Graph of total ozone in the stratosphere from 1979 to 1993 || a000828.00010_print.png (720x480) [447.7 KB] || a000828_thm.png (80x40) [4.3 KB] || a000828_pre.jpg (320x242) [8.9 KB] || a000828_pre_searchweb.jpg (320x180) [49.9 KB] || a000828.webmhd.webm (960x540) [3.5 MB] || a000828.mp4 (640x480) [1.9 MB] || a000828.dv (720x480) [57.9 MB] || a000828.mpg (352x240) [2.0 MB] ||
Global
- ID: 2904
 Visualization
 - ID: 2903
 Visualization
 - ID: 2256

- ID: 2223

- ID: 2220
- ID: 2183
 Visualization
 - ID: 378
- ID: 38
 Visualization
 - ID: 37
 Visualization
 - ID: 36
 Visualization
 - ID: 14
 Visualization
Arctic
- ID: 2810 Visualization

Arctic Ozone from February 1, 2003 through March 30, 2003
Go to this pageThis visualization shows the northern hemisphere ozone hole from February 1, 2003, through March 30, 2003. || a002810.00065_print.png (720x480) [542.9 KB] || ozone_arctic2003_640x480_pre.jpg (320x240) [7.8 KB] || ozone_arctic2003_320x240_thm.png (80x40) [3.5 KB] || ozone_arctic2003_640x480_pre_searchweb.jpg (320x180) [56.0 KB] || ozone_arctic2003_NTSC.webmhd.webm (960x540) [471.6 KB] || 720x486_4x3_29.97p (720x486) [8.0 KB] || ozone_arctic2003_640x480.mpg (640x480) [1.1 MB] || ozone_arctic2003_NTSC.m2v (720x480) [1.7 MB] || a002810.dv (720x480) [13.7 MB] || a002810_ozone_arctic2003_NTSC.mp4 (640x480) [349.0 KB] || ozone_arctic2003_320x240.mpg (320x240) [286.8 KB] ||
- ID: 2284 Visualization
Total Ozone from Earth Probe TOMS: 7/26/1996-11/4/2001
Go to this pageThis animation shows the total ozone as measured by Earth Probe TOMS since the earliest measurements by that instrument. Days for which the instrument collected little or no data are skipped. ||
- ID: 2166 Visualization
EP TOMS Ozone (7/26/96 - 12/4/00)
Go to this pageThis animation shows the total ozone as measured by Earth Probe TOMS since the earliest measurements by that instrument.Days on which no data was taken appear as blank. ||
- ID: 2165 Visualization
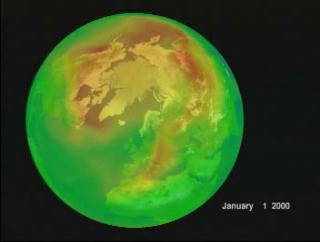
EP TOMS Ozone: Northern Hemisphere (1/1/00 - 12/31/00)
Go to this pageThis animation was created for an exhibit at the National Space Centre in Leicester, England. ||
- ID: 1087 Visualization
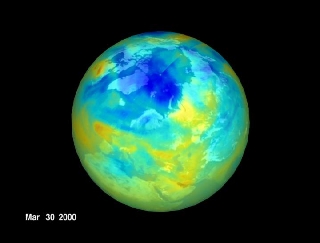
TOMS Ozone in the Northern Hemisphere: Feb 1, 2000-March 30, 2000
Go to this pageDuring the winter of 2000, Arctic ozone levels reached their lowest point in eight years at an altitude of nearly 60,000 feet. Concentrations dropped more than 50 percent from average. ||
- ID: 719 Visualization
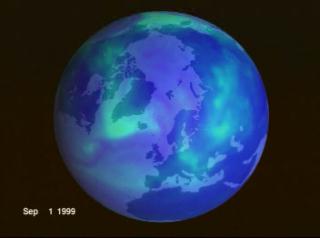
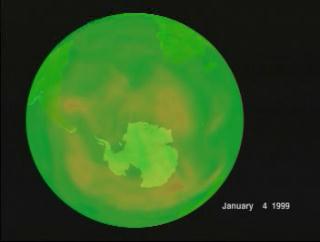
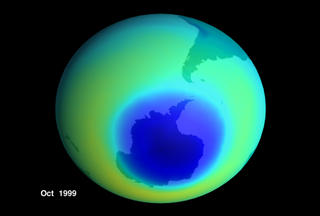
Arctic Ozone from TOMS: September 1, 1999 through November 30, 1999
Go to this pageTotal ozone over the arctic for September 1, 1999 through November 30, 1999, as measured by Earth Probe TOMS || a000719.00005_print.png (720x480) [472.1 KB] || a000719_thm.png (80x40) [4.0 KB] || a000719_pre.jpg (320x238) [7.0 KB] || a000719_pre_searchweb.jpg (320x180) [54.2 KB] || a000719.webmhd.webm (960x540) [2.3 MB] || a000719.dv (720x480) [148.4 MB] || a000719.mp4 (640x480) [8.0 MB] || a000719.mpg (352x240) [4.3 MB] ||
- ID: 712 Visualization
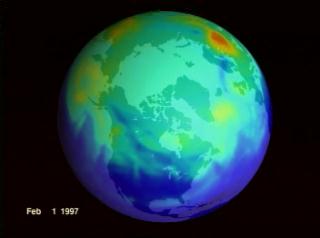
Arctic Ozone Hole from Earth Probe TOMS: February 1, 1997 through May 31, 1997
Go to this pageOzone measurements from Earth Probe TOMS for February 1, 1997 through May 31, 1997 showing the formation of an Arctic ozone hole || a000712.00005_print.png (720x480) [363.4 KB] || a000712_thm.png (80x40) [3.9 KB] || a000712_pre.jpg (320x238) [7.1 KB] || a000712_pre_searchweb.jpg (320x180) [54.9 KB] || a000712.webmhd.webm (960x540) [2.3 MB] || a000712.dv (720x480) [67.4 MB] || a000712.mp4 (640x480) [3.8 MB] || a000712.mpg (352x240) [2.3 MB] ||
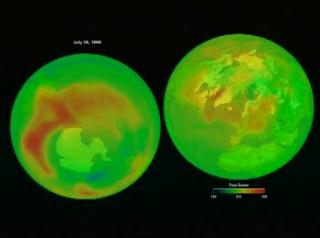
- ID: 711 Visualization
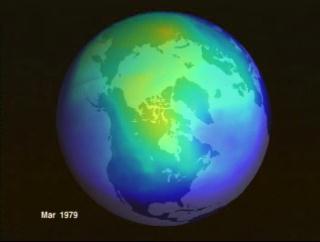
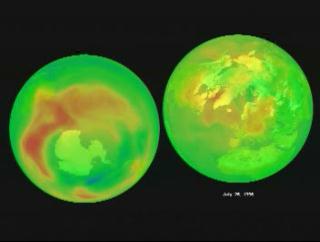
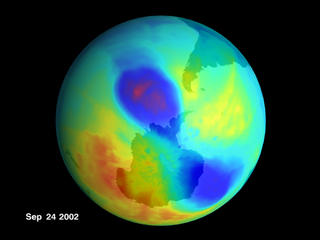
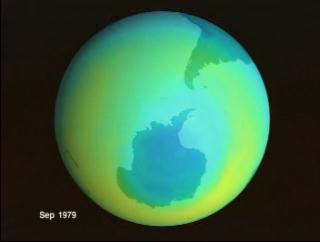
Average March Ozone Levels over the Arctic for 1979 to 1999
Go to this pageThe evolution of ozone over the Arctic as shown through measurements of average ozone for March for the years 1979 through 1999, excluding 1995 and 1996. These measurements were made by the TOMS instruments on Nimbus-7, Meteor-3 and Earth Probe. Dark blue represent regions of low ozone and red represents regions of high ozone. || a000711.00005_print.png (720x480) [493.8 KB] || a000711_thm.png (80x40) [4.2 KB] || a000711_pre.jpg (320x242) [7.0 KB] || a000711_pre_searchweb.jpg (320x180) [54.4 KB] || a000711.webmhd.webm (960x540) [1.2 MB] || a000711.dv (720x480) [67.5 MB] || a000711.mp4 (640x480) [3.7 MB] || a000711.mpg (352x240) [1.9 MB] ||
Antarctic
- ID: 2855
 Visualization
 - ID: 2836
 Visualization
 - ID: 2829
 Visualization
 - ID: 2809
- ID: 2621

- ID: 2620
 Visualization
 - ID: 2619
- ID: 2617
 Visualization
 - ID: 2616
 Visualization
 - ID: 2615
 Visualization
 - ID: 2614
 Visualization
 - ID: 2613
 Visualization
 - ID: 2612
 Visualization
 - ID: 2611
 Visualization
 - ID: 2610
 Visualization
 - ID: 2609
 Visualization
 - ID: 2608
 Visualization
 - ID: 2607
 Visualization
 - ID: 2606
 Visualization
 - ID: 2605
 Visualization
 - ID: 2604
 Visualization
 - ID: 2603
 Visualization
 - ID: 2602
 Visualization
 - ID: 2601
 Visualization
 - ID: 2600
 Visualization
 - ID: 2599
 Visualization
 - ID: 2598
 Visualization
 - ID: 2597

- ID: 2596
 Visualization
 - ID: 2595
 Visualization
 - ID: 2594
 Visualization
 - ID: 2593
 Visualization
 - ID: 2592
 Visualization
 - ID: 2591
 Visualization
 - ID: 2590
 Visualization
 - ID: 2589
 Visualization
 - ID: 2588
 Visualization
 - ID: 2587
 Visualization
 - ID: 2586
 Visualization
 - ID: 2585
 Visualization
 - ID: 2584
 Visualization
 - ID: 2583
 Visualization
 - ID: 2582
 Visualization
 - ID: 2581
 Visualization
 - ID: 2580
 Visualization
 - ID: 2579
 Visualization
 - ID: 2578
 Visualization
 - ID: 2577
 Visualization
 - ID: 2576
 Visualization
 - ID: 2575
 Visualization
 - ID: 2574
 Visualization
 - ID: 2573
- ID: 2284Visualization
- ID: 2275

- ID: 2166Visualization
- ID: 2164
 Visualization
 - ID: 1395
- ID: 1204

- ID: 1203
- ID: 1167
- ID: 835
- ID: 718

- ID: 717
 Visualization
 - ID: 714
- ID: 713
- ID: 710
- ID: 708
 Visualization
 - ID: 236
- ID: 232
Other Locations around the Globe
- ID: 2229
- ID: 2227

- ID: 2225
- ID: 2218

- ID: 2217
- ID: 2201
 Visualization
 - ID: 2199
 Visualization
 - ID: 2197
- ID: 2192
- ID: 2073

- ID: 2072
- ID: 2071
- ID: 2018
 Visualization
 - ID: 2004
 Visualization
 - ID: 380

- ID: 379
Total Ozone Measurements
- ID: 2836Visualization
- ID: 2620Visualization
- ID: 2619
- ID: 2284Visualization
- ID: 1204
- ID: 1203
- ID: 719
- ID: 717Visualization
- ID: 714
- ID: 713
- ID: 708Visualization
- ID: 232
- ID: 38Visualization
- ID: 37Visualization
- ID: 36Visualization
Tropospheric Ozone Measurements
- ID: 2192 Visualization
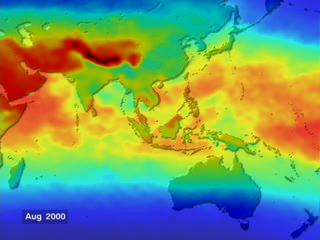
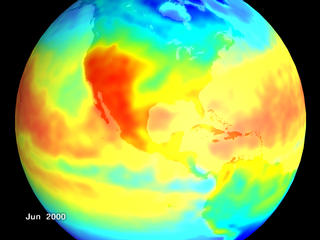
Tropospheric Ozone in Tropical Air Masses from Earth Probe TOMS
Go to this pageThis animation illustrates the movement of tropical air masses bringing tropospheric ozone into the northern temperate latitudes. ||
- ID: 2073 Visualization
Tropospheric Ozone and Smoke from Earth Probe TOMS: Indonesia
Go to this pageResearchers have discovered that smoke and smog move in different ways through the atmosphere. A series of unusual events several years ago created a blanket of pollution over the Indian Ocean.In this animation, significant smog or tropospheric ozone is represented by red and green and regions of significant smoke index are in shades of white and gray. ||
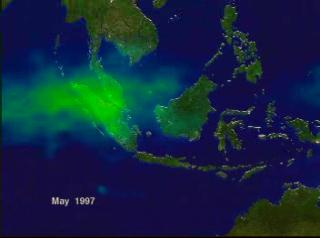
- ID: 2072 Visualization
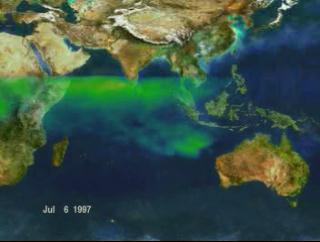
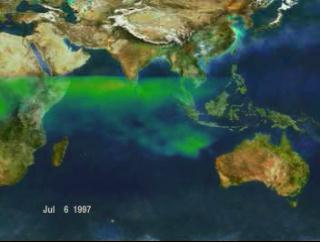
Tropospheric Ozone and Smoke from Earth Probe TOMS: Indian Ocean
Go to this pageResearchers have discovered that smoke and smog move in different ways through the atmosphere. A series of unusual events several years ago created a blanket of pollution over the Indian Ocean.In this animation, significant smog or tropospheric ozone is represented by red and green and regions of significant smoke index are in shades of white and gray. ||
- ID: 2071 Visualization
Tropospheric Ozone and Smoke from Earth Probe TOMS: Indian Ocean to Indonesia Zoom
Go to this pageResearchers have discovered that smoke and smog move in different ways through the atmosphere. A series of unusual events several years ago created a blanket of pollution over the Indian Ocean.In this animation, significant smog or tropospheric ozone is represented by red and green and regions of significant smoke index are in shades of white and gray. ||
- ID: 2018 Visualization
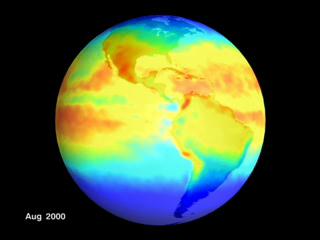
Safari 2000 Tropospheric Ozone
Go to this pageThe fires that raged across southern Africa in August and September of 2000 produced a thick 'river of smoke' that observers compared with the aftermath of the Kuwaiti oil fires in 1991. NASA-supported studies currently underway on the event will contribute to improved air pollution policies in the region and a better understanding of its impact on climate change. ||
- ID: 2004 Visualization
Indonesian Tropospheric Ozone and Aerosol Index
Go to this pageResearchers have discovered that smoke and smog move in different ways through the atmosphere. A series of unusual events several years ago created a blanket of pollution over the Indian Ocean. In this animation, significant smog or tropospheric ozone is represented by red and green and regions of significant smoke index are in shades of white and gray. ||
- ID: 380 Visualization
Tropospheric Ozone from Earth Probe TOMS: Atlantic Ocean - 9 Day Averages (May 1997 - May 1998)
Go to this pageAerosol concentrations over the Atlantic Ocean from May 1997 through May 1998 from Earth Probe TOMS || a000380.00010_print.png (720x480) [503.6 KB] || a000380_thm.png (80x40) [5.7 KB] || a000380_pre.jpg (320x238) [9.9 KB] || a000380_pre_searchweb.jpg (320x180) [72.0 KB] || a000380.webmhd.webm (960x540) [8.9 MB] || a000380.dv (720x480) [121.7 MB] || a000380.mp4 (640x480) [6.7 MB] || a000380.mpg (352x240) [9.6 MB] ||
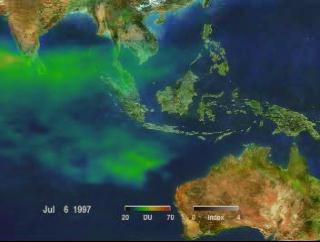
- ID: 379 Visualization
Tropospheric Ozone from Earth Probe TOMS: Indonesia - 9 Day Averages (May 1997 - May 1998)
Go to this pageAerosol concentrations over Indonesia from May 1997 through May 1998 from Earth Probe TOMS || a000379.00010_print.png (720x480) [472.9 KB] || a000379_thm.png (80x40) [5.6 KB] || a000379_pre.jpg (320x238) [8.7 KB] || a000379_pre_searchweb.jpg (320x180) [63.5 KB] || a000379.webmhd.webm (960x540) [7.8 MB] || a000379.dv (720x480) [125.0 MB] || a000379.mp4 (640x480) [6.9 MB] || a000379.mpg (352x240) [9.7 MB] ||
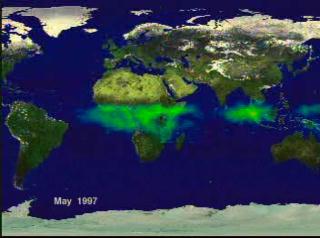
- ID: 378 Visualization
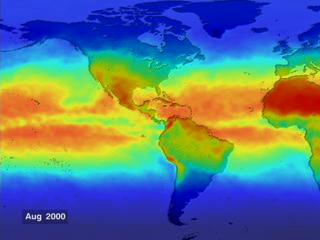
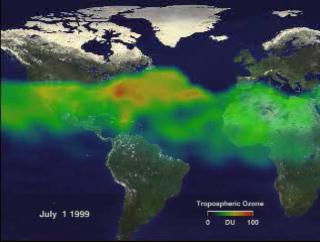
Tropospheric Ozone from Earth Probe TOMS: Global - 9 Day Averages (May 1997 - May 1998)
Go to this pageGlobal aerosol concentrations from May 1997 through May 1998 from Earth Probe TOMS || a000378.00010_print.png (720x480) [558.2 KB] || a000378_thm.png (80x40) [6.3 KB] || a000378_pre.jpg (320x238) [13.7 KB] || a000378_pre_searchweb.jpg (320x180) [80.3 KB] || a000378.webmhd.webm (960x540) [9.2 MB] || a000378.dv (720x480) [125.0 MB] || a000378.mp4 (640x480) [7.1 MB] || a000378.mpg (352x240) [9.8 MB] ||
Stratospheric Ozone Measurements
- ID: 2904Visualization
- ID: 2903Visualization
- ID: 2855Visualization
- ID: 2829Visualization
- ID: 2617Visualization
- ID: 2616Visualization
- ID: 2615Visualization
- ID: 2614Visualization
- ID: 2613Visualization
- ID: 2612Visualization
- ID: 2611Visualization
- ID: 2610Visualization
- ID: 2609Visualization
- ID: 2608Visualization
- ID: 2607Visualization
- ID: 2606Visualization
- ID: 2605Visualization
- ID: 2604Visualization
- ID: 2603Visualization
- ID: 2602Visualization
- ID: 2601Visualization
- ID: 2600Visualization
- ID: 2599Visualization
- ID: 2598Visualization
- ID: 2596Visualization
- ID: 2595Visualization
- ID: 2594Visualization
- ID: 2593Visualization
- ID: 2592Visualization
- ID: 2591Visualization
- ID: 2590Visualization
- ID: 2589Visualization
- ID: 2588Visualization
- ID: 2587Visualization
- ID: 2586Visualization
- ID: 2585Visualization
- ID: 2584Visualization
- ID: 2583Visualization
- ID: 2582Visualization
- ID: 2581Visualization
- ID: 2580Visualization
- ID: 2579Visualization
- ID: 2578Visualization
- ID: 2577Visualization
- ID: 2576Visualization
- ID: 2575Visualization
- ID: 2574Visualization
- ID: 2573
- ID: 2275
Erythemal Index
- ID: 2256
- ID: 2229
- ID: 2227
- ID: 2225
- ID: 2223
- ID: 2220
- ID: 2218
- ID: 2217
- ID: 2201Visualization
- ID: 2199Visualization
- ID: 2197