Sunspots
Overview
Large cooler regions on the solar photosphere where magnetic flux is concentrated.
Visuals
- ID: 4715 Visualization
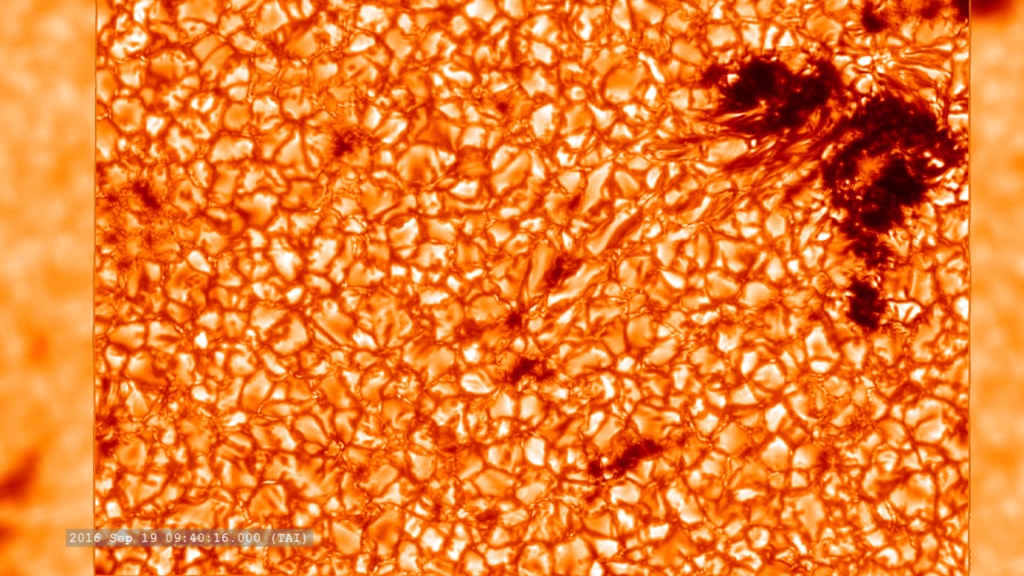
Swedish Solar Telescope: Solar Closeups
Go to this pageClose-up of Active Region 12593 through the 400 nm filter of the Swedish Solar Telescope. SDO/HMI provides the background image. || Sept2016_CHROMIS4000A_stand.HD1080i.00100_print.jpg (1024x576) [200.8 KB] || Sept2016_CHROMIS4000A_stand.HD1080i.00100_searchweb.png (180x320) [136.4 KB] || Sept2016_CHROMIS4000A_stand.HD1080i.00100_thm.png (80x40) [9.1 KB] || SwedishST (1920x1080) [0 Item(s)] || Sept2016_CHROMIS4000A.HD1080i_p30.mp4 (1920x1080) [19.4 MB] || Sept2016_CHROMIS4000A.HD1080i_p30.webm (1920x1080) [1.5 MB] || SwedishST (3840x2160) [0 Item(s)] || Sept2016_CHROMIS4000A.UHD3840_2160p30.mp4 (3840x2160) [50.6 MB] || Sept2016_CHROMIS4000A.HD1080i_p30.mp4.hwshow [199 bytes] ||
- ID: 3411 Visualization
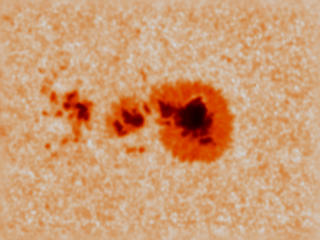
Hinode's High-Resolution View of the Sun
Go to this pageA new sunspot collided with an existing sunspot which built up a highly sheared magnetic configuration. This resulted in a solar flare on December 13, 2006. ||
- ID: 3412 Visualization
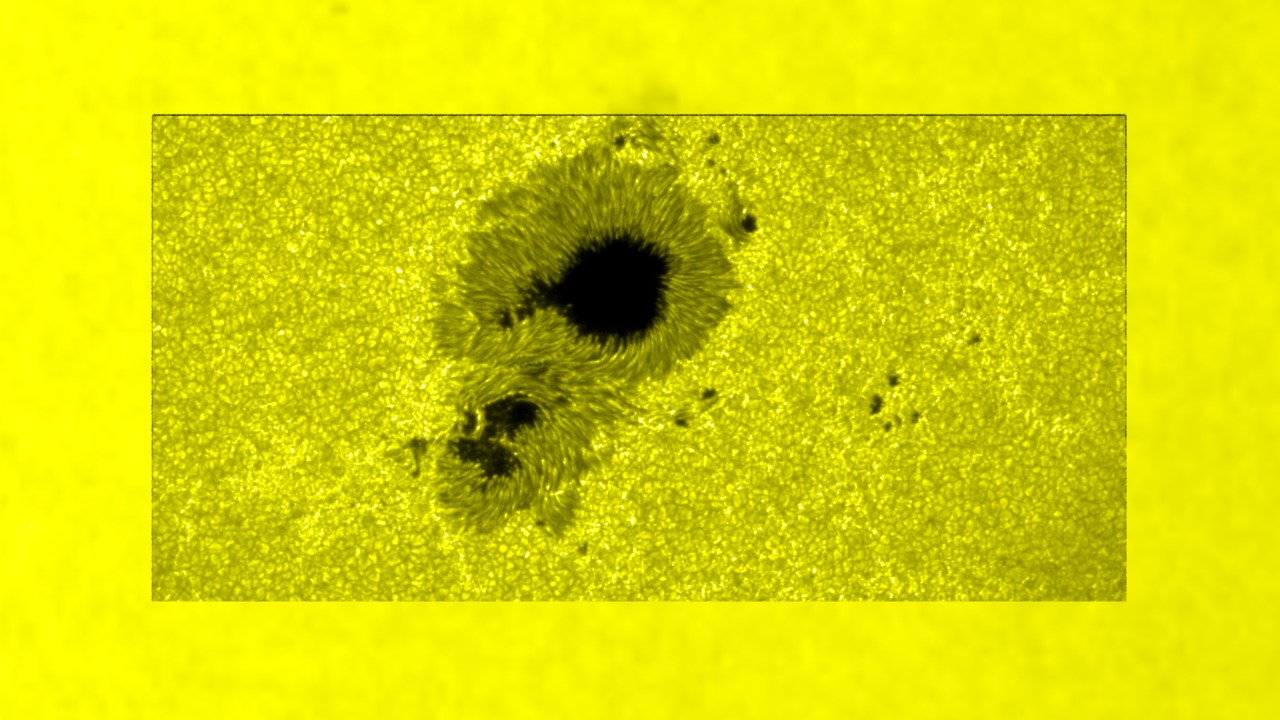
Hinode's High-resolution view of solar granulation
Go to this pageThis zoom-in from a full view of the Hinode Solar Optical Telescope (SOT) (the same as in animation 3411) shows details of solar granulation and how rapidly it changes. ||
- ID: 2287 Visualization
The Spinning Sunspot
Go to this pageZoom-in to the sunspot group and watch it rotate || a002287.00005_print.png (720x480) [413.4 KB] || spinspot2_pre.jpg (320x240) [5.6 KB] || a002287.webmhd.webm (960x540) [4.9 MB] || a002287.dv (720x480) [60.1 MB] || spinspot2.mpg (320x240) [2.4 MB] || Full sun view with SOHO-MDI data || spinningspot0001.jpg (2560x1920) [351.5 KB] || spinningspot0001_web.jpg (320x240) [7.3 KB] || spinningspot0001.tif (2560x1920) [2.1 MB] ||
- ID: 2644 Visualization
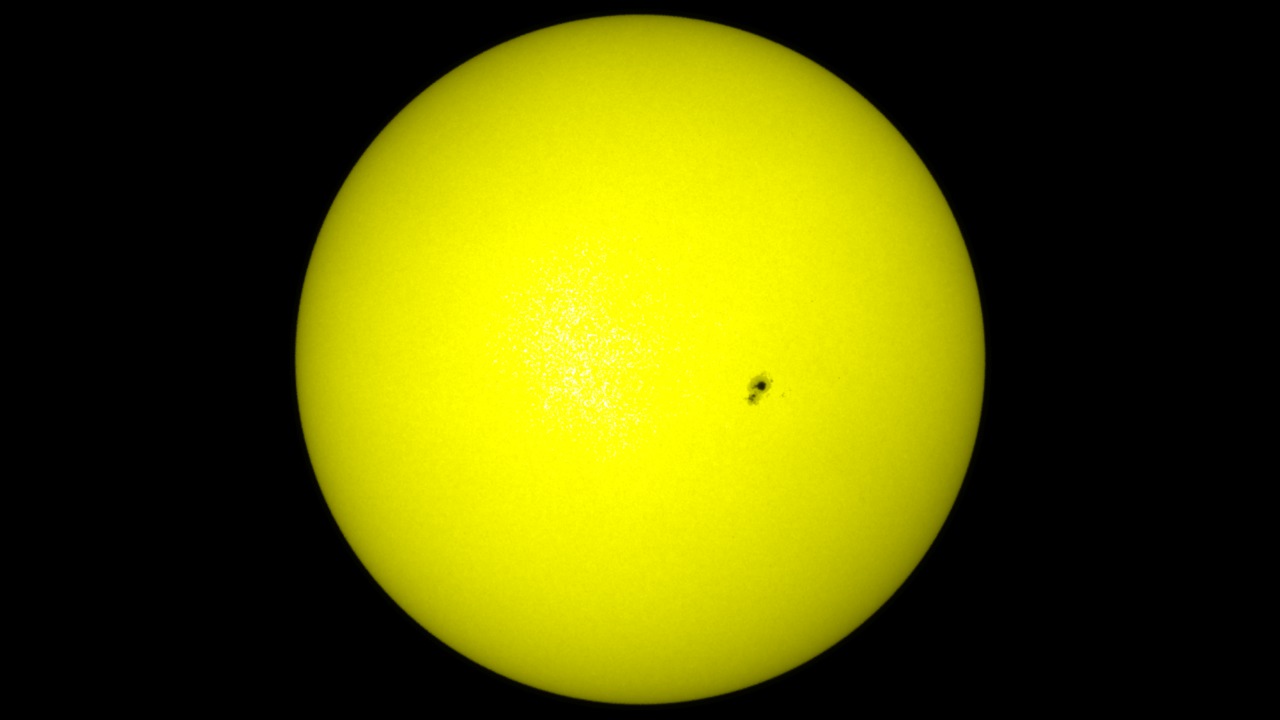
The Solar 'Constant' - Faculae vs. Sunspots
Go to this pageThree views of the Sun showing different levels of solar activity. The color table has been altered to enhance the appearance of the faculae (white regions) which are hotter than sunspots (red-black regions) and whose greater total area contribute to increasing the solar flux reaching the Earth. || Low solar activity - October 28, 1998 || activity-01-low.jpg (2048x2048) [437.9 KB] || activity-01-low_web.jpg (320x320) [21.2 KB] || activity-01-low.tif (2048x2048) [1.7 MB] ||
- ID: 3336 Visualization
The Visible Sun Revisited
Go to this pageScientists working with the SOHO/MDI instrument have continued to improve on previous results. Since the first release (SOHO/MDI's 'Window' Through the Sun), improvements in helioseismology techniques have enabled them to extract more information from the same data. In this case, sonogram-type imaging of the solar far side (the side of the Sun NOT facing the Earth) has been improved to provide a more complete view of the farside. This is important in space weather forecasting as it enables us to see large sunspots and active regions before they are visible directly from the Earth. Active regions are a source of solar flares which can send high-energy protons towards the Earth. These protons can damage satellite electronics, endangering communications and weather forecasting, and are a health threat to astronauts. ||
The Solar Cycle
- ID: 12500 Produced Video
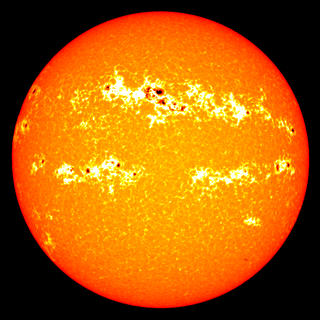
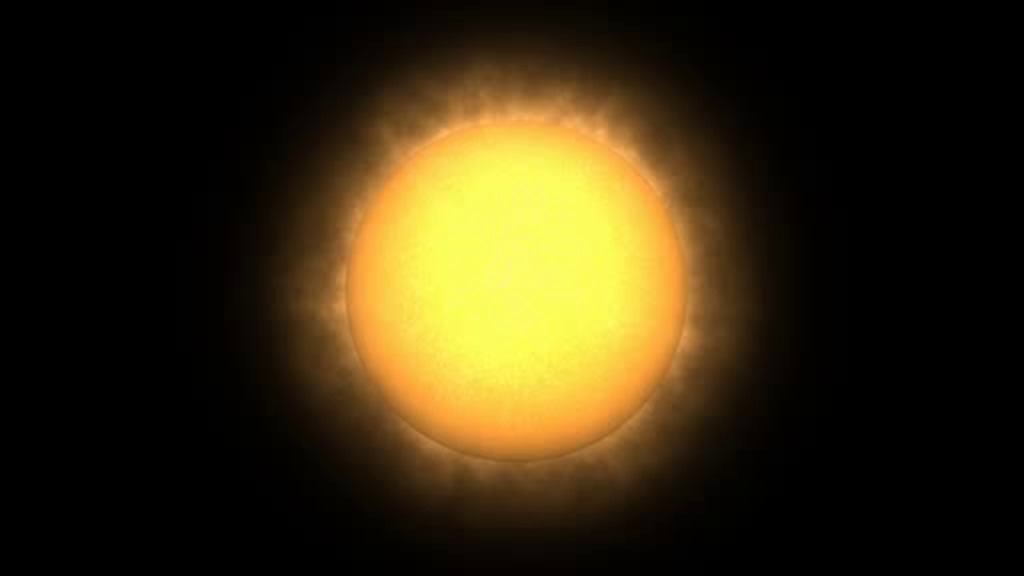
SDO: Year 7
Go to this pageThe Solar Dynamics Observatory, or SDO, has now captured nearly seven years worth of ultra-high resolution solar footage. This time lapse shows that full run from two of SDO's instruments. The large orange sun is visible light captured by the Helioseismic and Magnetic Imager, or HMI. The smaller golden sun is extreme ultraviolet light from the Atmospheric Imaging Assembly, or AIA, and reveals some of the sun's atmosphere, the corona. Both appear at one frame every 12 hours. SDO's nearly unbroken run is now long enough to watch the rise and fall of the current solar cycle. The graph of solar activity shows the sunspot number, a measurement based on the number of individual spots and the number of sunspot groups. In this case, the line represents a smoothed 26-day average to more clearly show the overall trend.Music: "Web of Intrigue" from Killer TracksWatch this video on the NASA Goddard YouTube channel.Complete transcript available. || SDO_Year7_Graph_Still.jpg (3840x2160) [1.2 MB] || 12500_SDO_Year_7_Good_H264_1080.m4v (1920x1080) [239.0 MB] || 12500_SDO_Year_7_1080.mov (1920x1080) [366.0 MB] || 12500_SDO_Year_7_FINAL_appletv.m4v (1280x720) [142.4 MB] || 12500_SDO_Year_7_Compatible.m4v (960x540) [98.1 MB] || 12500_SDO_Year_7_FINAL_appletv_subtitles.m4v (1280x720) [142.5 MB] || 12500_SDO_Year_7_Compatible.webm (960x540) [24.9 MB] || 12500_SDO_Year_7_ProRes_3840x2160_2997.mov (3840x2160) [12.1 GB] || 12500_SDO_Year_7_FINAL_youtube_hq.mov (3840x2160) [6.8 GB] || 12500_SDO_Year_7-Good_H264_4K.m4v (3840x2160) [1.1 GB] || 12500_SDO_Year_7_H264_4K.mov (3840x2160) [474.8 MB] || WMV_12500_SDO_Year_7_FINAL_HD.wmv (3840x2160) [2.2 GB] || 12500_SDO_Year_7_SRT_Captions.en_US.srt [1.4 KB] || 12500_SDO_Year_7_SRT_Captions.en_US.vtt [1.4 KB] ||
- ID: 10804 Produced Video
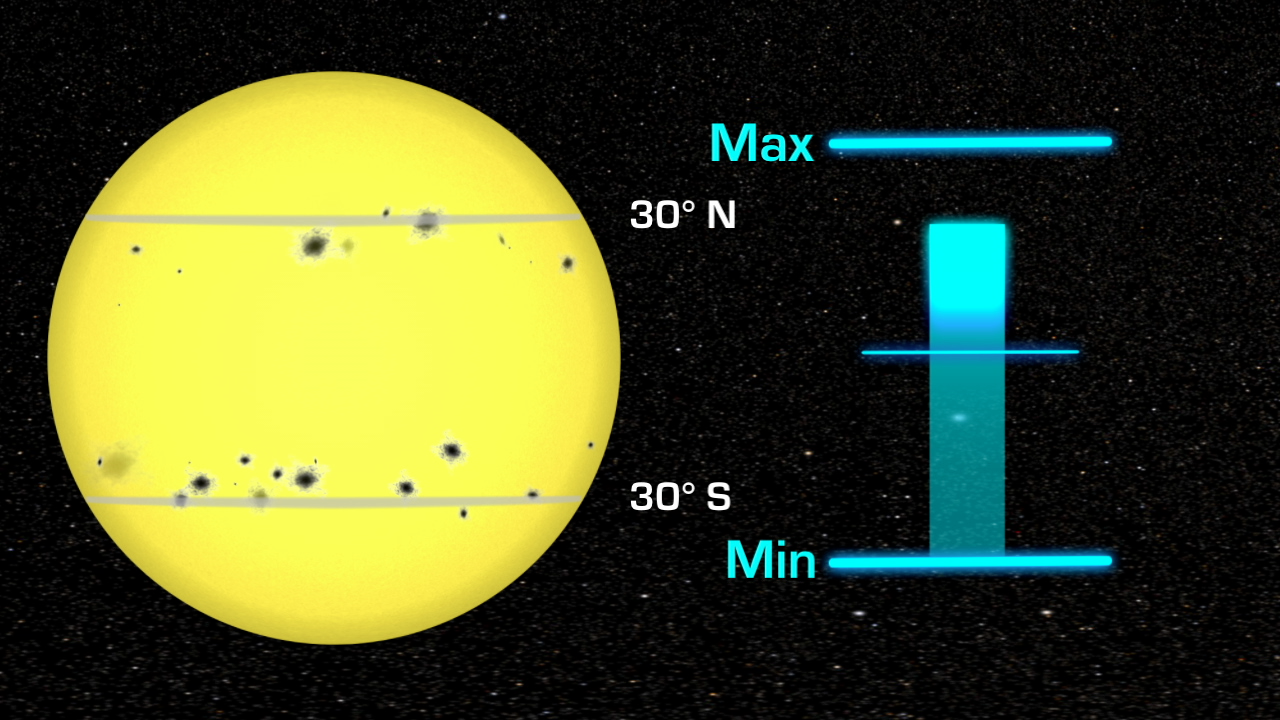
The Solar Cycle
Go to this pageThe number of sunspots increases and decreases over time in a regular, approximately 11-year cycle, called the sunspot cycle. The exact length of the cycle can vary. It has been as short as eight years and as long as fourteen, but the number of sunspots always increases over time, and then returns to low again. More sunspots mean increased solar activity, when great blooms of radiation known as solar flares or bursts of solar material known as coronal mass ejections (CMEs) shoot off the sun's surface. The highest number of sun spots in any given cycle is designated "solar maximum," while the lowest number is designated "solar minimum." Each cycle, varies dramatically in intensity, with some solar maxima being so low as to be almost indistinguishable from the preceding minimum. Sunspots are a magnetic phenomenon and the entire sun is magnetized with a north and a south magnetic pole just like a bar magnet. The comparison to a simple bar magnet ends there, however, as the sun's interior is constantly on the move. By tracking sound waves that course through the center of the sun, an area of research known as helioseismology, scientists can gain an understanding of what's deep inside the sun. They have found that the magnetic material inside the sun is constantly stretching, twisting, and crossing as it bubbles up to the surface. The exact pattern of movements is not conclusively mapped out, but over time they eventually lead to the poles reversing completely. The sunspot cycle happens because of this poles flip — north becomes south and south becomes north—approximately every 11 years. Some 11 years later, the poles reverse again back to where they started, making the full solar cycle actually a 22-year phenomenon. The sun behaves similarly over the course of each 11-year cycle no matter which pole is on top, however, so this shorter cycle tends to receive more attention. ||
- ID: 3548 Visualization
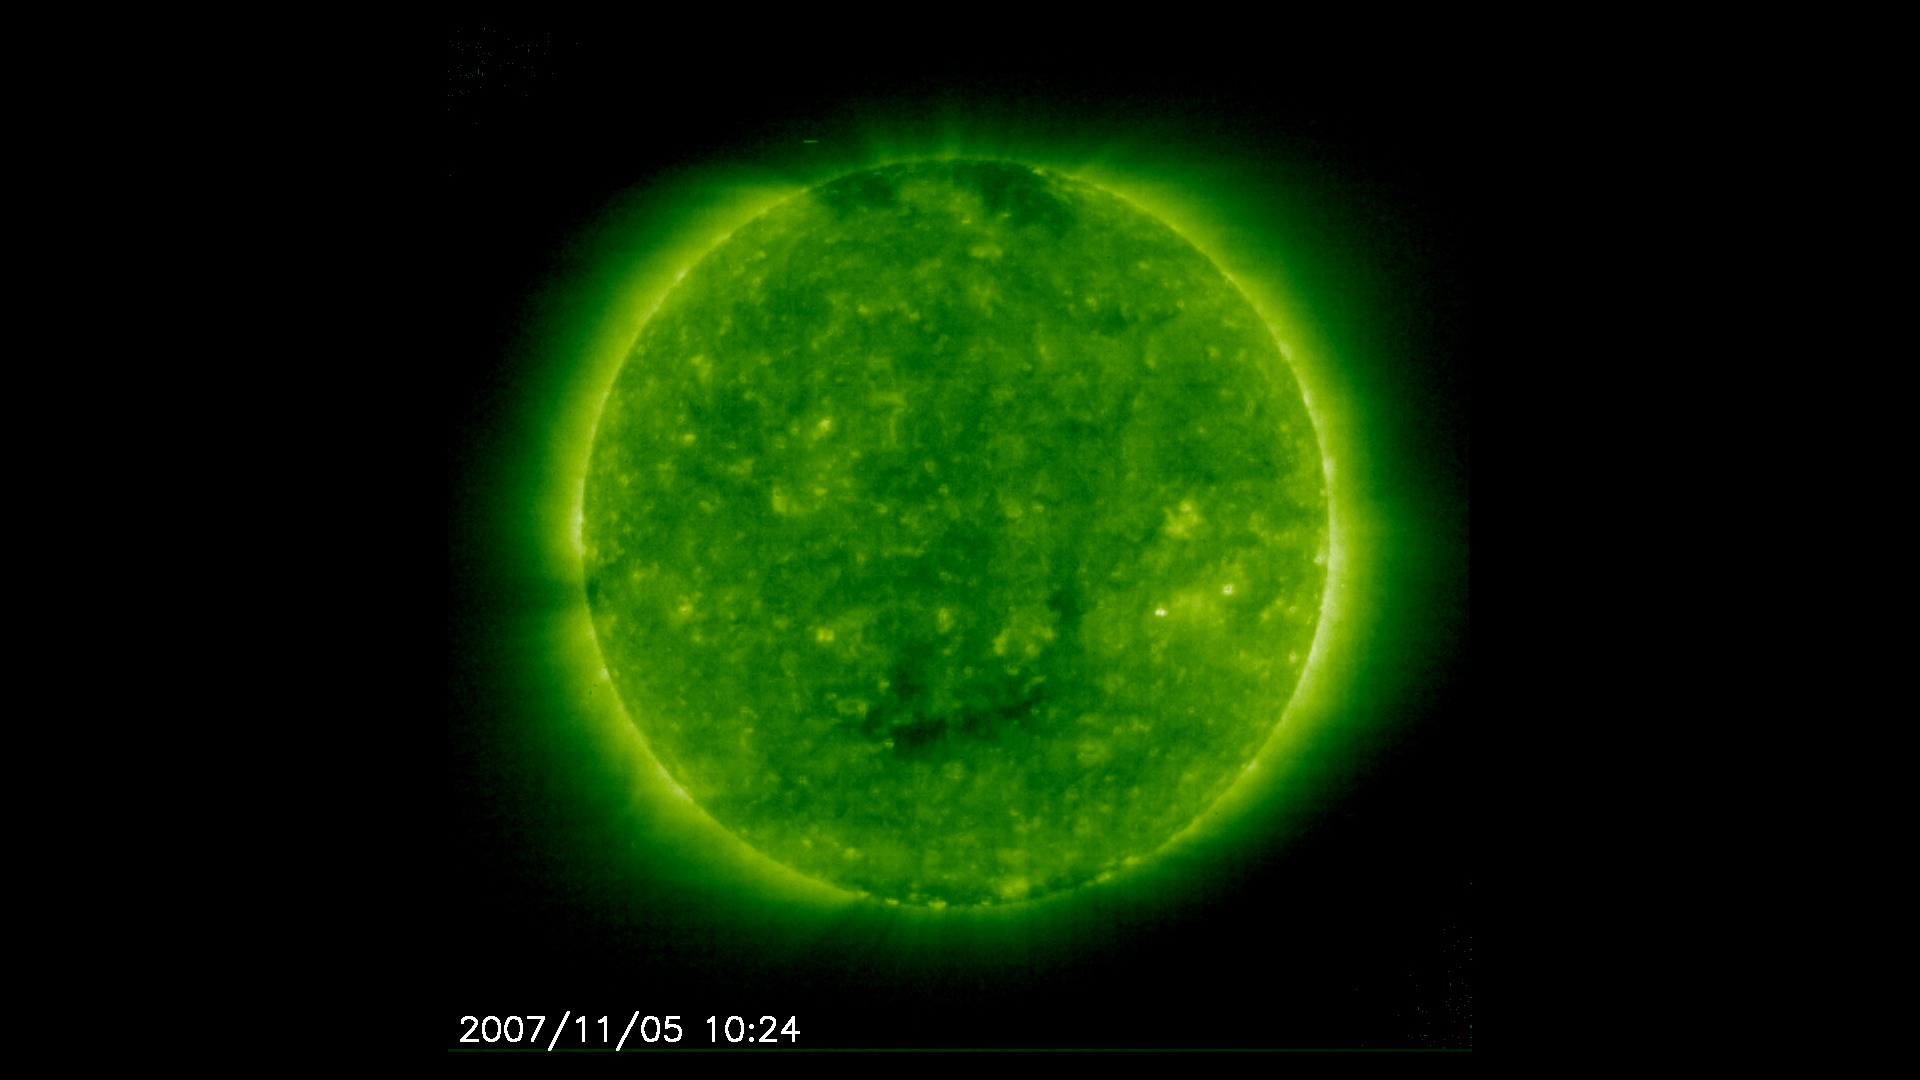
Comparison: Solar Minimum from SOHO/EIT
Go to this pageThis is a short movie of the Sun at the minimum of solar activity. This images are collected in ultraviolet light (a wavelength of 195 Å or 19.5 nanometers) which is only visible to space-based instruments. In visible light, few to now sunspots would be visible.At solar minimum, we see few bright active regions. The mottled look is from small 'hot spots' which last less than 48 hours. There are dark regions at the top and bottom of the Sun (corresponding to the north and south solar poles) created by solar magnetic field lines that connect to the interstellar magnetic field. A similar dark region, below the solar equator, is called a coronal hole, where open magnetic field lines enable particles to stream away at high speeds. ||
- ID: 3549 Visualization
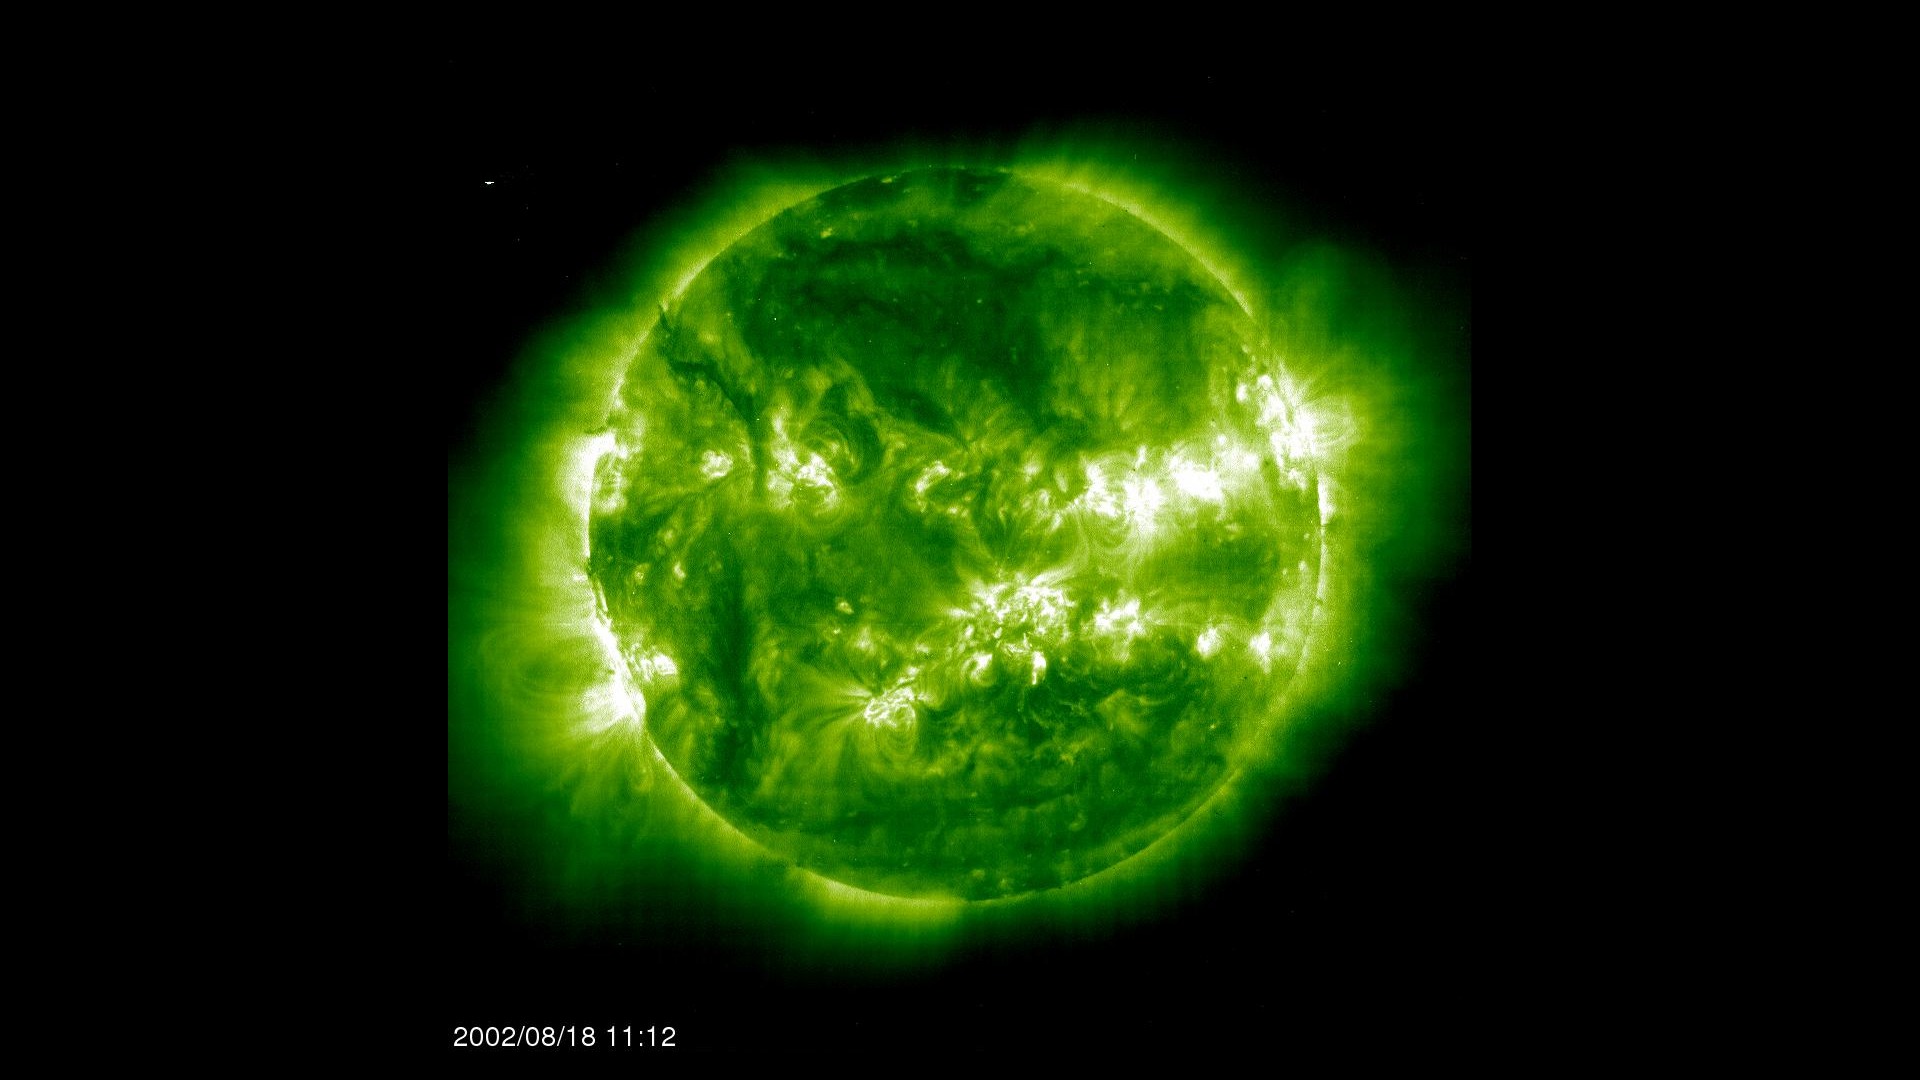
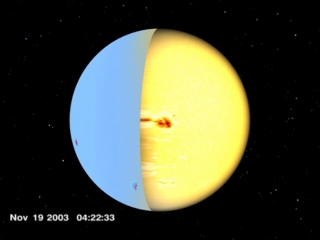
Comparison: Solar Maximum from SOHO/EIT
Go to this pageA short movie of the Sun at maximum solar activity as seen in ultraviolet light. These images are collected in ultraviolet light (a wavelength of 195Å or 19.5 nanometers) which is only visible to space-based instruments. In visible light, the bright white regions in these images would probably correspond to sunspots.At solar maximum, we see many bright active regions which tend to form in bands in the northern and southern hemispheres. Many of the active regions may eventually launch solar flares or coronal mass ejections (CME). ||
- ID: 3505 Visualization
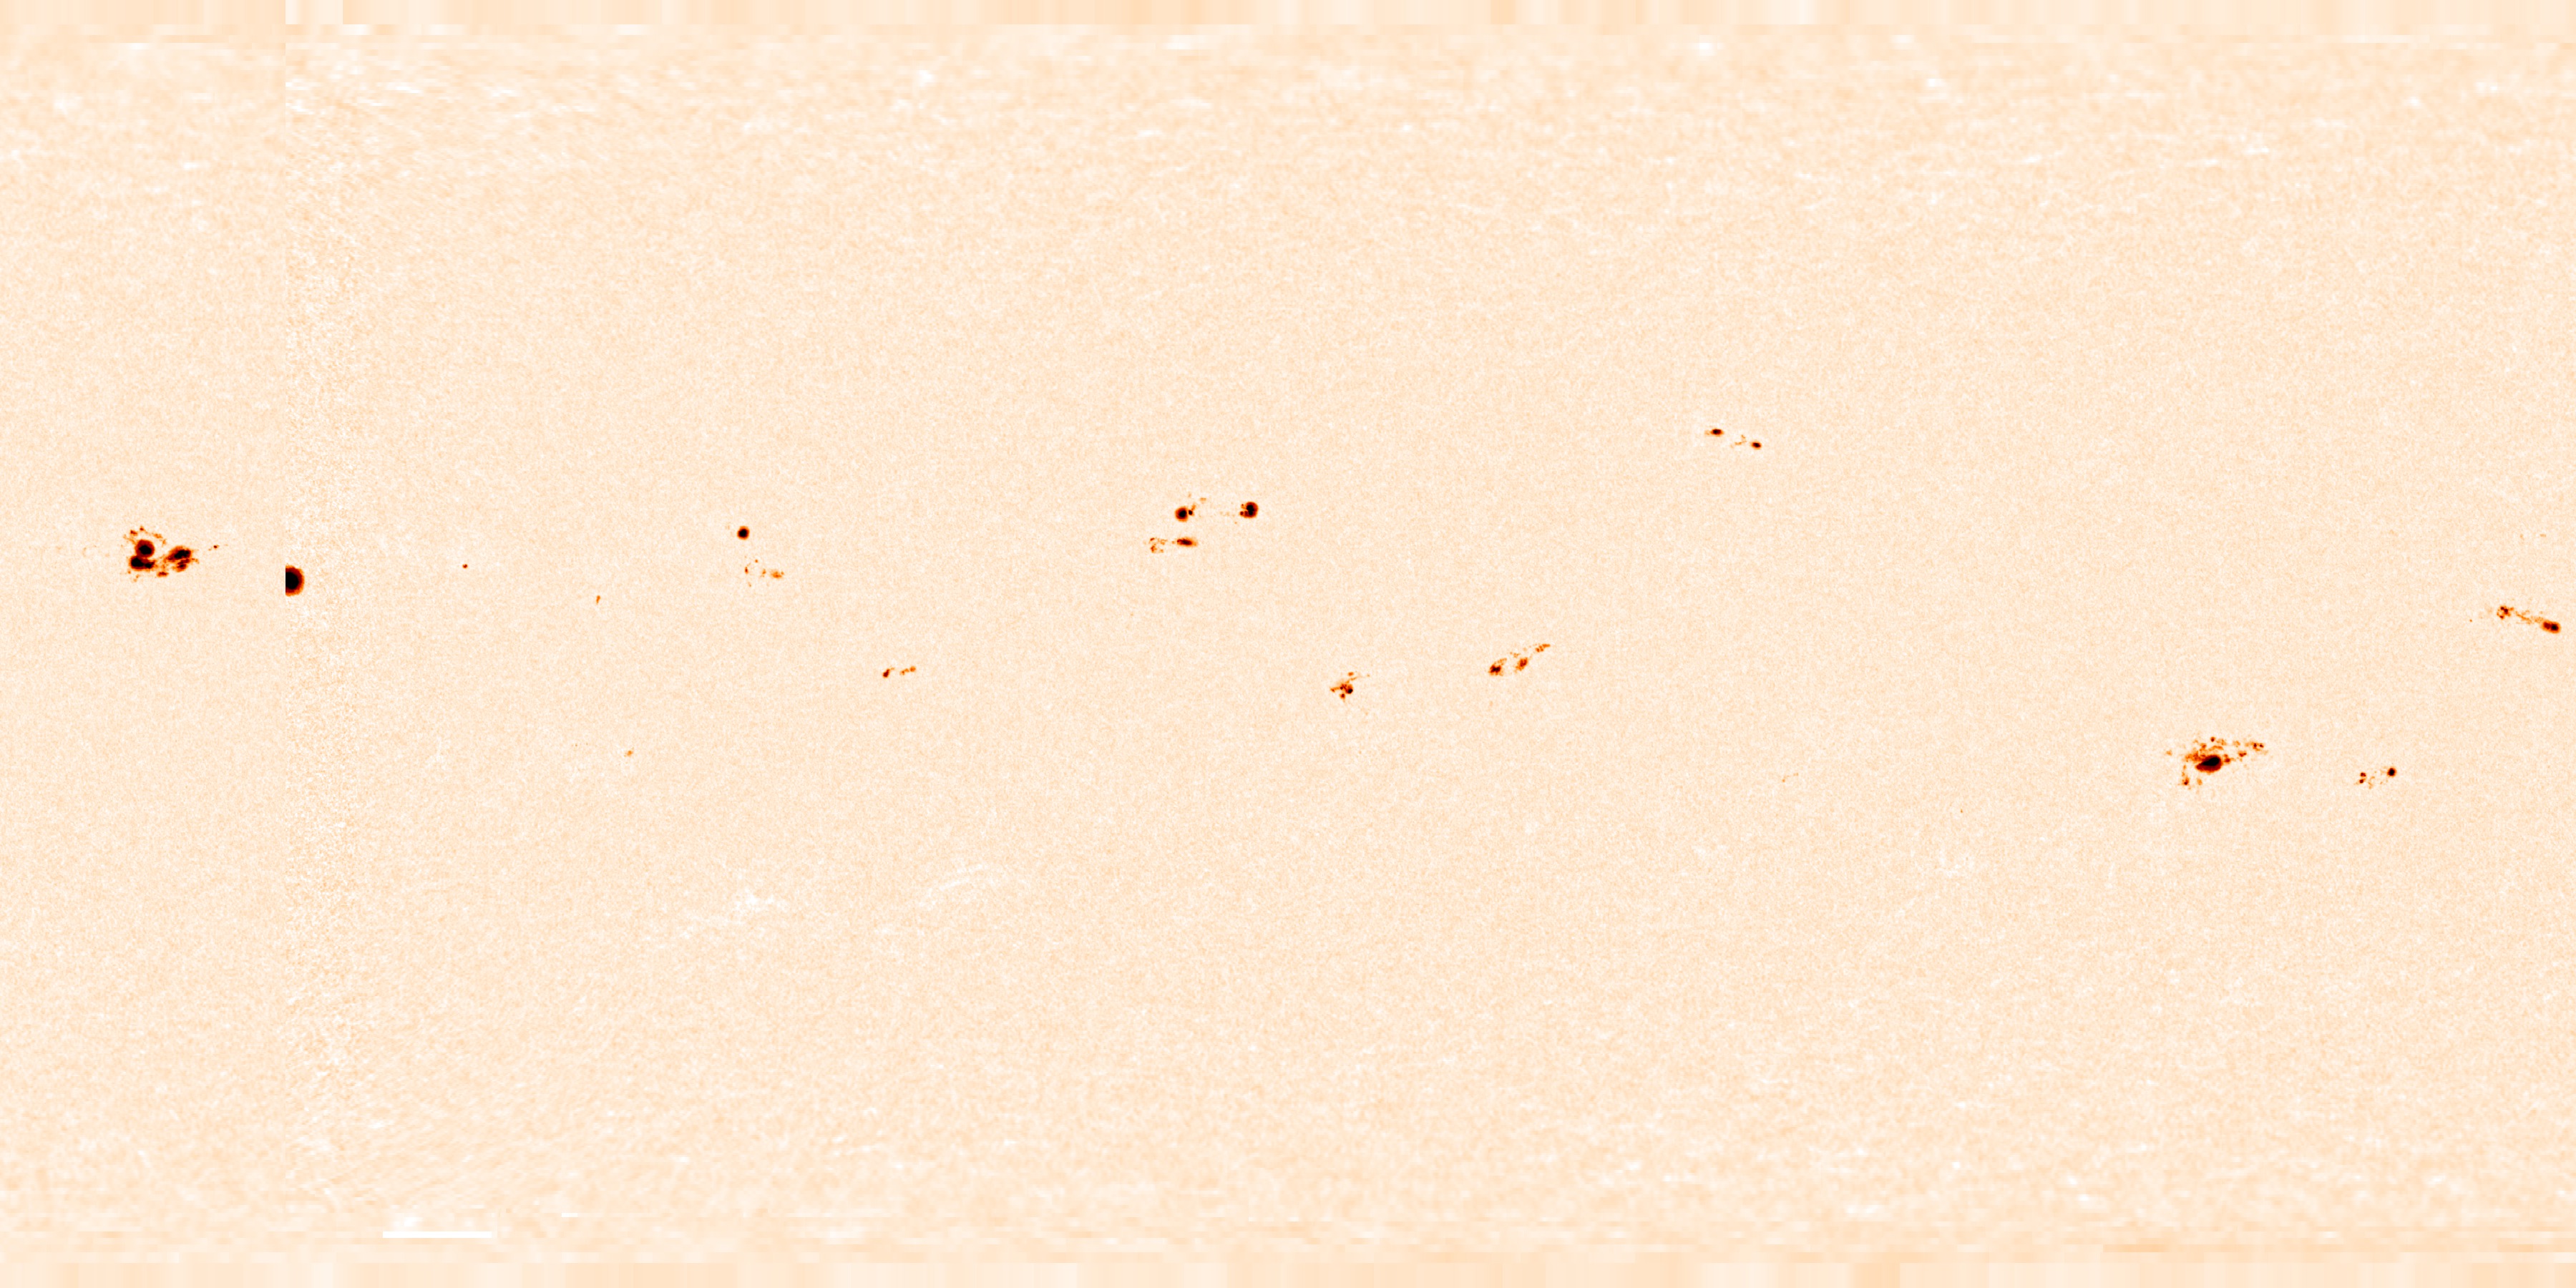
Solar Cycle 23: Minimum-Maximum-Minimum Synoptic Sequence
Go to this pageThis is a sequence of solar synoptic maps covering Solar Cycle 23.The SOHO spacecraft began collecting this data in May of 1996, near the beginning (minimum) of the sunspot cycle. The sequence is projected in cylindrical-equidistant (CED) coordinates suitable for reprojection on spheres for animation or visualization purposes. These images are not suitable for scientific analysis.The original data were collected in FITS format from the SOHO/MDI archive, one image for each Carrington Rotation, which are 27.2753 days long.Solar minimum for Cycle 23 was in May 1996 (Carrington Rotation #1909), solar maximum around March 2000 (Carrington Rotation #1960), with a return to minimum about October 2008 (Carrington Rotation #2075). There are two gaps in the sequence, totalling four rotations, at Carrington rotations #1938, 1939, 1940, 1941, and 1998. These images are missing from the sequence due to SOHO being offline. Gaps in the data coverage for individual maps (occasional day outages or poor coverage near the poles of the Sun) were filled using data accumulated from previous maps.IMPORTANT NOTE: These images are for visualization purposes only. They are not suitable for scientific analysis. ||
- ID: 3691 Visualization
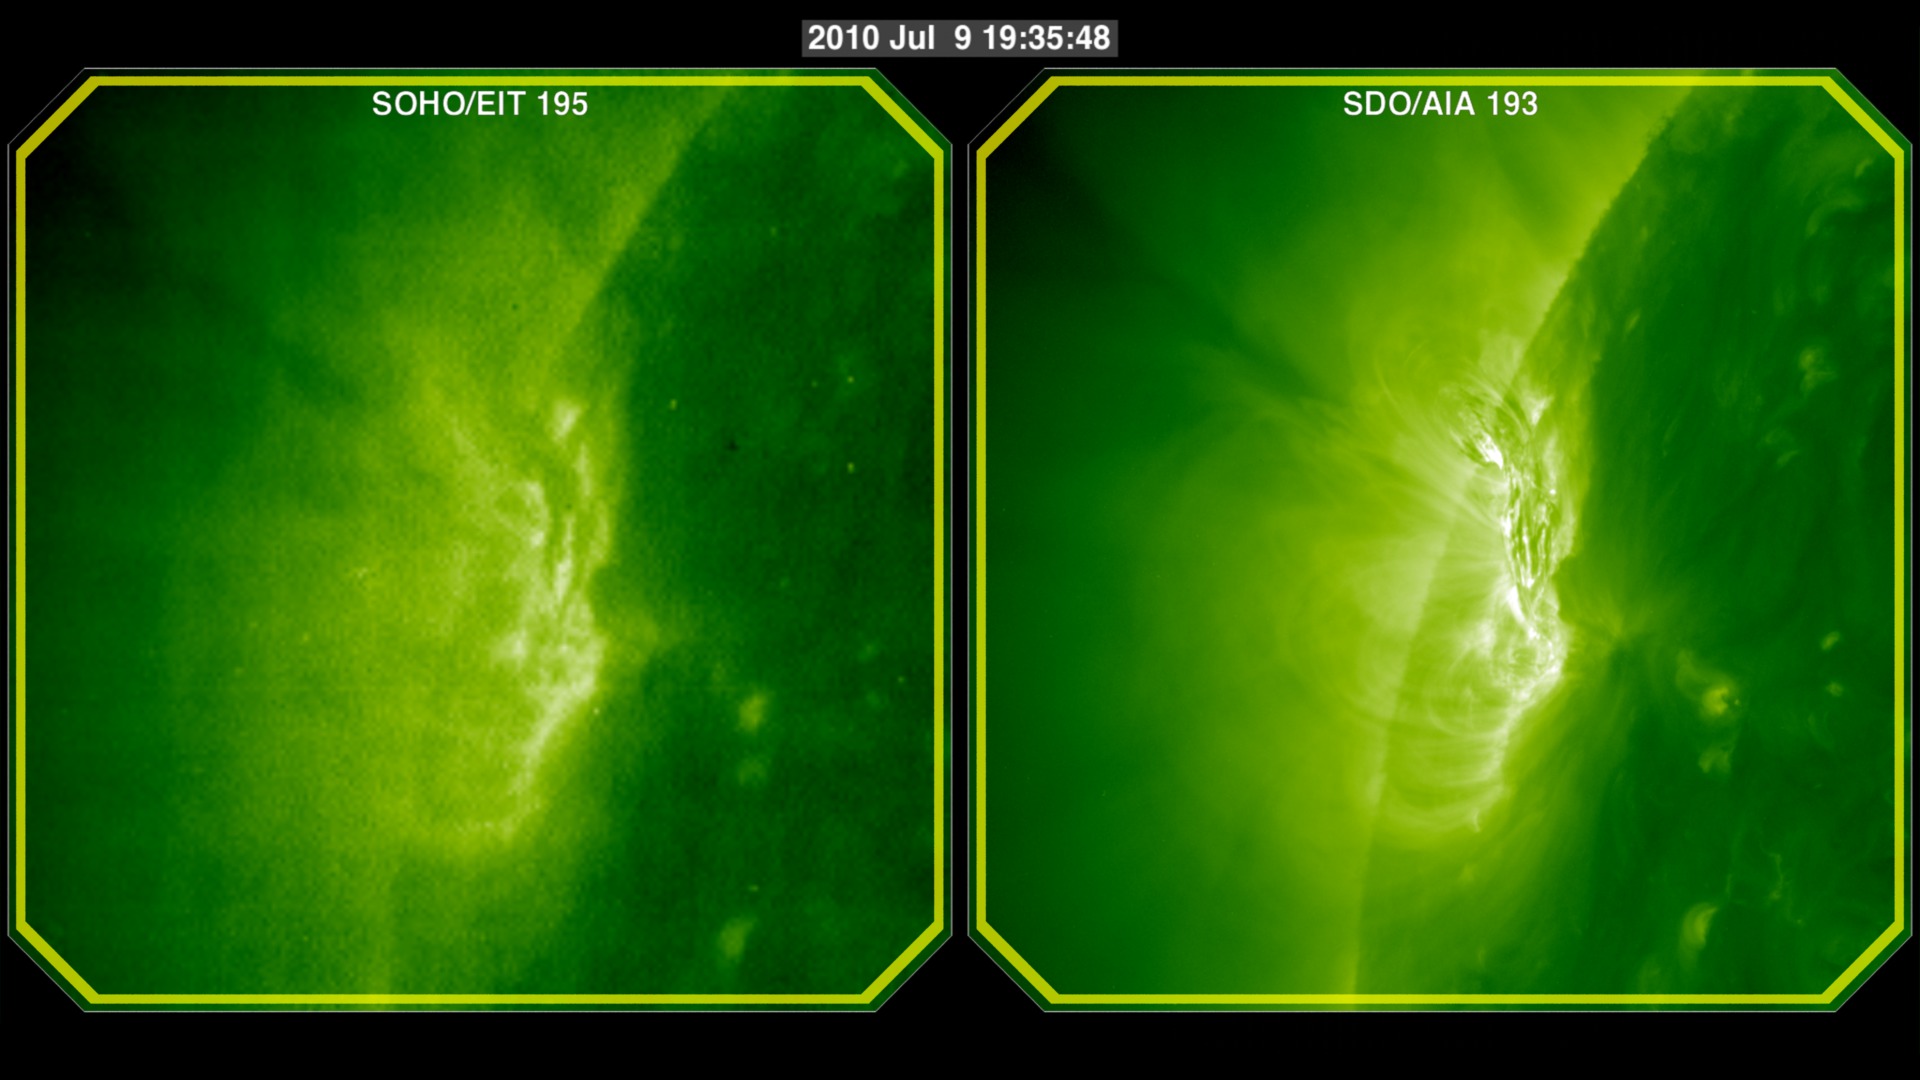
A Comparative View of the Sun: SDO/AIA 193 and SOHO/EIT 195
Go to this pageThis movie compares the spatial and temporal resolutions of the SDO/AIA (Atmospheric Imaging Assembly) imager to the SOHO/EIT (Extreme ultraviolet Imaging Telescope) imager. SOHO/EIT's highest resolution is 1024x1024 pixels with images taken about every 12 minutes for the 195 Ångstrom band. The SDO/AIA 193 band takes images at 4096x4096 pixels every twelve seconds!In this movie we can see the difference this makes for a closeup view of Active Region 1087. EIT reveals changes in the active region, which AIA reveals many details.This visualization is a companion piece to A Comparative View of the Sun: SDO/AIA 193 and STEREO-B/EUVI 195. ||
- ID: 20133 Animation
Solar Cycle (High Definition)
Go to this pageThis animation shows sunpot migration over a 11 year solar cycle and indicates the features causing total solar irradiance variability. For a standard definition version of this animation, please go to animation 10151. ||

- ID: 4124 Visualization
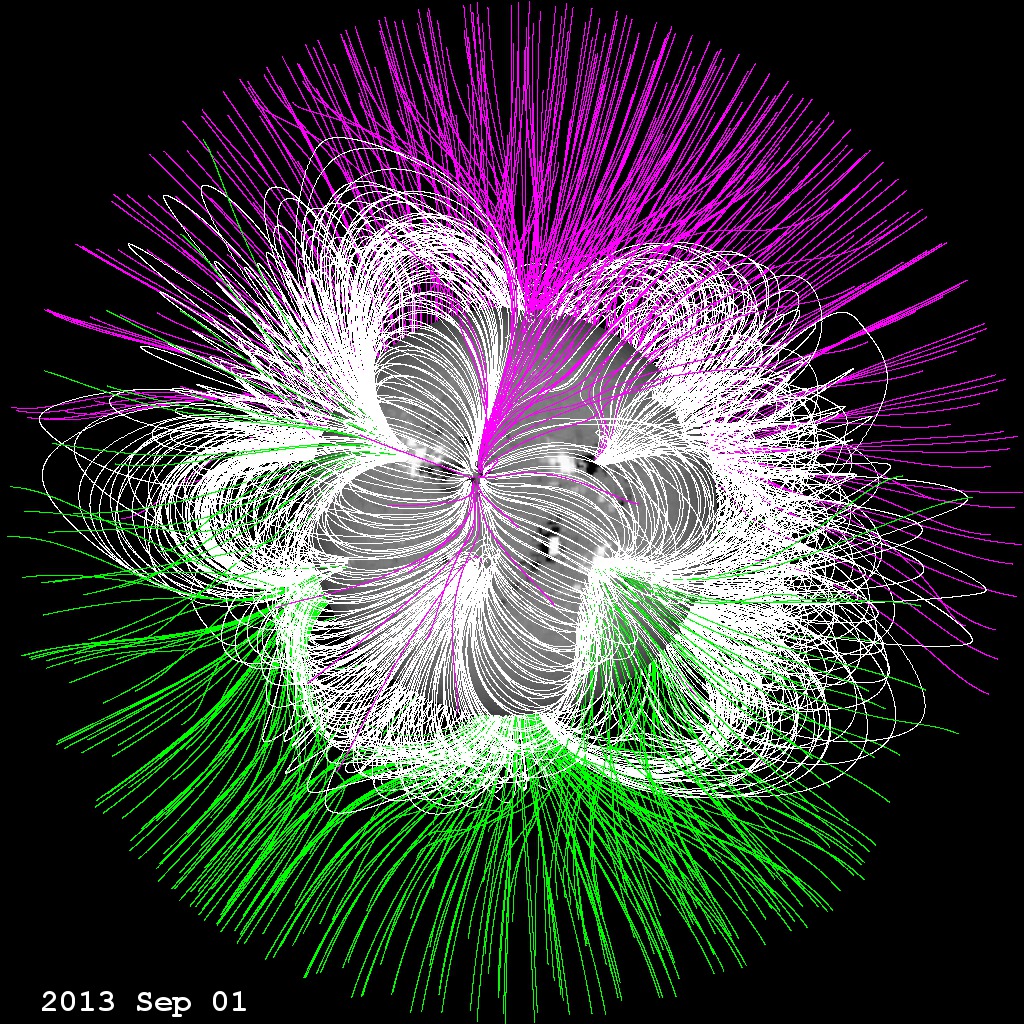
The Sun's Magnetic Field
Go to this pageDuring the course of the approximately 11 year sunspot cycle, the magnetic field of the Sun reverses. The last time this happened was around the year 2000. Using magnetograms from the SOHO/MDI and SDO/HMI instruments, it is possible to examine possible configurations of the magnetic field above the photosphere. These magnetic configurations are important in understanding potential conditions of severe space weather.The magnetic field in this animation is constructed using the Potential Field Source Surface (PFSS) model. The PFSS model is one of the simplest yet realistic models we can explore. Using the solar magnetograms as the 'source surface' of the field, it builds the field structure from the photosphere out to about two solar radii (an altitude of 1 solar radius). These visuals were generated using the SolarSoft package. In this visualization, the white magnetic field lines are considered 'closed'. The move up, and then return to the solar surface. The green and violet lines represenent field lines that are considered 'open'. Green represents positive magnetic polarity, and violet represents negative polarity. These field lines do not connect back to the Sun but with more distant magnetic fields in space. These field lines act as easy 'roads' for the high-speed solar wind. ||
Sunspot Science
- ID: 2232 Visualization
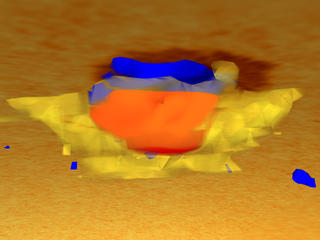
SOHO/MDI Investigates Solar Flows Under Sunspots
Go to this pageSOHO/MDI performs a 'sonogram' of the sun, revealing the subsurface temperature profile around a sunspot. Red isosurfaces denote regions where the sound speed (and temperature) are higher than average while blue isosurfaces directly under the spot illustrate where the sound speed (and temperature) are lower than average. ||
- ID: 551 Visualization
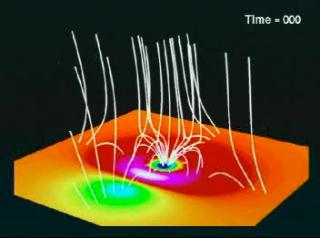
Delta Sunspot
Go to this pageWhen a large bundle of magnetic field lines breaks through the Sun's surface, a sunspot can form. Sometimes, a smaller spot will emerge nearby, creating a magnetically complex region where particles are energized and then violently expelled. Supercomputer models show that rearranging magnetic field lines enables this process. ||