Solar Cycle
The Amazing Changing Sun
Solar maximum is considered to be the 2-3 year peak period when the sun's activity is most complex and turbulent, and the space around Earth is most disturbed. Shown are the dramatic changes on the sun from solar minimum in 1996 to maximum in 2000. [SOHO / EIT]
- ID: 3549 Visualization
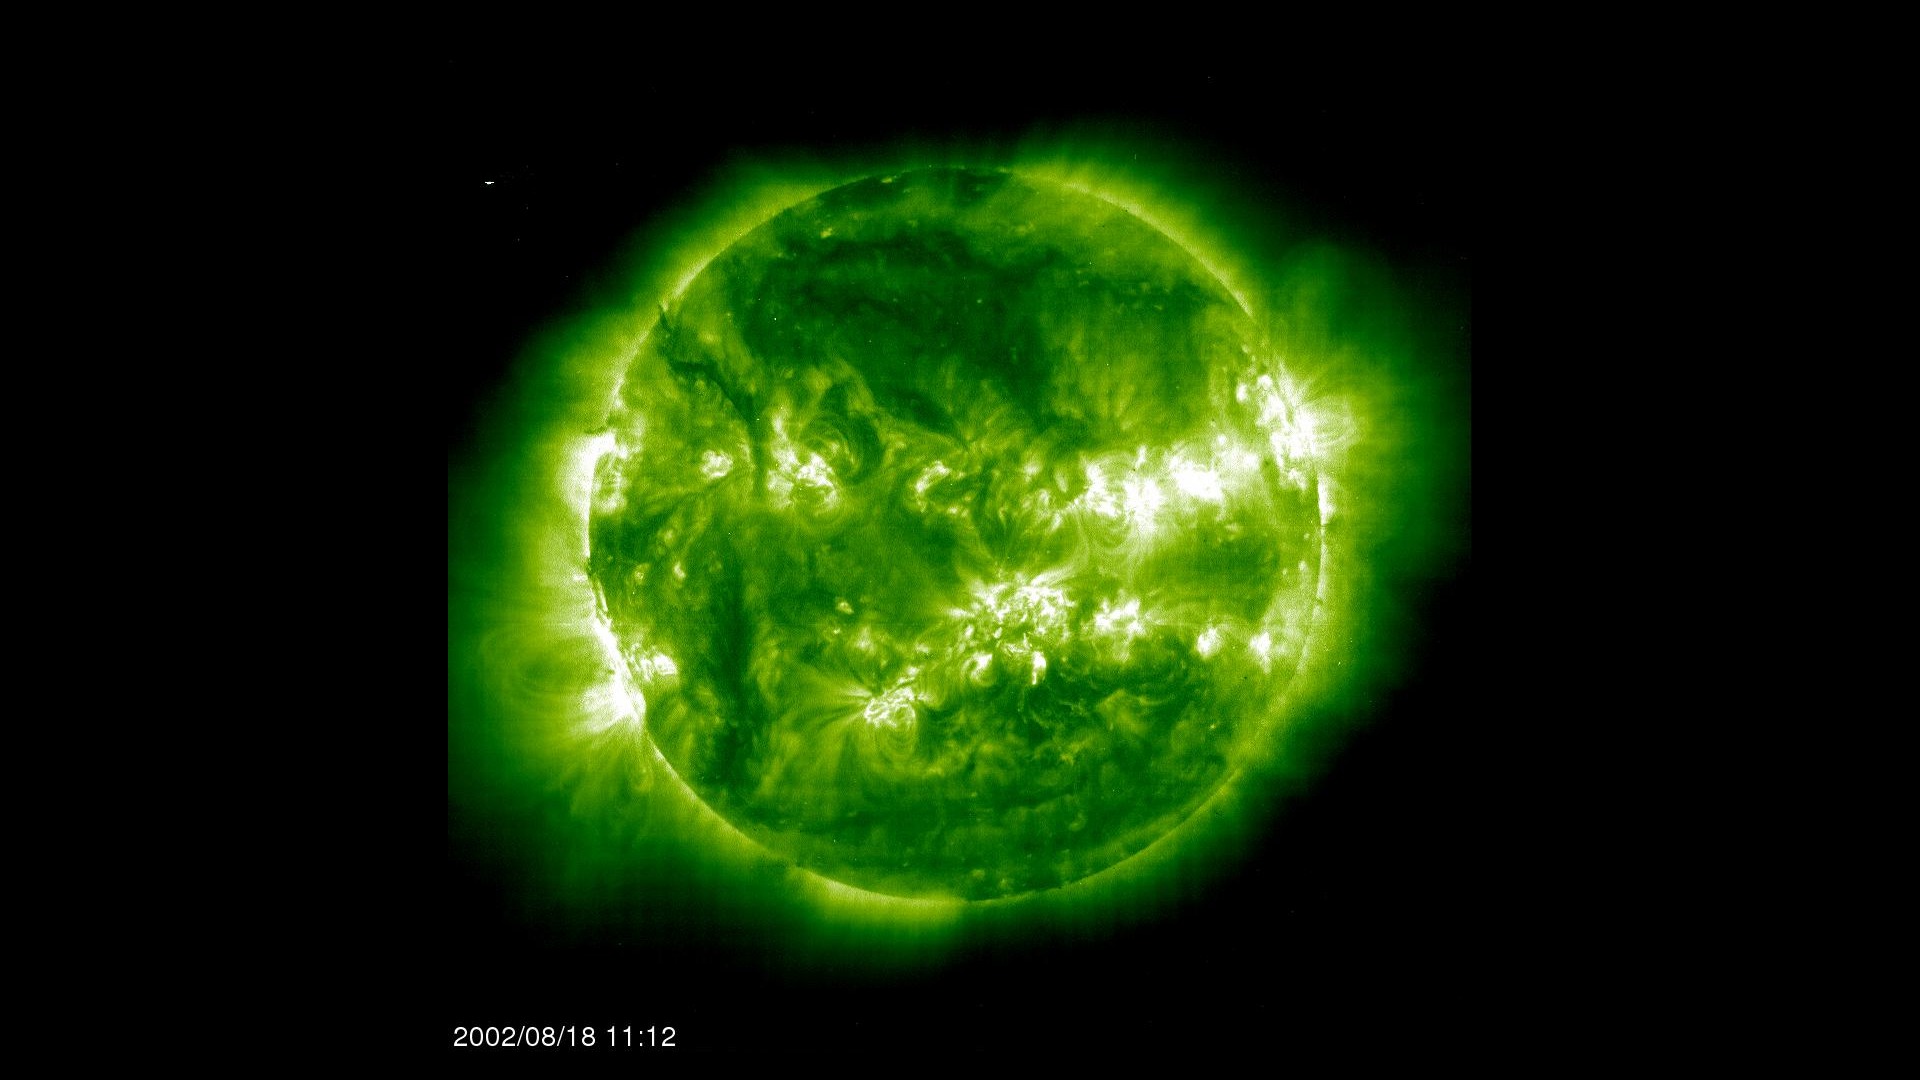
Comparison: Solar Maximum from SOHO/EIT
Go to this pageA short movie of the Sun at maximum solar activity as seen in ultraviolet light. These images are collected in ultraviolet light (a wavelength of 195Å or 19.5 nanometers) which is only visible to space-based instruments. In visible light, the bright white regions in these images would probably correspond to sunspots.At solar maximum, we see many bright active regions which tend to form in bands in the northern and southern hemispheres. Many of the active regions may eventually launch solar flares or coronal mass ejections (CME). ||
- ID: 3548 Visualization
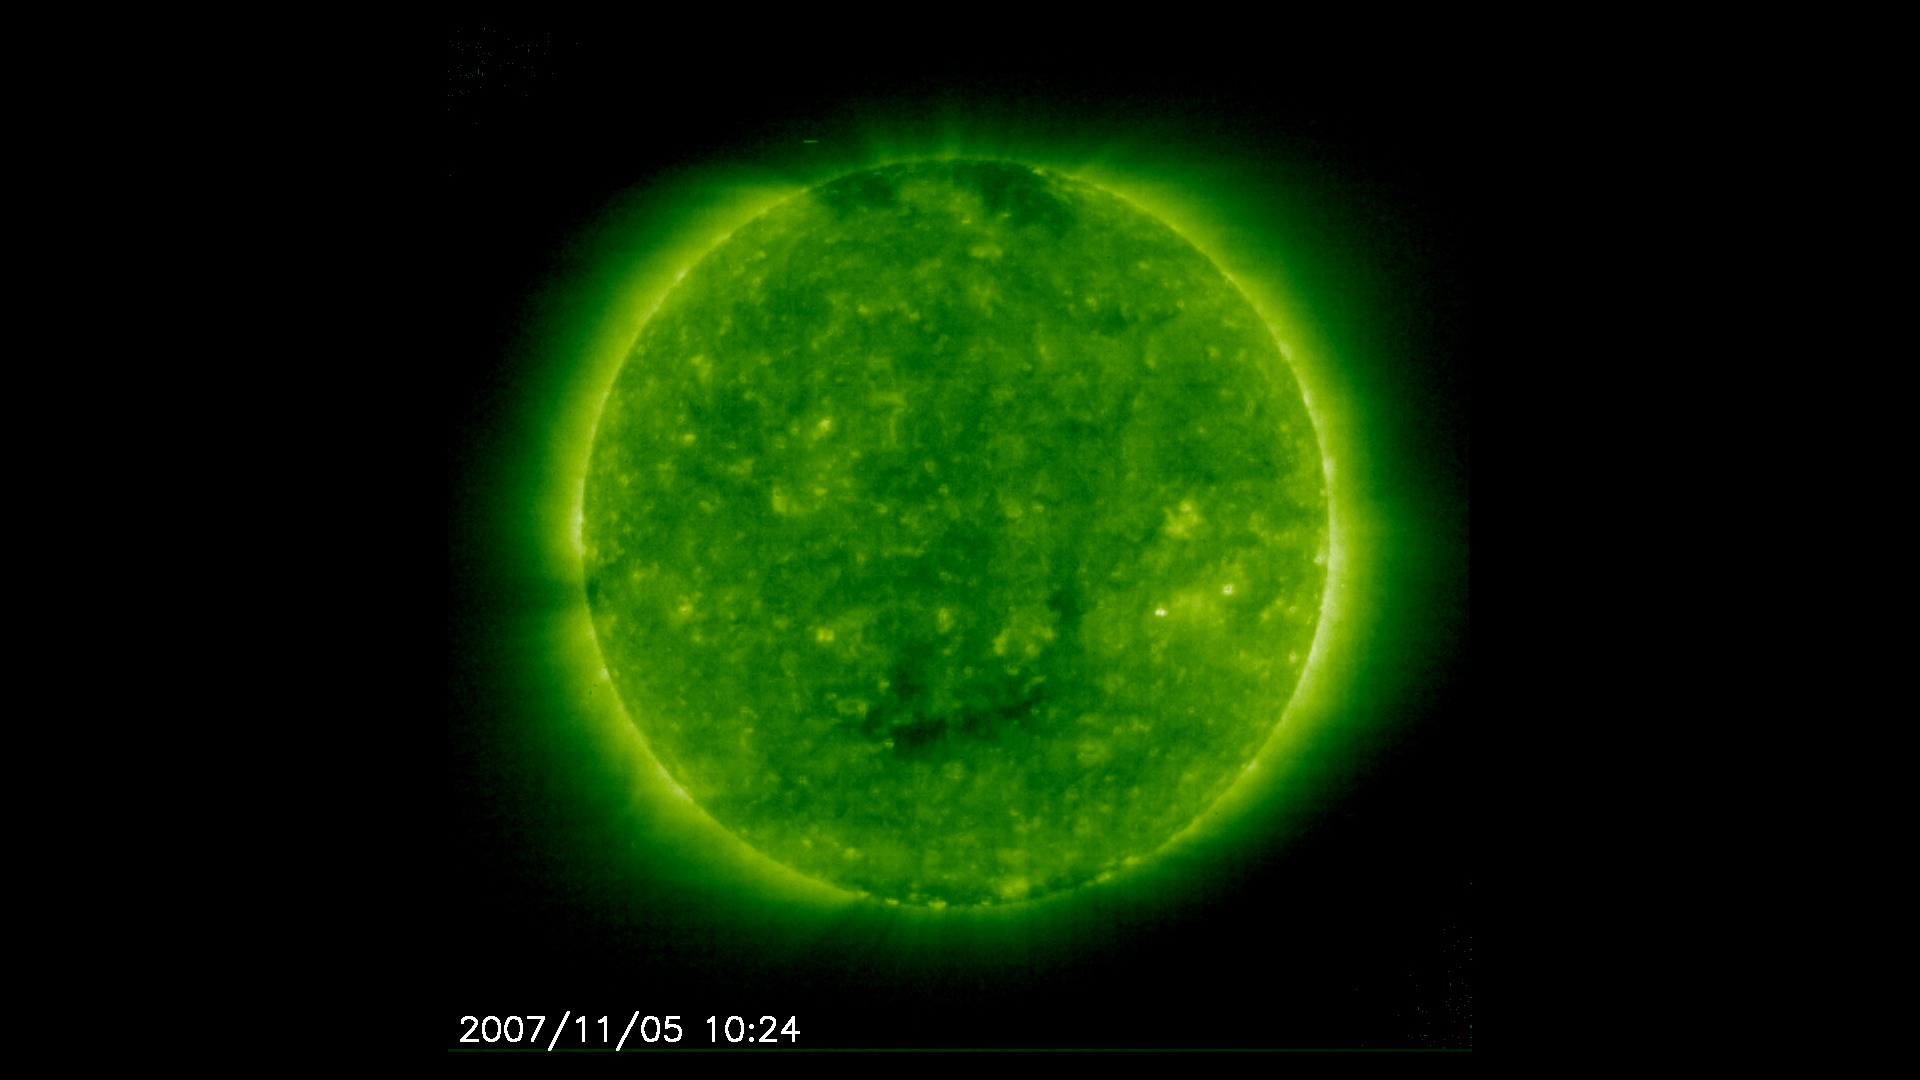
Comparison: Solar Minimum from SOHO/EIT
Go to this pageThis is a short movie of the Sun at the minimum of solar activity. This images are collected in ultraviolet light (a wavelength of 195 Å or 19.5 nanometers) which is only visible to space-based instruments. In visible light, few to now sunspots would be visible.At solar minimum, we see few bright active regions. The mottled look is from small 'hot spots' which last less than 48 hours. There are dark regions at the top and bottom of the Sun (corresponding to the north and south solar poles) created by solar magnetic field lines that connect to the interstellar magnetic field. A similar dark region, below the solar equator, is called a coronal hole, where open magnetic field lines enable particles to stream away at high speeds. ||
No Section Name
- ID: 20133 Animation
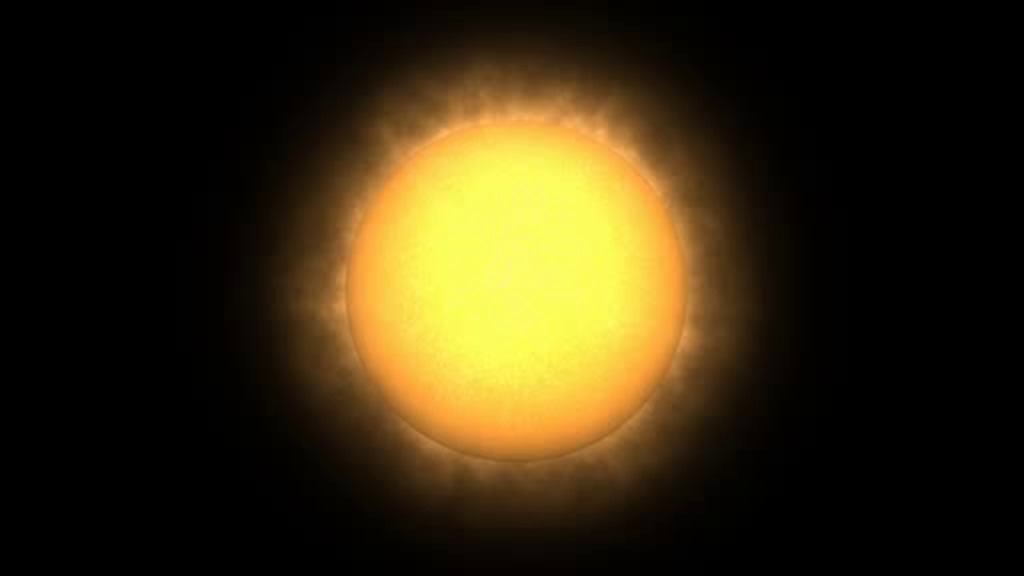
Solar Cycle (High Definition)
Go to this pageThis animation shows sunpot migration over a 11 year solar cycle and indicates the features causing total solar irradiance variability. For a standard definition version of this animation, please go to animation 10151. ||
- ID: 3583 Visualization
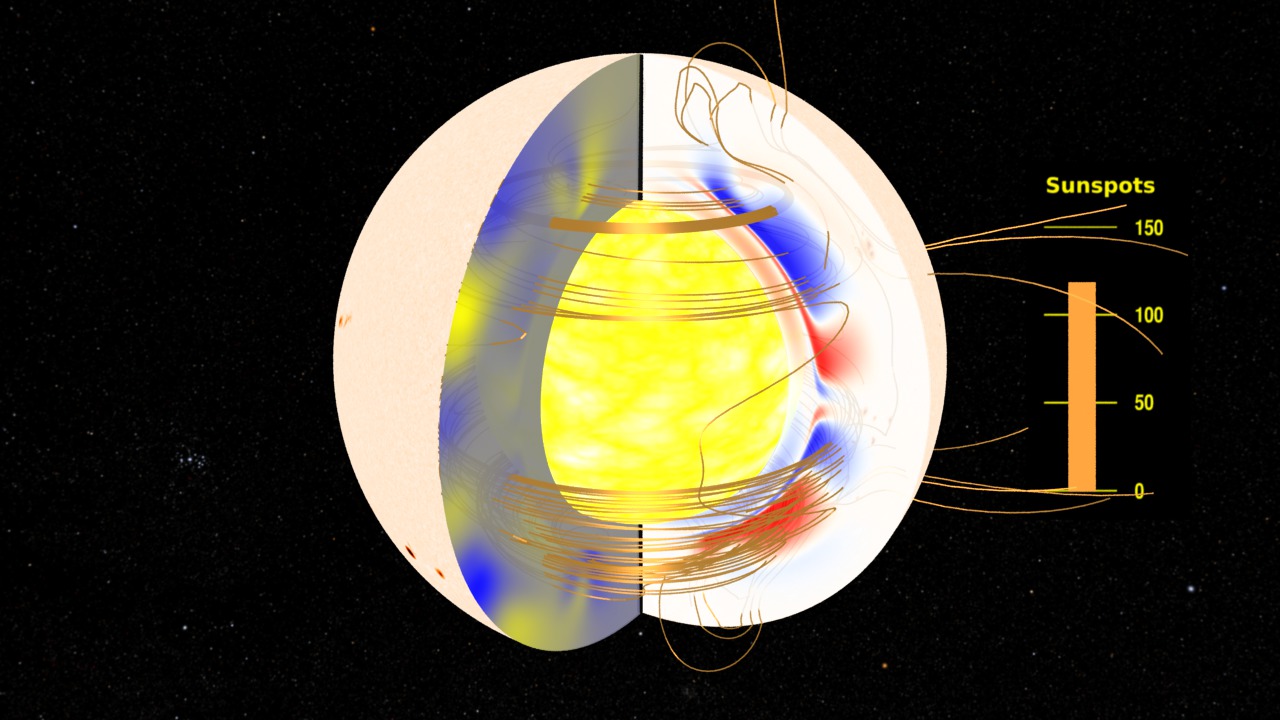
The Solar Dynamo: Toroidal and Radial Magnetic Fields
Go to this pageUsing the solar plasma flows as input (see The Solar Dynamo: Plasma Flows), the equations of magnetohydrodynamics, and 'seeding' the calculations with an initial small magnetic field, one can compute how a magnetic field can grow and be maintained. This is the dynamo process, the net result being that part of the Sun's outflowing thermal convective energy from nuclear processes is used to create the magnetic field.In this view of the solar dynamo mechanism, we examine the evolution of the toroidal magnetic field, intensities represented by color on the right-hand cross-section, and the radial magnetic field, represented on the left-hand cross-section. To see the poloidal magnetic vector potential, see The Solar Dynamo: Toroidal and Poloidal Magnetic Fields.In this visualization, the magnetic field lines (represented by the 'copper wire' structures) are 'snapshots' of the field structure constructed at each time step of the model. These field lines should not be considered as 'moving' or 'stretching' as the model evolves in time.Even this simplified model reproduces a number of characteristics observed in the actual solar magnetic field.Cyclic behavior with oscillations in the magnetic field amplitude.Magnetic regions at the surface migrate from high latitudes towards the equator. This reproduces the "Butterfly Diagram" pattern.Surface magnetic polarities reverse with each cycleBecause this model is axisymmetric, it cannot simulate non-axisymmetric features such as active longitudes. ||
- ID: 4124 Visualization
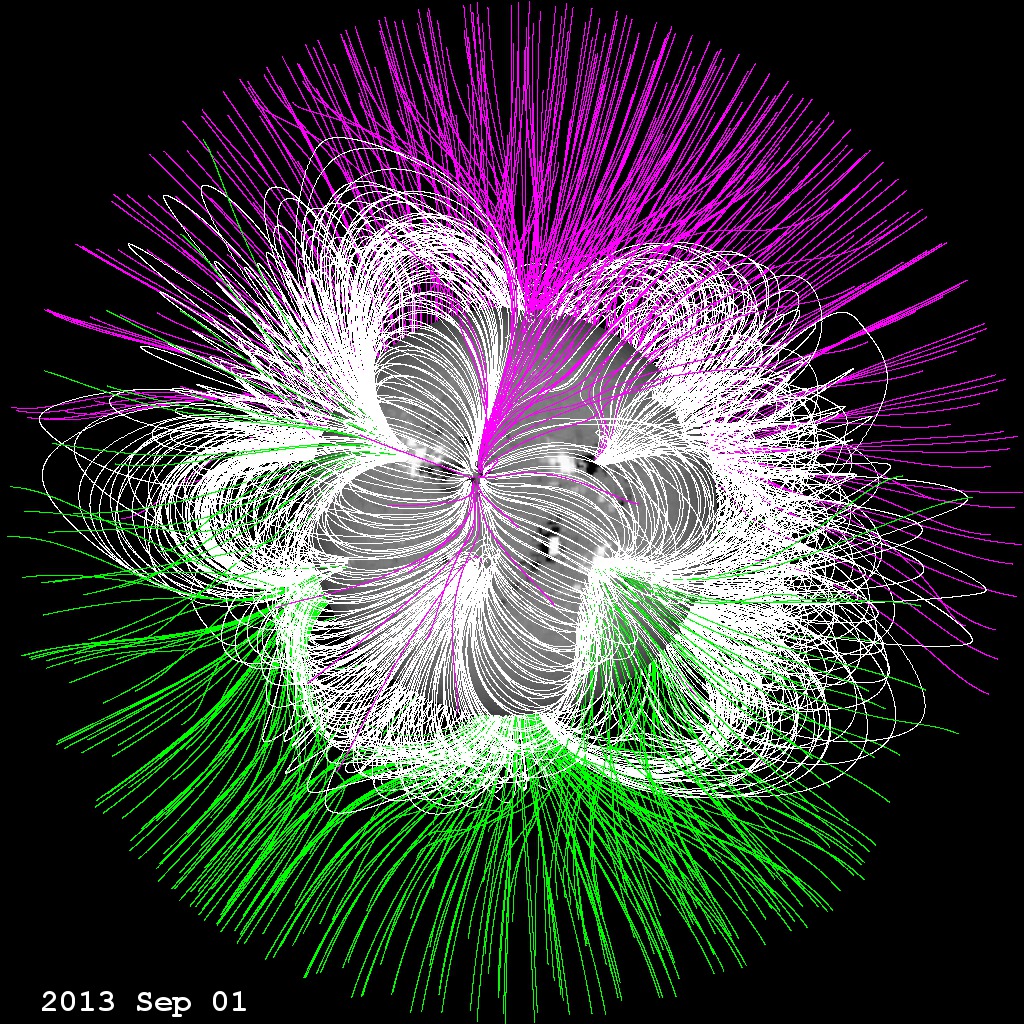
The Sun's Magnetic Field
Go to this pageDuring the course of the approximately 11 year sunspot cycle, the magnetic field of the Sun reverses. The last time this happened was around the year 2000. Using magnetograms from the SOHO/MDI and SDO/HMI instruments, it is possible to examine possible configurations of the magnetic field above the photosphere. These magnetic configurations are important in understanding potential conditions of severe space weather.The magnetic field in this animation is constructed using the Potential Field Source Surface (PFSS) model. The PFSS model is one of the simplest yet realistic models we can explore. Using the solar magnetograms as the 'source surface' of the field, it builds the field structure from the photosphere out to about two solar radii (an altitude of 1 solar radius). These visuals were generated using the SolarSoft package. In this visualization, the white magnetic field lines are considered 'closed'. The move up, and then return to the solar surface. The green and violet lines represenent field lines that are considered 'open'. Green represents positive magnetic polarity, and violet represents negative polarity. These field lines do not connect back to the Sun but with more distant magnetic fields in space. These field lines act as easy 'roads' for the high-speed solar wind. ||