Landslides
Overview
Landslides are one of the most pervasive hazards in the world, resulting in more fatalities and economic damage than is generally recognized. Intense and prolonged rainfall is the most frequent landslide trigger, saturating the soil on vulnerable slopes; but earthquakes, temperature, and human activities can also cause landslides. Understanding the land and weather conditions that lead to landslides on larger scales or within developing countries is often difficult because of the lack of ground-based sensors at the landslide site to provide rainfall information. Satellite data can play a key role in better understanding how the surface and rainfall may cause landslides, looking at changes over the last day or the last decade.
Landslide Climatology
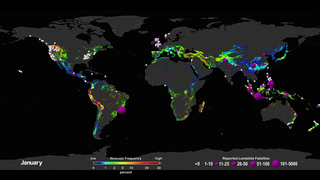
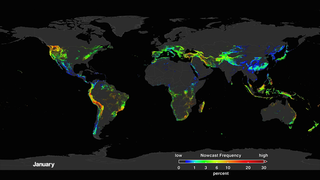
A new model has been developed to look at how potential landslide activity is changing around the world. A global Landslide Hazard Assessment model for Situational Awareness (LHASA) has been developed to provide an indication of where and when landslides may be likely around the world every 30min. This model uses surface susceptibility (including slope, vegetation, road networks, geology, and forest cover loss) and satellite rainfall data from the Global Precipitation Measurement (GPM) mission to provide moderate to high “nowcasts.” This visualization shows the landslide nowcast results leveraging nearly two decades of Tropical Rainfall Measurement Mission (TRMM) rainfall over 2001-2016 to identify a landslide climatology by month at a 1 km grid cell. The average nowcast values by month highlight the key landslide hotspots, such as the Southeast Asia during the monsoon season in June through August and the U.S. Pacific Northwest in December and January.
- Section
New NASA Model Finds Landslide Threats in Near Real-Time During Heavy Rains
Go to this sectionA new model has been developed to look at how potential landslide activity is changing around the world. A global Landslide Hazard Assessment model for Situational Awareness (LHASA) has been developed to provide an indication of where and when landslides may be likely around the world every 30 minutes. This model uses surface susceptibility (including slope, vegetation, road networks, geology, and forest cover loss) and satellite rainfall data from the Global Precipitation Measurement (GPM) mission to provide moderate to high “nowcasts.” This visualization shows the landslide nowcast results leveraging nearly two decades of Tropical Rainfall Measurement Mission (TRMM) rainfall over 2001-2016 to identify a landslide climatology by month at a 1 km grid cell. The average nowcast values by month highlight the key landslide hotspots, such as the Southeast Asia during the monsoon season in June through August and the U.S. Pacific Northwest in December and January.
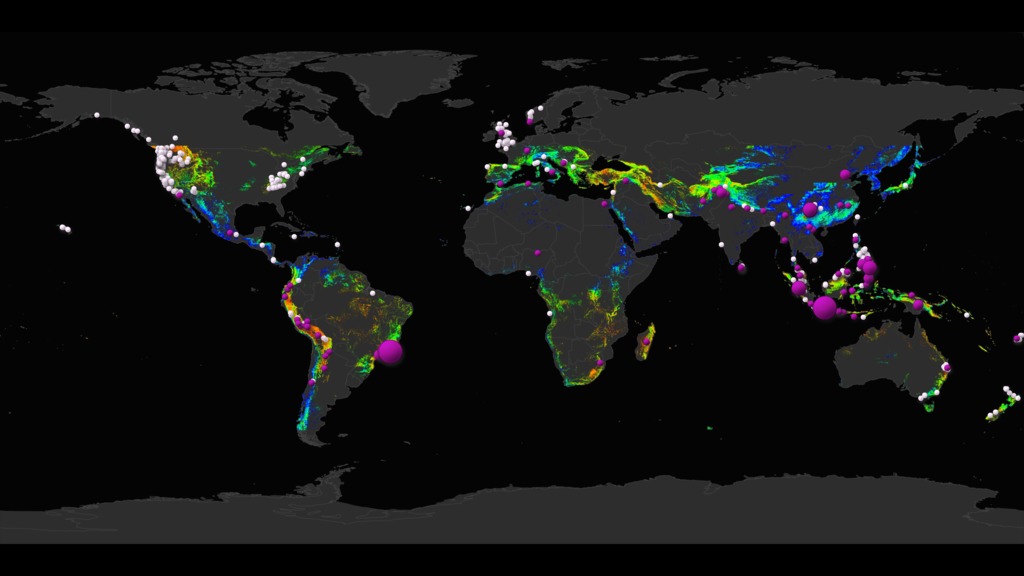
Overlaid with these nowcasts values are a Global Landslide Catalog(GLC) that was developed with the goal of identifying rainfall-triggered landslide events around the world, regardless of size, impact, or location. The GLC considers all types of mass movements triggered by rainfall, which have been reported in the media, disaster databases, scientific reports, or other sources. The visualization shows the distribution of landslides each month based on the estimated number of fatalities the event caused. The GLC has been compiled since 2007 at NASA's Goddard Space Flight Center and contains over 11,000 reports and growing. A new project called the Community the Cooperative Open Online Landslide Repository, or COOLR, provides the opportunity for the community to view landslide reports and contribute their own. The goal of the COOLR project is to create the largest global public online landslide catalog available and open to for anyone everyone to share, download, and analyze landslide information. More information on this system is available at: https://landslides.nasa.gov.
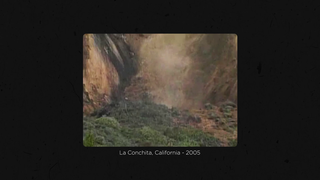
Landslides occur when an environmental trigger like an extreme rain event, often a severe storm or hurricane, and gravity's downward pull sets soil and rock in motion. Conditions beneath the surface are often unstable already, so the heavy rains act as the last straw that causes mud, rocks, or debris- or all combined- to move rapidly down mountains and hillsides. Unfortunately, people and property are often swept up in these unexpected mass movements. Landslides can also be caused by earthquakes, surface freezing and thawing, ice melt, the collapse of groundwater reservoirs, volcanic eruptions, and erosion at the base of a slope from the flow of river or ocean water. But torrential rains most commonly activate landslides. - Section
Global Landslide Climatology with Reported Fatalities
Go to this sectionA new model has been developed to look at how potential landslide activity is changing around the world. A global Landslide Hazard Assessment model for Situational Awareness (LHASA) has been developed to provide an indication of where and when landslides may be likely around the world every 30min. This model uses surface susceptibility (including slope, vegetation, road networks, geology, and forest cover loss) and satellite rainfall data from the Global Precipitation Measurement (GPM) mission to provide moderate to high “nowcasts.” This visualization shows the landslide nowcast results leveraging nearly two decades of Tropical Rainfall Measurement Mission (TRMM) rainfall over 2001-2016 to identify a landslide climatology by month at a 1 km grid cell. The average nowcast values by month highlight the key landslide hotspots, such as the Southeast Asia during the monsoon season in June through August and the U.S. Pacific Northwest in December and January.
Overlaid with these nowcasts values are a Global Landslide Catalog was developed with the goal of identifying rainfall-triggered landslide events around the world, regardless of size, impact, or location. The GLC considers all types of mass movements triggered by rainfall, which have been reported in the media, disaster databases, scientific reports, or other sources. The visualization shows the distribution of landslides each month based on the estimated number of fatalities the event caused. The GLC has been compiled since 2007 at NASA Goddard Space Flight Center and contains over 11,000 reports and growing. A new project called the Community the Cooperative Open Online Landslide Repository, or COOLR, provides the opportunity for the community to view landslide reports and contribute their own. The goal of the COOLR project is to create the largest global public online landslide catalog available and open to for anyone everyone to share, download, and analyze landslide information. More information on this system is available at: https://landslides.nasa.gov.
Landslides occur when an environmental trigger like an extreme rain event, often a severe storm or hurricane, and gravity's downward pull sets soil and rock in motion. Conditions beneath the surface are often unstable already, so the heavy rains act as the last straw that causes mud, rocks, or debris- or all combined- to move rapidly down mountains and hillsides. Unfortunately, people and property are often swept up in these unexpected mass movements. Landslides can also be caused by earthquakes, surface freezing and thawing, ice melt, the collapse of groundwater reservoirs, volcanic eruptions, and erosion at the base of a slope from the flow of river or ocean water. But torrential rains most commonly activate landslides. - Section
Global Landslide Climatology
Go to this sectionA new model has been developed to look at how potential landslide activity is changing around the world. A global Landslide Hazard Assessment model for Situational Awareness (LHASA) has been developed to provide an indication of where and when landslides may be likely around the world every 30min. This model uses surface susceptibility (including slope, vegetation, road networks, geology, and forest cover loss) and satellite rainfall data from the Global Precipitation Measurement (GPM) mission to provide moderate to high “nowcasts.” This visualization shows the landslide nowcast results leveraging nearly two decades of Tropical Rainfall Measurement Mission (TRMM) rainfall over 2001-2016 to identify a landslide climatology by month at a 1 km grid cell. The average nowcast values by month highlight the key landslide hotspots, such as the Southeast Asia during the monsoon season in June through August and the U.S. Pacific Northwest in December and January.
Overlaid with these nowcasts values are a Global Landslide Catalog was developed with the goal of identifying rainfall-triggered landslide events around the world, regardless of size, impact, or location. The GLC considers all types of mass movements triggered by rainfall, which have been reported in the media, disaster databases, scientific reports, or other sources. The visualization shows the distribution of landslides each month based on the estimated number of fatalities the event caused. The GLC has been compiled since 2007 at NASA Goddard Space Flight Center and contains over 11,000 reports and growing. A new project called the Community the Cooperative Open Online Landslide Repository, or COOLR, provides the opportunity for the community to view landslide reports and contribute their own. The goal of the COOLR project is to create the largest global public online landslide catalog available and open to for anyone everyone to share, download, and analyze landslide information. More information on this system is available at: https://landslides.nasa.gov.
Landslides occur when an environmental trigger like an extreme rain event, often a severe storm or hurricane, and gravity's downward pull sets soil and rock in motion. Conditions beneath the surface are often unstable already, so the heavy rains act as the last straw that causes mud, rocks, or debris- or all combined- to move rapidly down mountains and hillsides. Unfortunately, people and property are often swept up in these unexpected mass movements. Landslides can also be caused by earthquakes, surface freezing and thawing, ice melt, the collapse of groundwater reservoirs, volcanic eruptions, and erosion at the base of a slope from the flow of river or ocean water. But torrential rains most commonly activate landslides. - Section
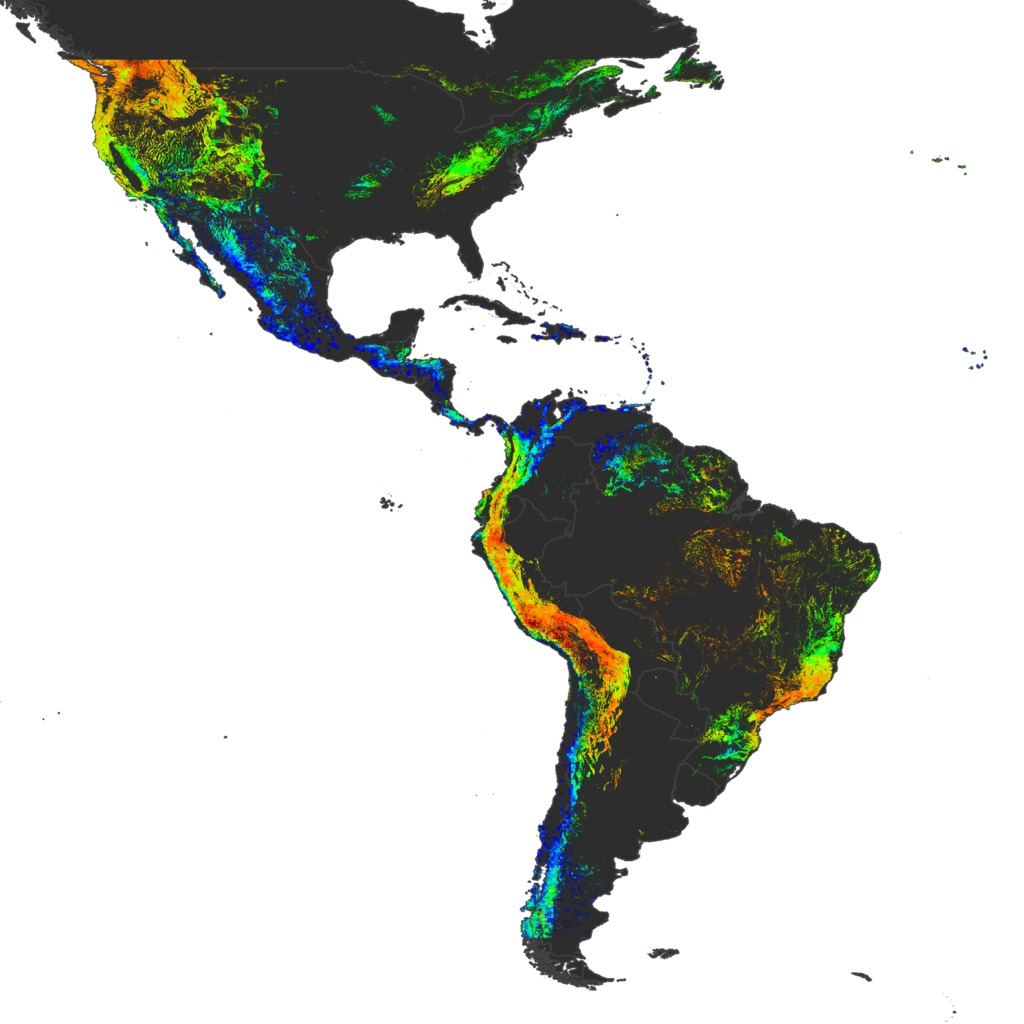
Landslide Climatology with Fatalities in the Americas
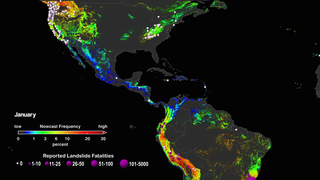
Go to this sectionA new model has been developed to look at how potential landslide activity is changing around the world. A global Landslide Hazard Assessment model for Situational Awareness (LHASA) has been developed to provide an indication of where and when landslides may be likely around the world every 30min. This model uses surface susceptibility (including slope, vegetation, road networks, geology, and forest cover loss) and satellite rainfall data from the Global Precipitation Measurement (GPM) mission to provide moderate to high “nowcasts.” This visualization shows the landslide nowcast results leveraging nearly two decades of Tropical Rainfall Measurement Mission (TRMM) rainfall over 2001-2016 to identify a landslide climatology by month at a 1 km grid cell. The average nowcast values by month highlight the key landslide hotspots, such as the Southeast Asia during the monsoon season in June through August and the U.S. Pacific Northwest in December and January.
Overlaid with these nowcasts values are a Global Landslide Catalog was developed with the goal of identifying rainfall-triggered landslide events around the world, regardless of size, impact, or location. The GLC considers all types of mass movements triggered by rainfall, which have been reported in the media, disaster databases, scientific reports, or other sources. The visualization shows the distribution of landslides each month based on the estimated number of fatalities the event caused. The GLC has been compiled since 2007 at NASA Goddard Space Flight Center and contains over 11,000 reports and growing. A new project called the Community the Cooperative Open Online Landslide Repository, or COOLR, provides the opportunity for the community to view landslide reports and contribute their own. The goal of the COOLR project is to create the largest global public online landslide catalog available and open to for anyone everyone to share, download, and analyze landslide information. More information on this system is available at: https://landslides.nasa.gov.
Landslides occur when an environmental trigger like an extreme rain event, often a severe storm or hurricane, and gravity's downward pull sets soil and rock in motion. Conditions beneath the surface are often unstable already, so the heavy rains act as the last straw that causes mud, rocks, or debris- or all combined- to move rapidly down mountains and hillsides. Unfortunately, people and property are often swept up in these unexpected mass movements. Landslides can also be caused by earthquakes, surface freezing and thawing, ice melt, the collapse of groundwater reservoirs, volcanic eruptions, and erosion at the base of a slope from the flow of river or ocean water. But torrential rains most commonly activate landslides. - Section
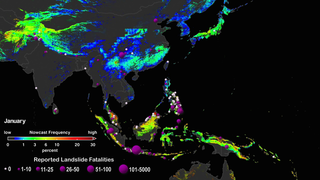
Landslide Climatology with Fatalities in Southeast Asia
Go to this sectionA new model has been developed to look at how potential landslide activity is changing around the world. A global Landslide Hazard Assessment model for Situational Awareness (LHASA) has been developed to provide an indication of where and when landslides may be likely around the world every 30min. This model uses surface susceptibility (including slope, vegetation, road networks, geology, and forest cover loss) and satellite rainfall data from the Global Precipitation Measurement (GPM) mission to provide moderate to high “nowcasts.” This visualization shows the landslide nowcast results leveraging nearly two decades of Tropical Rainfall Measurement Mission (TRMM) rainfall over 2001-2016 to identify a landslide climatology by month at a 1 km grid cell. The average nowcast values by month highlight the key landslide hotspots, such as the Southeast Asia during the monsoon season in June through August and the U.S. Pacific Northwest in December and January.
Overlaid with these nowcasts values are a Global Landslide Catalog was developed with the goal of identifying rainfall-triggered landslide events around the world, regardless of size, impact, or location. The GLC considers all types of mass movements triggered by rainfall, which have been reported in the media, disaster databases, scientific reports, or other sources. The visualization shows the distribution of landslides each month based on the estimated number of fatalities the event caused. The GLC has been compiled since 2007 at NASA Goddard Space Flight Center and contains over 11,000 reports and growing. A new project called the Community the Cooperative Open Online Landslide Repository, or COOLR, provides the opportunity for the community to view landslide reports and contribute their own. The goal of the COOLR project is to create the largest global public online landslide catalog available and open to for anyone everyone to share, download, and analyze landslide information. More information on this system is available at: https://landslides.nasa.gov.
Landslides occur when an environmental trigger like an extreme rain event, often a severe storm or hurricane, and gravity's downward pull sets soil and rock in motion. Conditions beneath the surface are often unstable already, so the heavy rains act as the last straw that causes mud, rocks, or debris- or all combined- to move rapidly down mountains and hillsides. Unfortunately, people and property are often swept up in these unexpected mass movements. Landslides can also be caused by earthquakes, surface freezing and thawing, ice melt, the collapse of groundwater reservoirs, volcanic eruptions, and erosion at the base of a slope from the flow of river or ocean water. But torrential rains most commonly activate landslides. 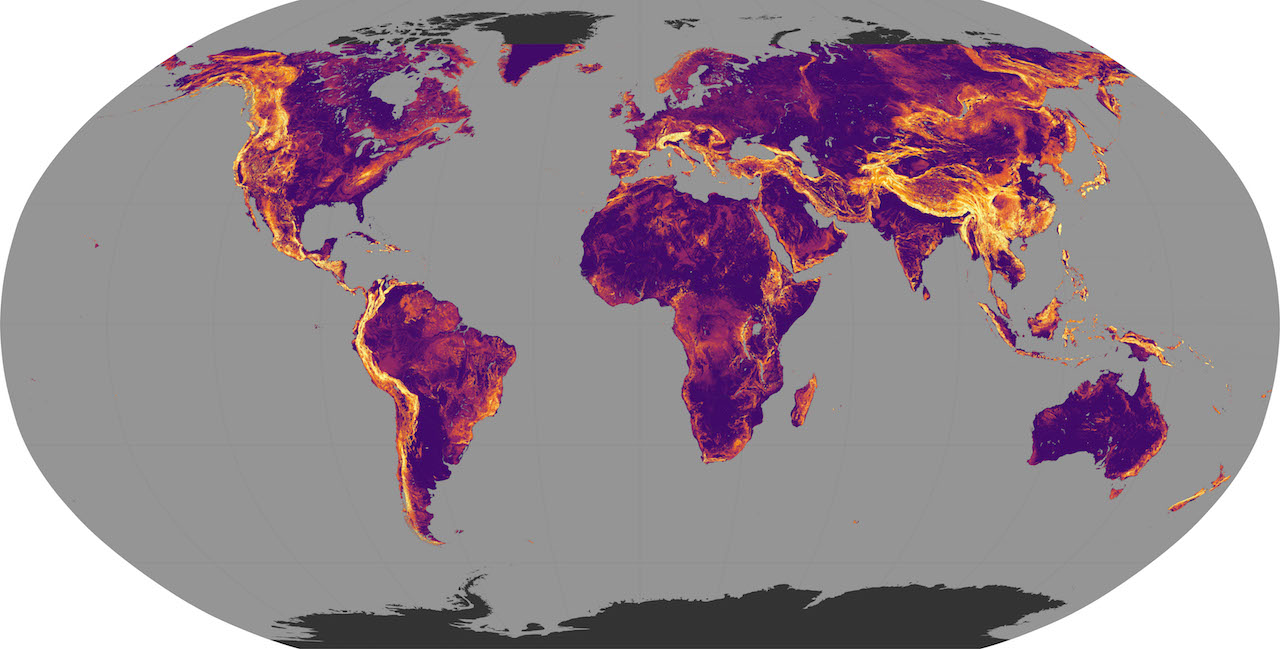 Link
LinkA Global View of Landslide Susceptibilty
By one estimate, landslides triggered by heavy rain kill roughly 4,600 people each year. Scientists at NASA and elsewhere are trying to find ways to reduce that number. Dalia Kirschbaum and Thomas Stanley have taken one step in that direction by developing a new map of global landslide susceptibility. The map is part of a broader effort to establish a hazards monitoring system that combines satellite observations of rainfall from the Global Precipitation Measurement (GPM) mission with an assessment of the underlying susceptibility of terrain. Steep slopes are the most important factor that make a landscape susceptible to landslides. Other key factors include deforestation, the presence of roads, the strength of bedrock and soils, and the location of faults. While other scientists have previously developed global and continental landslide susceptibility maps, Kirschbaum and Stanley used improved versions of certain datasets. They used a better version of elevation data collected by the Shuttle Radar Topography Mission. The forest loss information comes from a Landsat-based record of forest change compiled by a University of Maryland team. Neither dataset was available in 2007 when an earlier version of this map was published.
Go to this link- ID: 4631 Visualization
Global Landslide Hazard Assessment Model (LHASA) with Global Landslide Catalog (GLC) data
Go to this pageLandslides occur when an environmental trigger like an extreme rain event, often a severe storm or hurricane, and gravity's downward pull sets soil and rock in motion. Conditions beneath the surface are often unstable already, so the heavy rains act as the last straw that causes mud, rocks, or debris- or all combined- to move rapidly down mountains and hillsides. Unfortunately, people and property are often swept up in these unexpected mass movements. Landslides can also be caused by earthquakes, surface freezing and thawing, ice melt, the collapse of groundwater reservoirs, volcanic eruptions, and erosion at the base of a slope from the flow of river or ocean water. But torrential rains most commonly activate landslides. A new model has been developed to look at how potential landslide activity is changing around the world. A global Landslide Hazard Assessment model for Situational Awareness (LHASA) has been developed to provide an indication of where and when landslides may be likely around the world every 30min. This model uses surface susceptibility (including slope, vegetation, road networks, geology, and forest cover loss) and satellite rainfall data from the Global Precipitation Measurement (GPM) mission to provide moderate to high “nowcasts.” This visualization shows the landslide nowcast results leveraging nearly two decades of Tropical Rainfall Measurement Mission (TRMM) rainfall over 2001-2016 to identify a landslide climatology by month at a 1 km grid cell. The average nowcast values by month highlight the key landslide hotspots, such as the Southeast Asia during the monsoon season in June through August and the U.S. Pacific Northwest in December and January. Overlaid with these nowcasts values are a Global Landslide Catalog (GLC) was developed with the goal of identifying rainfall-triggered landslide events around the world, regardless of size, impact, or location. The GLC considers all types of mass movements triggered by rainfall, which have been reported in the media, disaster databases, scientific reports, or other sources. The visualization shows the distribution of landslides each month based on the estimated number of fatalities the event caused. The GLC has been compiled since 2007 at NASA Goddard Space Flight Center and contains over 11,000 reports and growing. A new project called the Community the Cooperative Open Online Landslide Repository, or COOLR, provides the opportunity for the community to view landslide reports and contribute their own. The goal of the COOLR project is to create the largest global public online landslide catalog available and open to for anyone everyone to share, download, and analyze landslide information. More information on this system is available at: https://landslides.nasa.govThe Global Landslide Catalog is currently available here: https://catalog.data.gov/dataset/global-landslide-catalog-export ||
- ID: 4633 Visualization
Landslide Activity in the Americas for the Cover of Earth's Future
Go to this pageA view of the potential landslide activity during January in the Americas, as evaluated by NASA's Landslide Hazard Assessment model for Situational Awareness (LHASA). This still image is provided in 300dpi (print resolution) and in separate layers (water, data, land, outlines). || ClimatologyJanuary_Cover_Light_Layers_Preview_print.jpg (1024x1024) [125.1 KB] || ClimatologyJanuary_Cover_Light_Layers_Preview.png (2550x2550) [2.5 MB] || ClimatologyJanuary_Cover_Light_Layers_Preview_searchweb.png (320x180) [34.2 KB] || ClimatologyJanuary_Cover_Light_Layers_Preview_thm.png (80x40) [3.4 KB] || ClimatologyJanuary_Cover_Light_Layers_300dpi.tif (2550x2550) [16.4 MB] ||
Additional Data Visualizations
- ID: 4409 Visualization
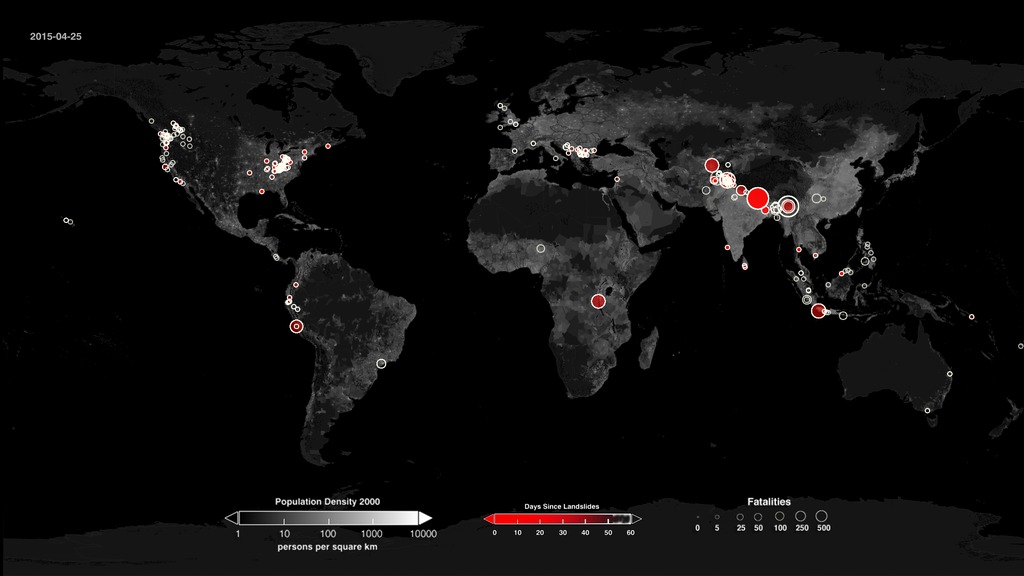
Global Rainfall-Triggered Landslides from 2007 through 2015
Go to this pageThis visualization shows rainfall-triggered landslides over population data from January 1, 2015 through Dec 3, 2015. April 25, 2015 the deadly Gorkha earthquake struck Nepal and caused a deadly landslide that killed an additional 60 people. || redRainfallTriggered_0552_print.jpg (1024x576) [77.8 KB] || redRainfallTriggered_0552_searchweb.png (320x180) [35.0 KB] || redRainfallTriggered_0552_thm.png (80x40) [4.0 KB] || redRainfallTriggeredSlides_throughDec.mp4 (1920x1080) [1.8 MB] || composite (1920x1080) [0 Item(s)] || redRainfallTriggeredSlides_throughDec.webm (1920x1080) [1.8 MB] || redRainfallTriggeredSlides_throughDec.mp4.hwshow [203 bytes] ||
- ID: 4304 Visualization
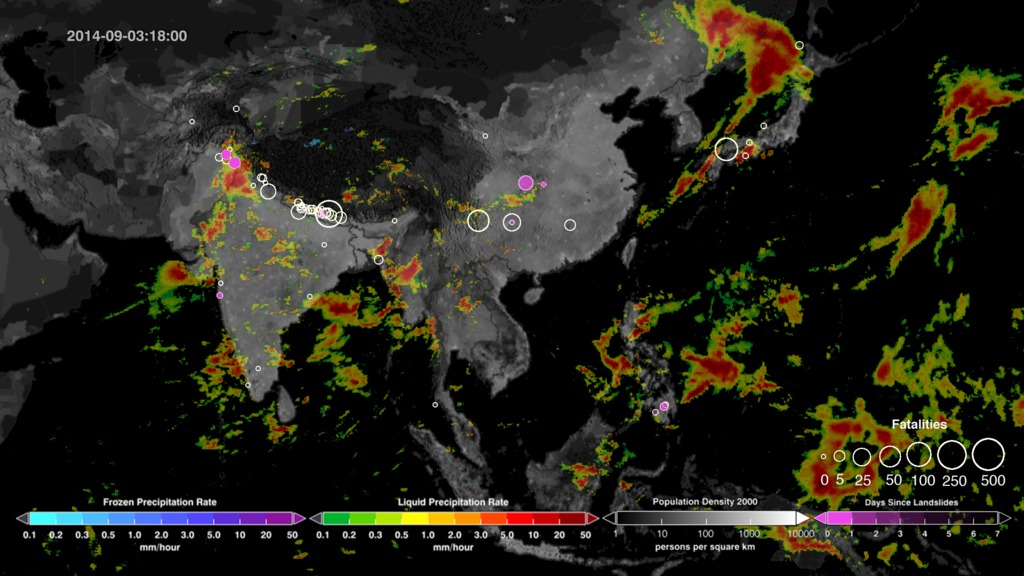
Global Rainfall-Triggered Landslides and Global Precipitation from IMERG
Go to this pageThis visualization shows rainfall-triggered landslides and precipitation from August and September of 2014 in Asia and the Himalayan Arc. || AsianLandslides_Precip_Population_1620_print.jpg (1024x576) [161.5 KB] || AsianLandslides_Precip_Population_1620_searchweb.png (180x320) [81.7 KB] || AsianLandslides_Precip_Population_1620_thm.png (80x40) [7.3 KB] || AsianRainfall-TriggeredLandslides.mp4 (1920x1080) [92.0 MB] || india (1920x1080) [0 Item(s)] || asian (1920x1080) [0 Item(s)] || AsianLandslides_Precip_Population_1620.tif (1920x1080) [7.9 MB] || AsianRainfall-TriggeredLandslides.webm (1920x1080) [19.4 MB] || AsianRainfall-TriggeredLandslides.wmv (1920x1080) [117.3 MB] || AsianRainfall-TriggeredLandslides_Precip_Population.m4v (640x360) [17.5 MB] ||
- ID: 4285 Visualization
Near Real-Time Global Precipitation from the Global Precipitation Measurement Constellation
Go to this pageAn animation of the most currently available global precipitation data from IMERG.
- ID: 4257 Visualization
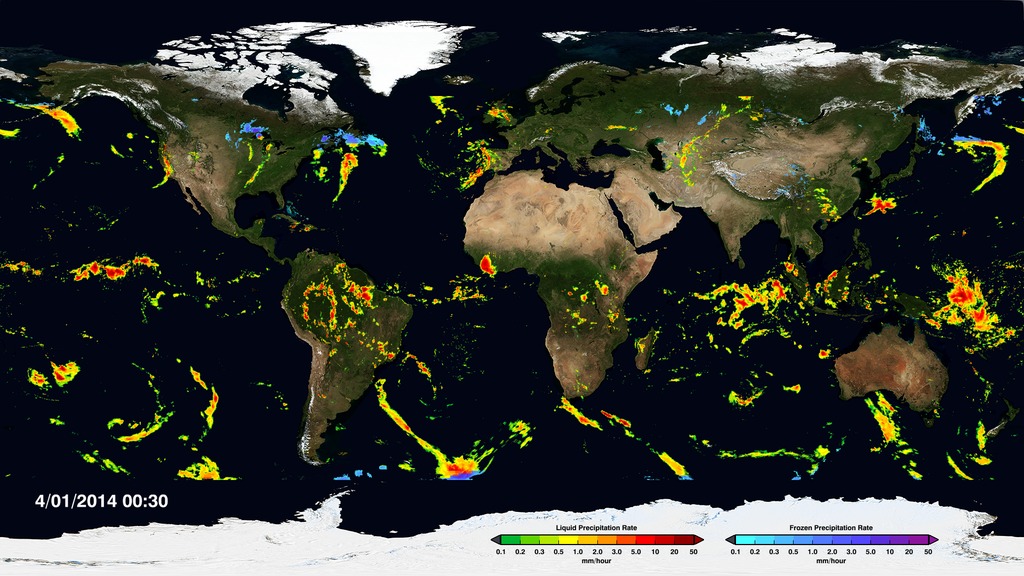
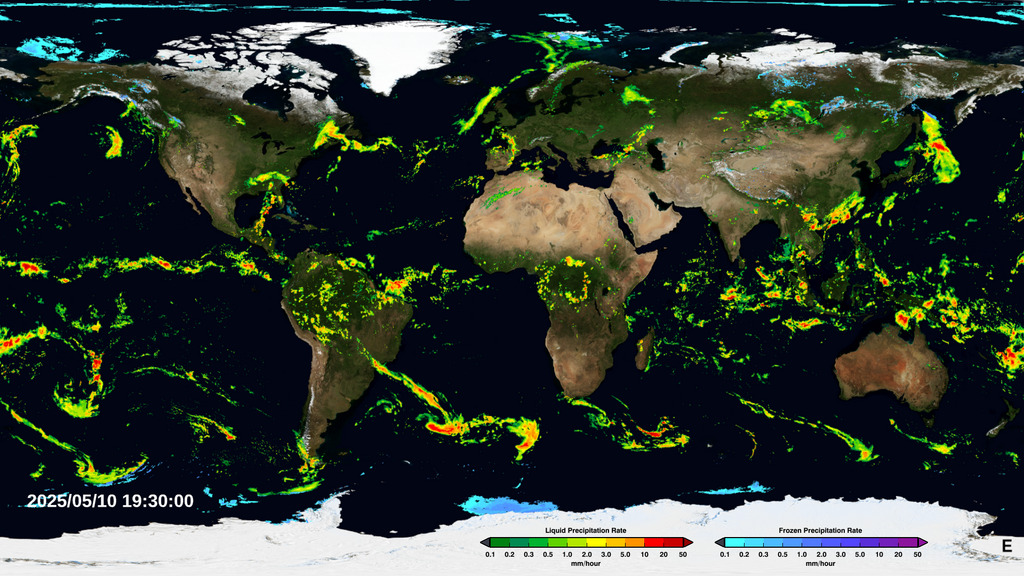
IMERG Global Precipitation Rates
Go to this pageAnimation of IMERG precipitation rates from 4/1/2014 through 9/30/2014 || imerg.00000_print.jpg (1024x576) [204.6 KB] || world.200406.3x3600x1800.png (3600x1800) [4.3 MB] || imerg.00000_searchweb.png (320x180) [86.7 KB] || imerg.00000_web.png (320x180) [86.7 KB] || imerg.00000_thm.png (80x40) [7.4 KB] || annotated (1920x1080) [0 Item(s)] || imerg_1920x1080.webm (1920x1080) [73.5 MB] || imerg_annotated_960x540_30p.mp4 (960x540) [185.2 MB] || imerg_1920x1080.mp4 (1920x1080) [341.4 MB] || first_global_rainfall_snowfall_map_4257.key [346.6 MB] || first_global_rainfall_snowfall_map_4257.pptx [343.6 MB] ||
- ID: 4397 Visualization
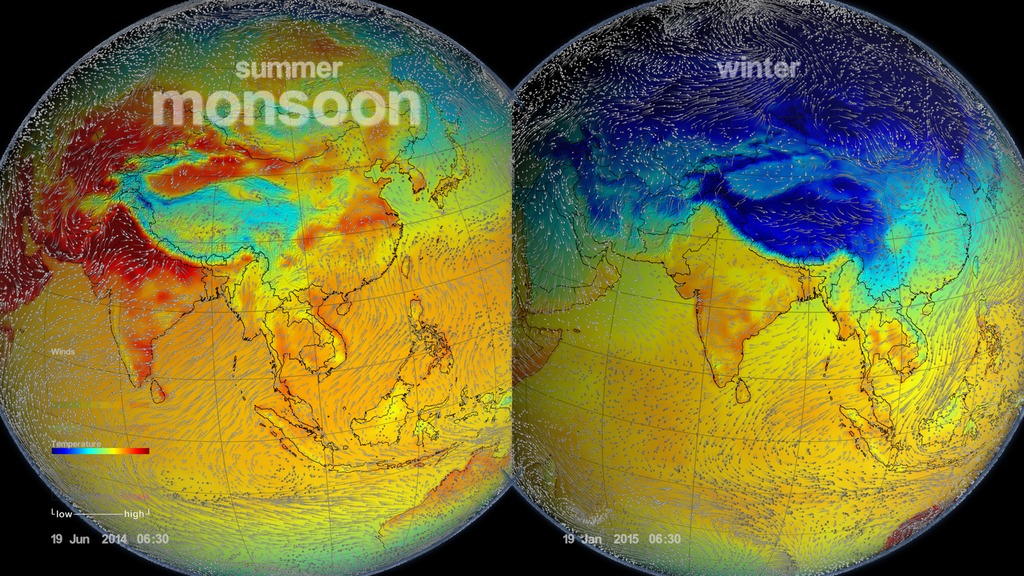
Monsoons: Wet, Dry, Repeat...
Go to this pageThis visualization shows the Asian monsoon and how it develops using observational and modeled data. It also showns some of the impacts.This video is also available on our YouTube channel. || monsoon_final_HD01.02500_print.jpg (1024x576) [182.2 KB] || final (1920x1080) [1.0 MB] || Monsoon_narrated_19201080p30.webm (1920x1080) [29.6 MB] || Monsoon_narrated_640x360p30.m4v (640x360) [43.4 MB] || monsoon_final_HD01_640x360_noNarration.m4v (640x360) [37.2 MB] || 3840x2160_16x9_60p (3840x2160) [1.0 MB] || monsoonnarrfull.en_US.srt [4.9 KB] || monsoonnarrfull.en_US.vtt [4.9 KB] || Monsoon_narrated_19201080p30.mp4 (1920x1080) [512.5 MB] || Monsoon_narrated_1920x1080p60_prores.mov (1920x1080) [7.3 GB] || monsoon_final_1920x1080p60_noNarration.mp4 (1920x1080) [387.4 MB] || monsoon_final_4kp30_noNarration.mp4 (3840x2160) [1.2 GB] ||
- ID: 4294 Visualization
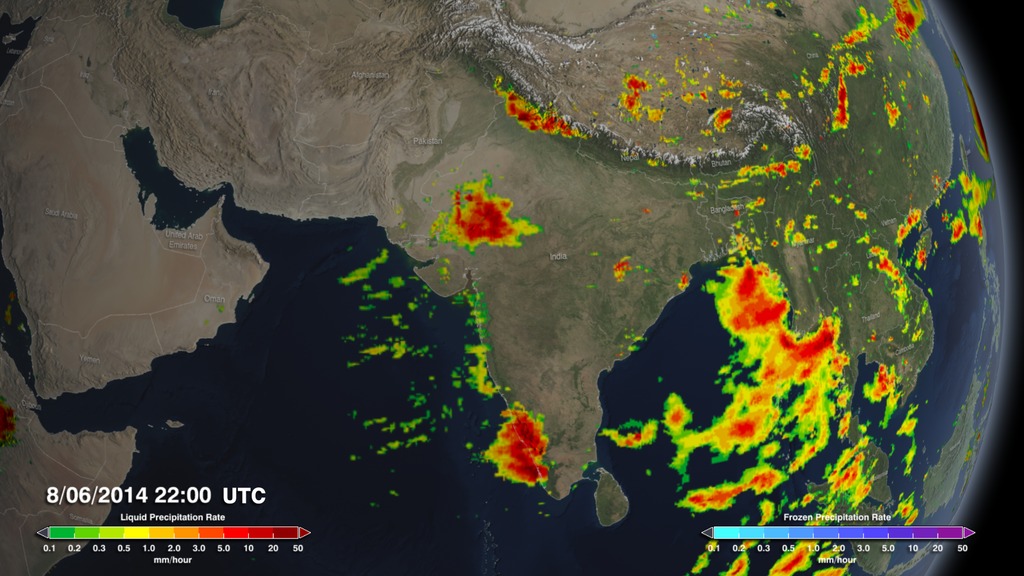
IMERG Precipitation Rates Across India's Ghats Mountains
Go to this pageAnimation of precipitation rates across India and surrounding countries. Notice the heavy rains throughout the Ghats Mountain range which resulted in devastating landslides along India's west coast. || ghats_w_dates.0140_print.jpg (1024x576) [169.8 KB] || ghats_w_dates.0140_print_thm.png (80x40) [7.5 KB] || ghats_w_dates.0140_searchweb.png (320x180) [99.4 KB] || ghats_dated_1080p30.mp4 (1920x1080) [20.9 MB] || Ghats_with_dates (1920x1080) [0 Item(s)] || ghats2.mp4 (1920x1080) [21.0 MB] || Ghats_without_dates (1920x1080) [0 Item(s)] || ghats_dated_1080p30.webm (1920x1080) [2.8 MB] || date_overlay (350x80) [0 Item(s)] ||
- ID: 3971 Visualization
Global Precipitation Measurement (GPM) Constellation
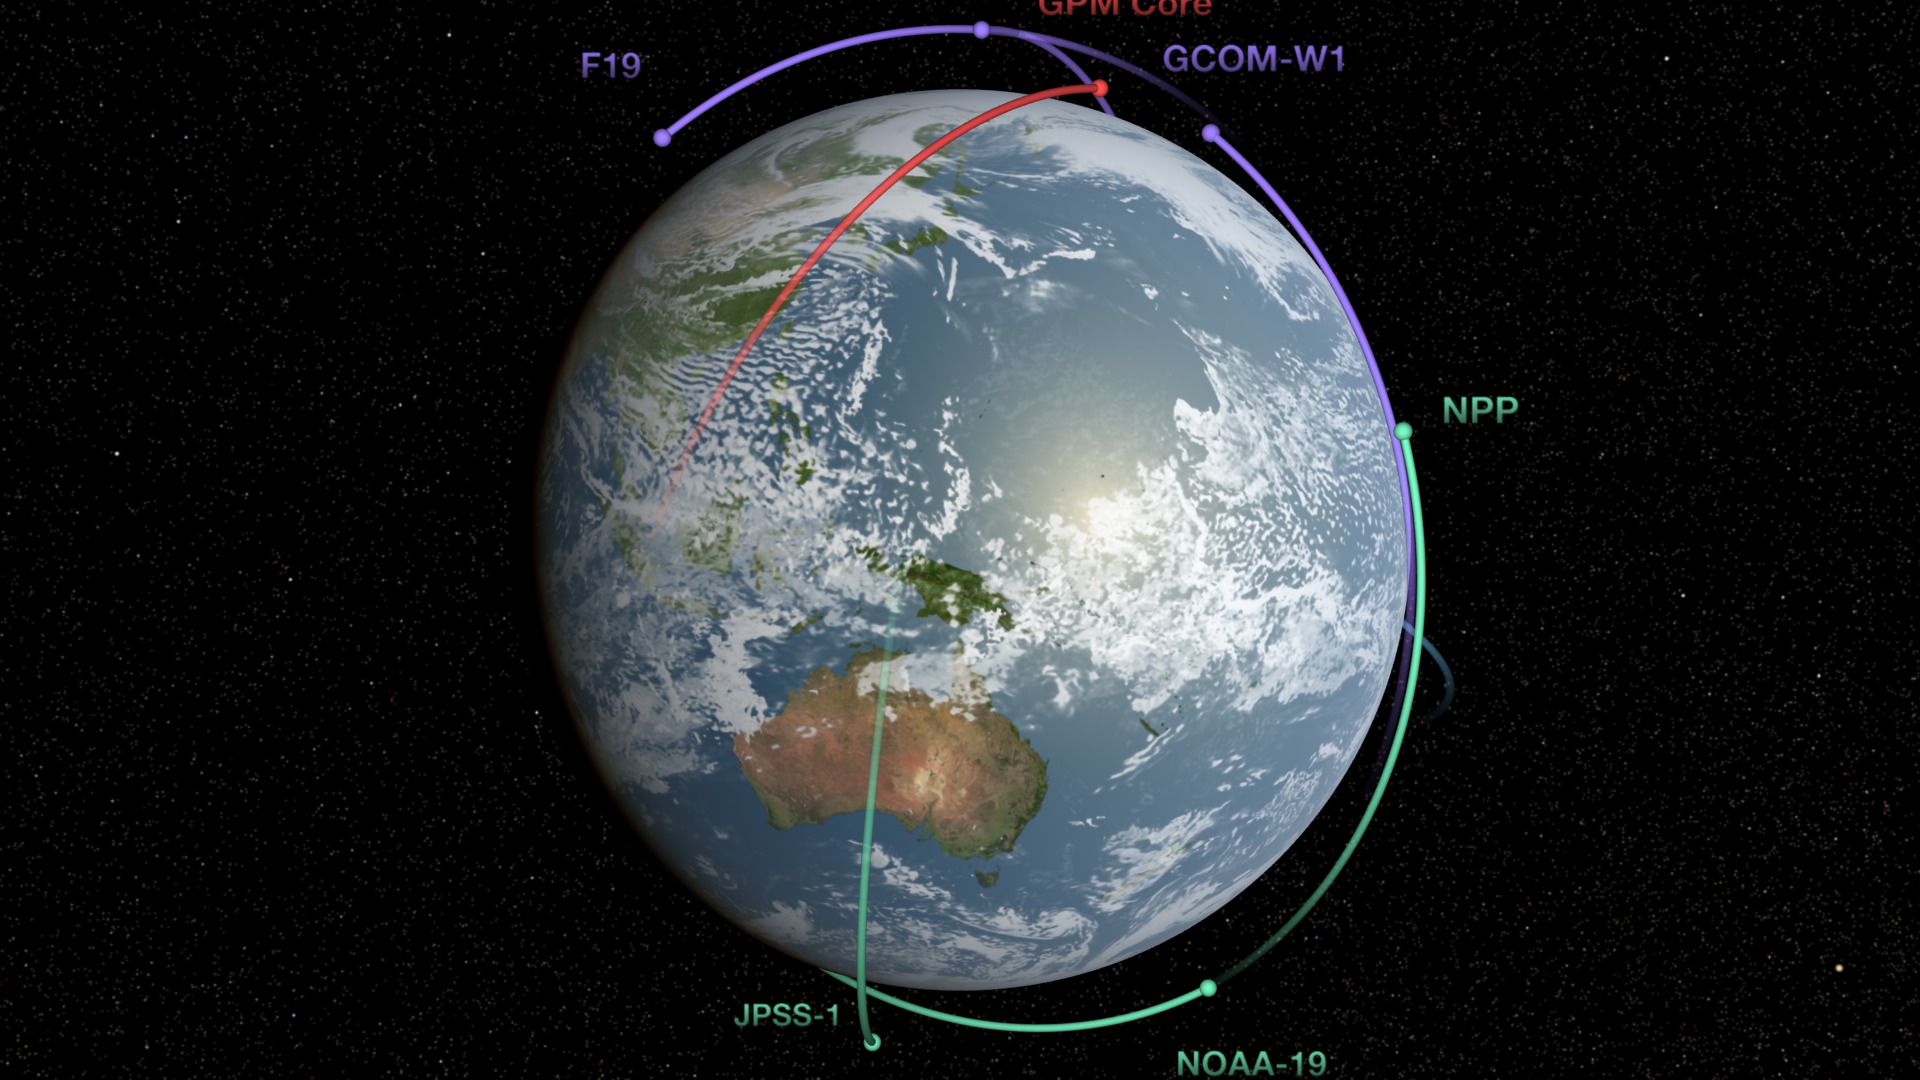
Go to this pageNine U.S. and international satellites will soon be united by the Global Precipitation Measurement (GPM) mission, a partnership co-led by NASA and the Japan Aerospace Exploration Agency (JAXA). NASA and JAXA will provide the GPM Core satellite to serve as a reference for precipitation measurements made by this constellation of satellites, which will be combined into a single global dataset continually refreshed every three hours. While each partner satellite has its own mission objective, they all carry a type of instrument called a radiometer that measures radiated energy from rainfall and snowfall. The GPM Core satellite carries two instruments: a state-of-the-art radiometer called the GPM Microwave Imager (GMI) and the first space-borne Dual-frequency Precipitation Radar (DPR), which sees the 3D structure of falling rain and snow. The DPR and GMI work in concert to provide a unique database that will be used to improve the accuracy and consistency of measurements from all partner satellites, which will then be combined into the uniform global precipitation dataset. In this animation the orbit paths of the partner satellites of the GPM constellation fill in blue as the instruments pass over Earth. Rainfall appears light blue for light rain, yellow for moderate, and red for heavy rain. Partner satellites are traced in green and purple, and the GPM Core is traced in red. The GPM Core observatory is currently being built and tested at NASA's Goddard Space Flight Center in Greenbelt, Md. It is scheduled to launch from Tanegashima space center in Japan in early 2014. ||
- ID: 4016 Visualization
Global Precipitiation Measurement Core Satellite Instruments
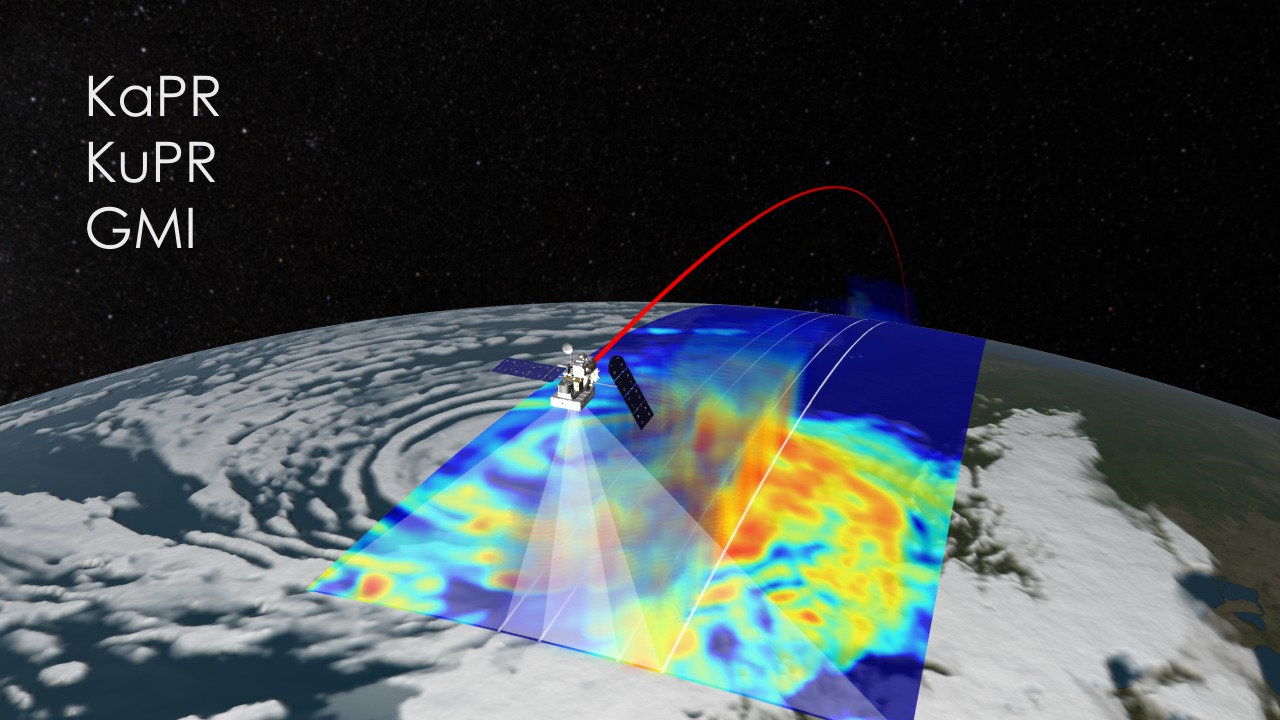
Go to this pageThe Global Precipitation Measurement (GPM) mission is co-led by NASA and the Japan Aerospace Exploration Agency (JAXA). NASA and JAXA will provide a GPM Core satellite to serve as a reference for precipitation measurements made by a constellation of satellites. The GPM Core satellite carries two instruments: a state-of-the-art radiometer called the GPM Microwave Imager (GMI) and the first space-borne Dual-frequency Precipitation Radar (DPR), which sees the 3D structure of falling rain and snow. The DPR and GMI work in concert to provide a unique database that will be used to improve the accuracy and consistency of measurements from all partner satellites, which will then be combined into the uniform global precipitation dataset. This animation shows the scanning capabilities of the GMI and DPR onboard the GPM Core satellite. Heavy rainfall is shown in red and light rainfall in blue. The DPR shows 3D precipitation in a midlatitude storm from two overlapping swaths. The Ka-band frequency scans across a region of 78 miles (125 kilometers) and is nested within the wider scan of the Ku-band frequency of 147 miles (245 kilometers). JAXA and Japan's National Institute of Information and Communications Technology (NICT) built the DPR. The GMI, shown as the flat precipitation values, constantly scans a region 550 miles (885 kilometers) across. The Ball Aerospace and Technology Corporation built the GMI under contract with NASA Goddard Space Flight Center. The GPM Core observatory is currently being built and tested at NASA's Goddard Space Flight Center in Greenbelt, Md. It is scheduled to launch from Tanegashima space center in Japan in early 2014. ||
Animations
- ID: 20226 Animation
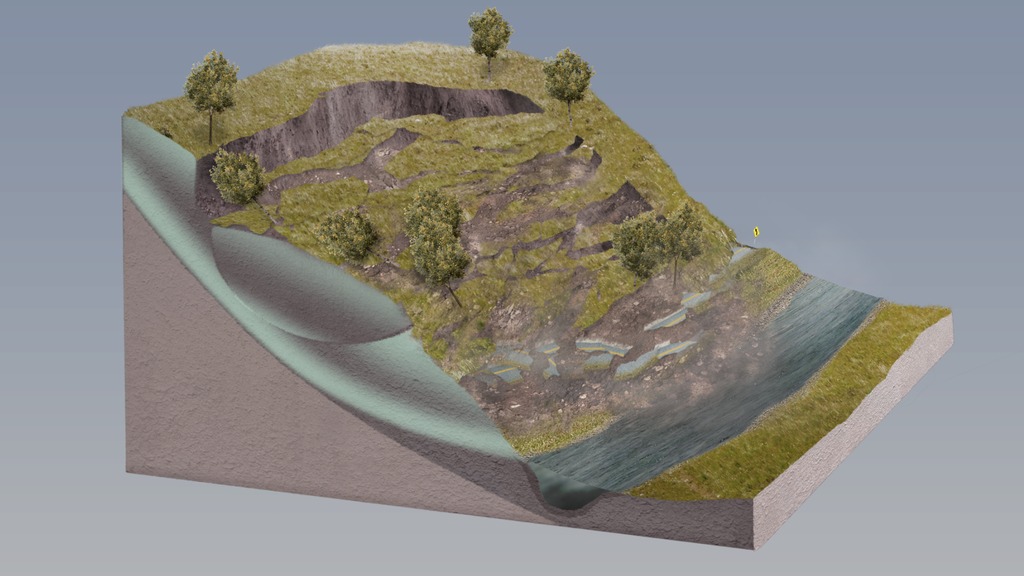
Landslide Animation
Go to this pageLandslide animation - rotational landslide. || landslide_seq_00660_print.jpg (1024x576) [113.4 KB] || landslide_seq_00660_searchweb.png (320x180) [59.1 KB] || landslide_seq_00660_thm.png (80x40) [5.0 KB] || Landslide_final_59fps_prores.webm (1920x1080) [1.8 MB] || 1920x1080_16x9_60p (1920x1080) [128.0 KB] || Landslide_final_59fps_h264.mov (1920x1080) [605.4 MB] || Landslide_final_59fps_prores.mov (1920x1080) [907.5 MB] || landslide.mp4 (1920x1080) [14.9 MB] ||
- ID: 11392 Produced Video
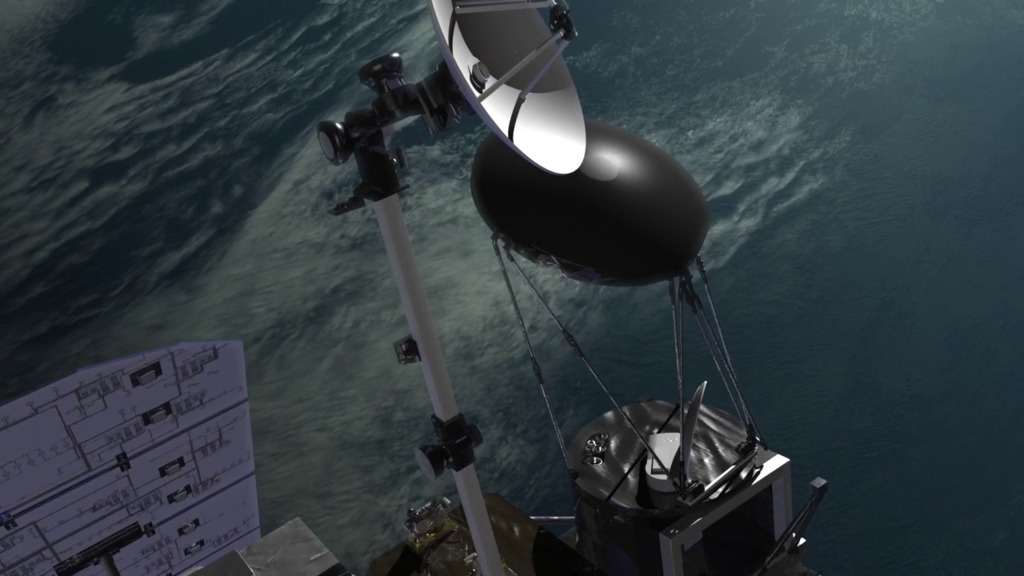
GPM Core Spacecraft Beauty Passes
Go to this pageA variety of animated beauty passes of the Global Precipitation Measurement (GPM) Core spacecraft. ||
- ID: 11253 Produced Video

GPM Instrument Animations
Go to this pageThis conceptual animation shows the GPM Microwave Imager (GMI) and the Dual-frequency Precipitation Radar (DPR) scanning through a cloud detecting various precipitation particles. ||