Beauty Pieces
Overview
TBD
Visualizations
- Section
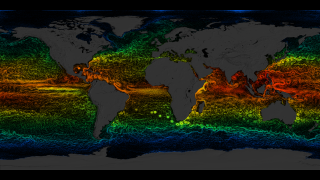
Global Sea Surface Currents and Temperature
Go to this sectionThis visualization shows sea surface current flows. The flows are colored by corresponding sea surface temperature data. This visualization is rendered for display on very high resolution devices like hyperwalls or for print media.This visualization was produced using model output from the joint MIT/JPL project entitled Estimating the Circulation and Climate of the Ocean, Phase II (ECCO2). ECCO2 uses the MIT general circulation model (MITgcm) to synthesize satellite and in-situ data of the global ocean and sea-ice at resolutions that begin to resolve ocean eddies and other narrow current systems, which transport heat and carbon in the oceans. The ECCO2 model simulates ocean flows at all depths, but only surface flows are used in this visualization.
- ID: 4993 Visualization
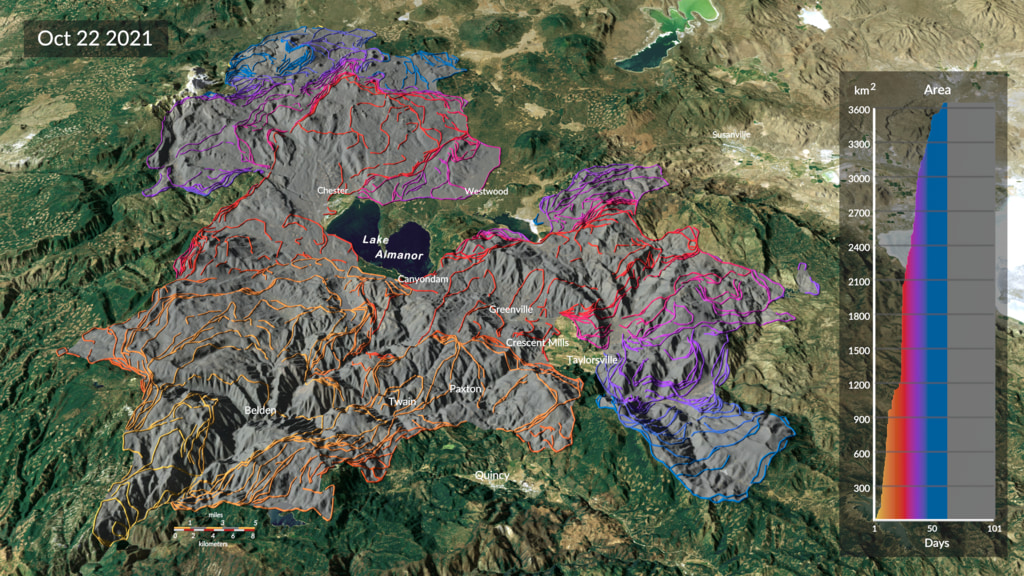
Spread of the Dixie Fire - 2021
Go to this pageThis visualization shows the spread of the Dixie fire between July 14 and October 22, 2021, updated every 12 hours based on new satellite active fire detections. The yellow outlines track the position of the active fire lines for the last 60 hours, with the latest location of the fire front in the brightest shade of yellow. The red points show the location of active fire detections, while the grey region shows the estimated total area burned. The graph shows the cumulative burned area in square kilometers.Coming soon to our YouTube channel. || Dixie_fire_2021.7135_print.jpg (1024x576) [369.5 KB] || Dixie_fire_2021.7135_searchweb.png (320x180) [139.8 KB] || Dixie_fire_2021.7135_thm.png (80x40) [8.3 KB] || Dixie_fire_2021_p30_1080p30.mp4 (1920x1080) [172.9 MB] || Dixie_fire_2021_1080p60.mp4 (1920x1080) [190.8 MB] || 3840x2160_16x9_60p (3840x2160) [0 Item(s)] || captions_silent.32827.en_US.srt [43 bytes] || Dixie_fire_2021_p30_2160p30.mp4 (3840x2160) [477.6 MB] || Dixie_fire_2021_2160p60.mp4 (3840x2160) [513.8 MB] || Dixie_fire_2021_p30_1080p30.mp4.hwshow || Dixie_fire_animation_only_2021_1080p60.hwshow ||
- ID: 4950 Visualization
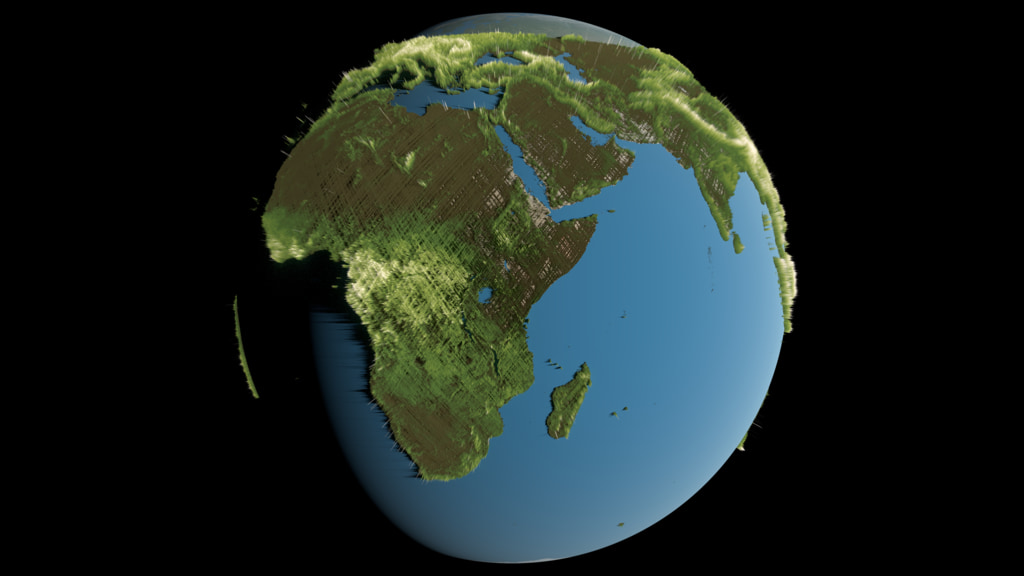
GEDI Forest Height
Go to this pageThis visualization depicts a global view of forest height data collected by the GEDI instrument aboard the International Space Station. Brown and dark green represent shorter vegetation. Bright green and white represent taller vegetation. This visualization uses data collected between April 2019 and April 2020. Height is exaggerated to depict variation at this scale.Coming soon to our YouTube channel. || GEDI_global_w_colorbar_0900_print.jpg (1024x576) [83.4 KB] || GEDI_global_w_colorbar_0900_searchweb.png (320x180) [42.8 KB] || GEDI_global_w_colorbar_0900_thm.png (80x40) [4.0 KB] || GEDI_global_w_colorbar_1080p60.mp4 (1920x1080) [17.7 MB] || GEDI_global_w_colorbar_1080p60.webm (1920x1080) [6.0 MB] || GEDI_global_w_colorbar (3840x2160) [0 Item(s)] || GEDI_global_w_colorbar_2160p30.mp4 (3840x2160) [61.5 MB] || GEDI_global_w_colorbar_2160p60.mp4 (3840x2160) [65.5 MB] || captions_silent.31845.en_US.srt [43 bytes] ||
- ID: 4960 Visualization
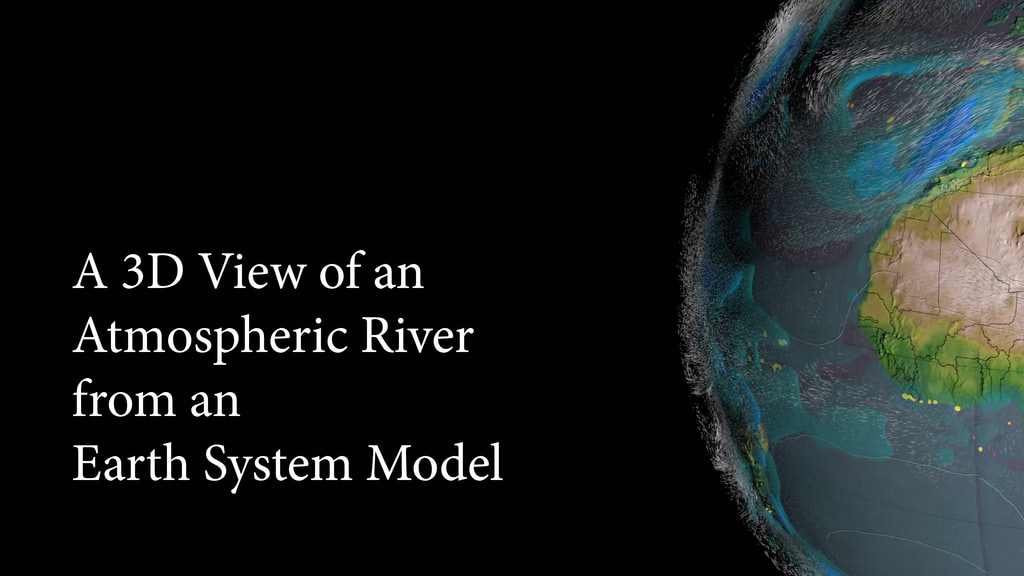
A 3D View of an Atmospheric River from an Earth System Model
Go to this pageNarrated atmospheric rivers movie. || atmos_rivers_narrated_4k.00090_print.jpg (1024x576) [88.5 KB] || atmos_rivers_narrated_4k.00090_print_searchweb.png (320x180) [46.0 KB] || atmos_rivers_narrated_HD.webm (1920x1080) [68.6 MB] || atmos_rivers_narrated_HD.mp4 (1920x1080) [410.9 MB] || atmos_river_narrated_4k.en_US.srt [6.3 KB] || atmos_river_narrated_4k.en_US.vtt [6.3 KB] || atmos_rivers_4k.en_US.vtt [6.3 KB] || atmos_rivers_narrated_4k.mp4 (3840x2160) [646.9 MB] ||