Applied Science
Overview
Discovering innovative and practical uses of Earth observations
Overview
NASA’s fleet of satellites provide freely-available information about Earth’s land, water, and environment.
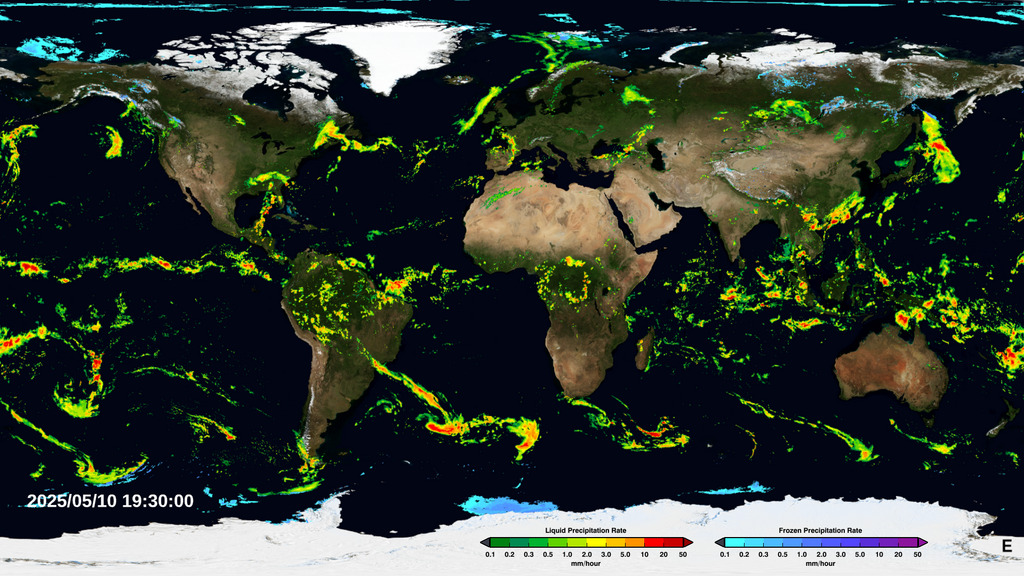
- ID: 30496 Hyperwall Visual
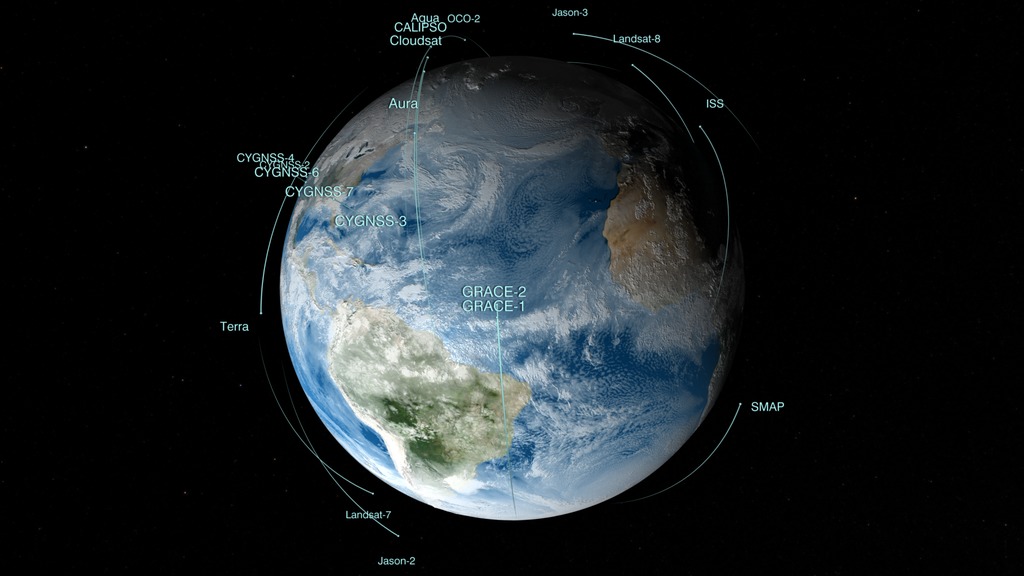
Earth Observing Fleet
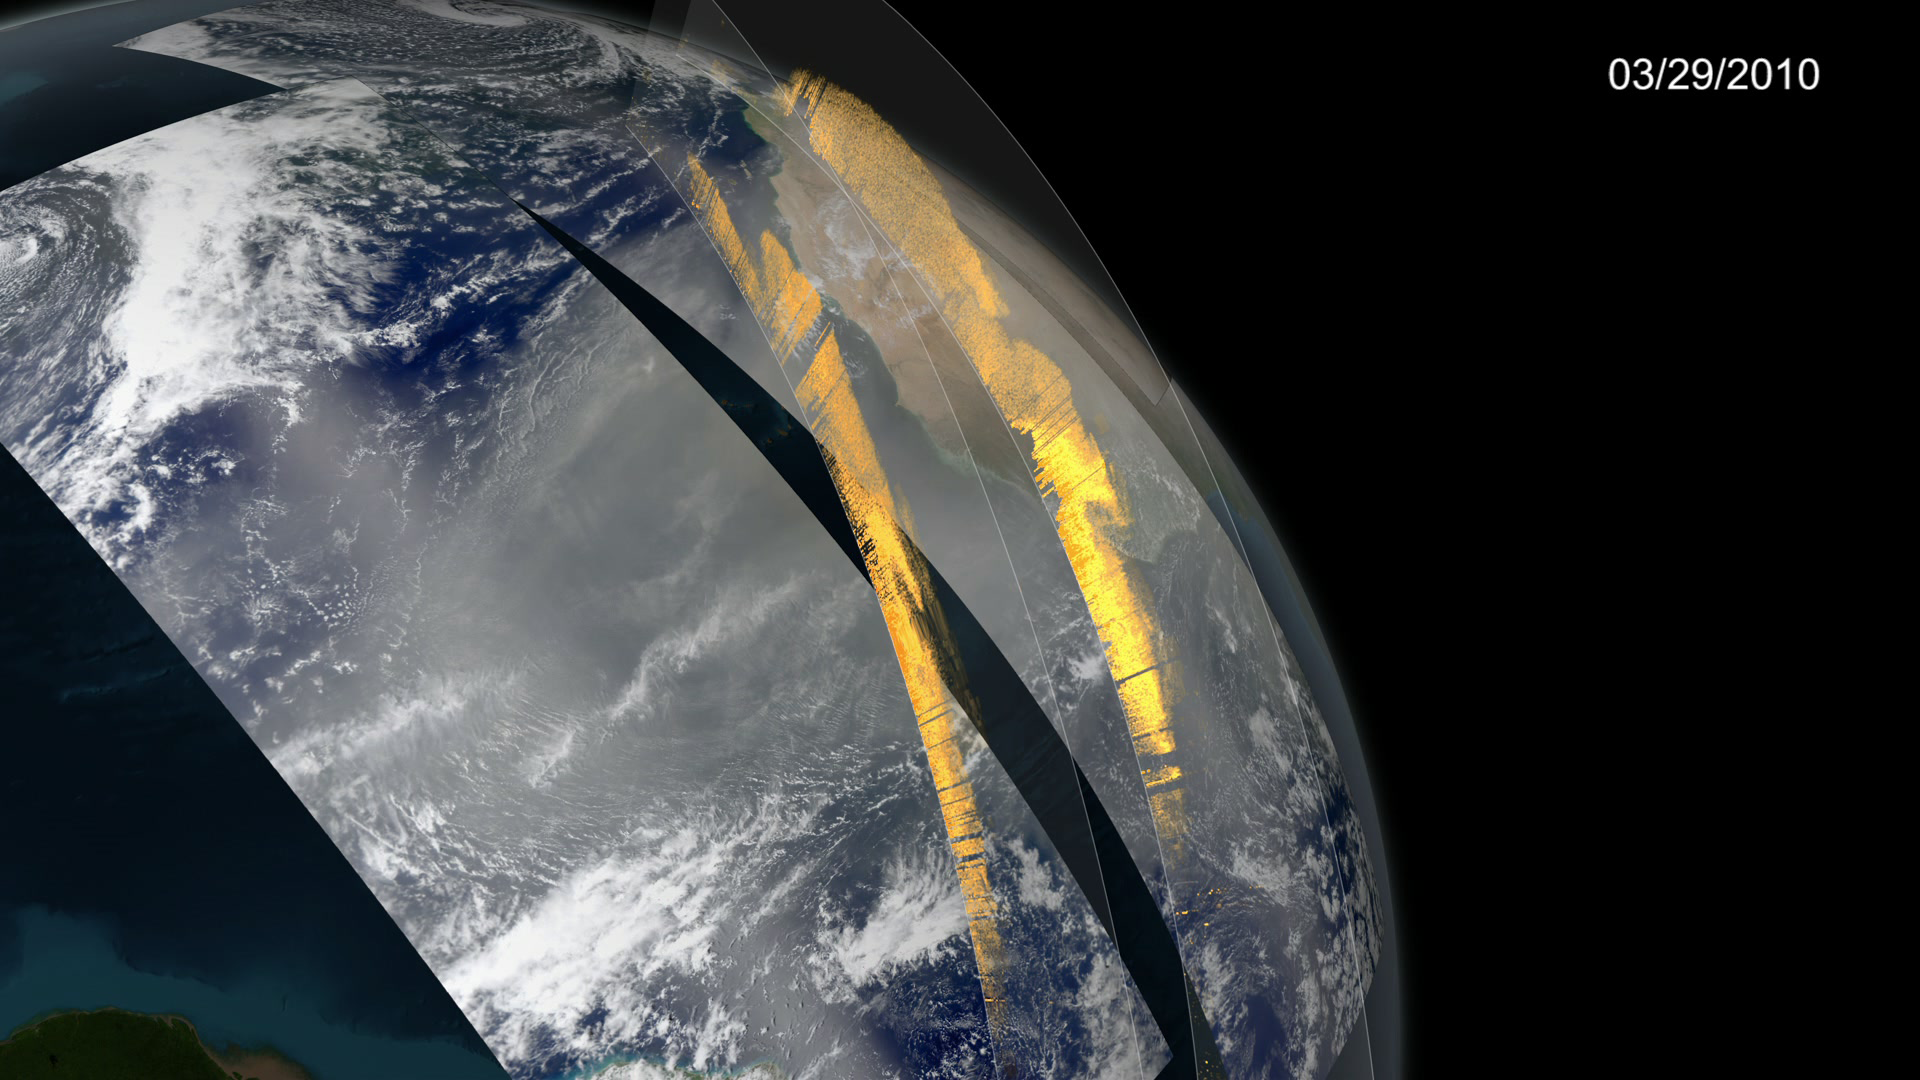
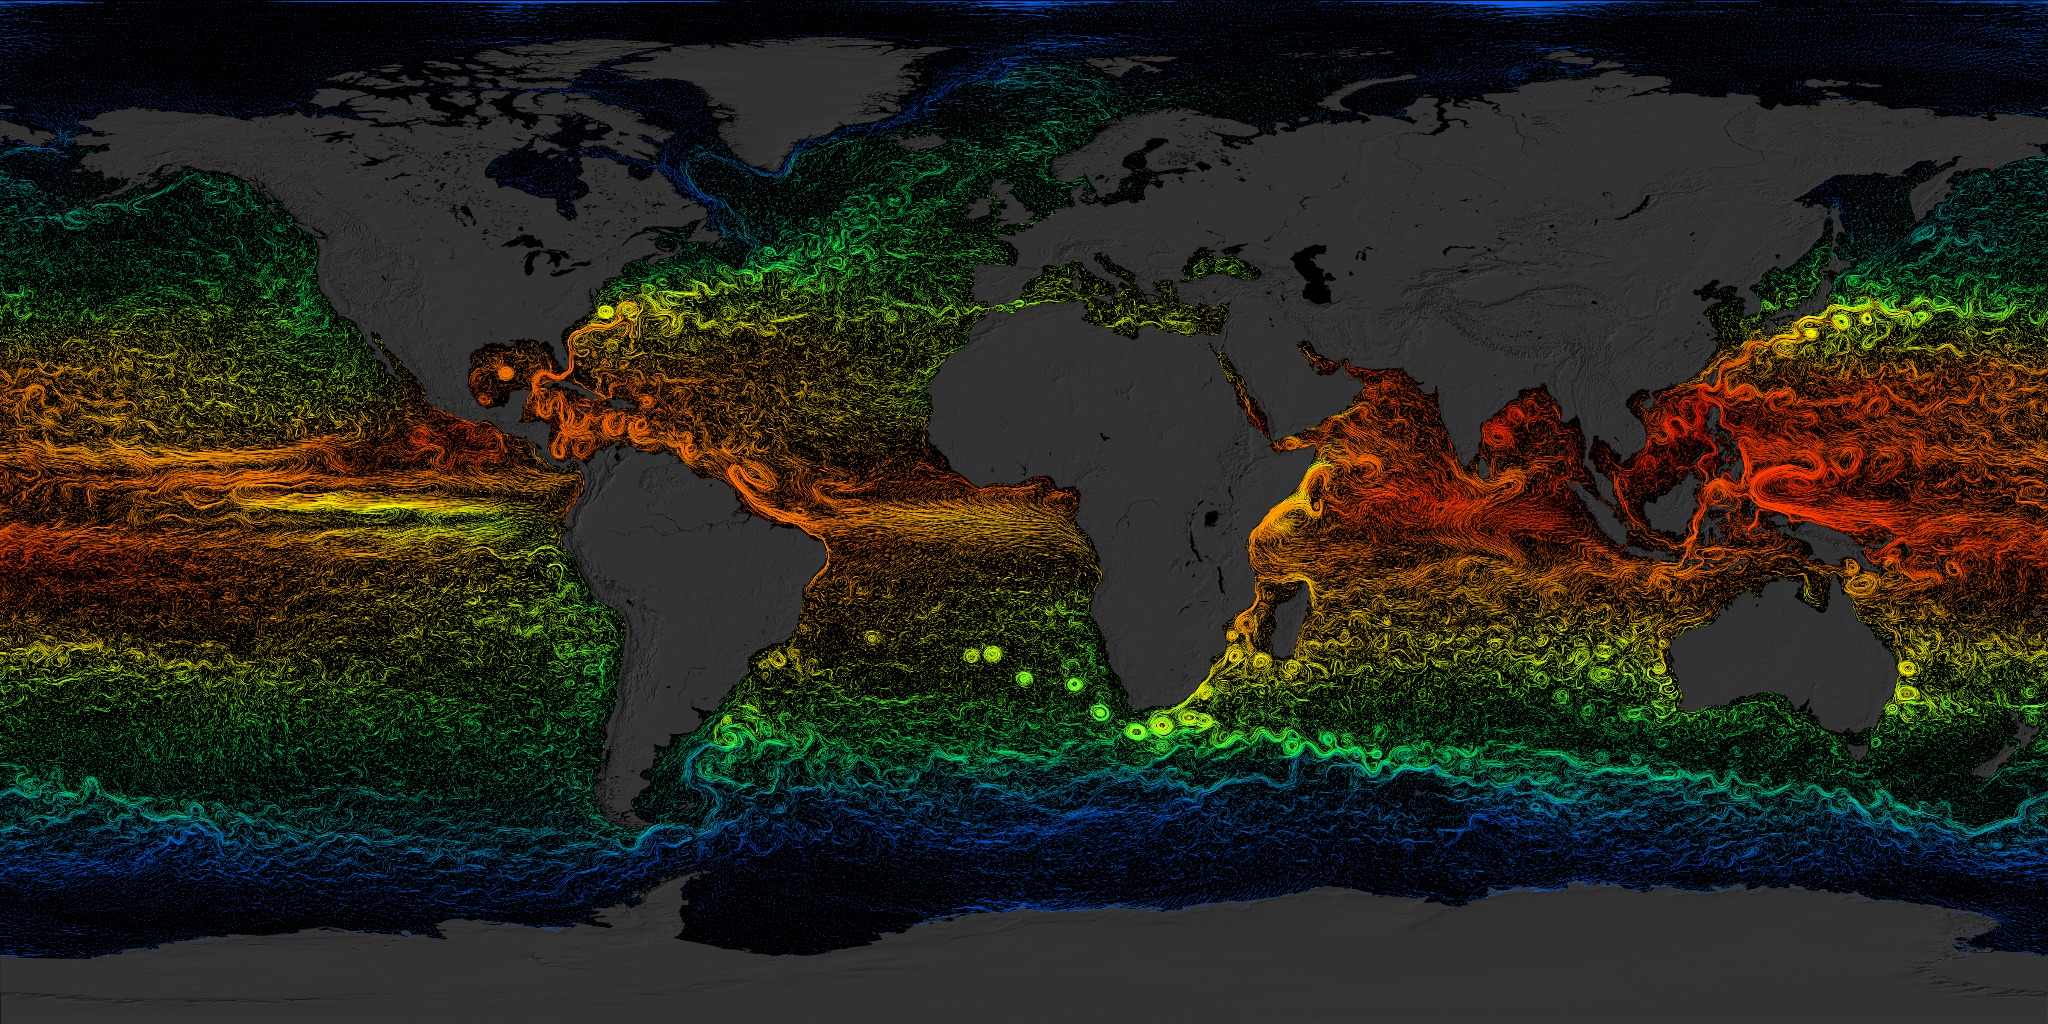
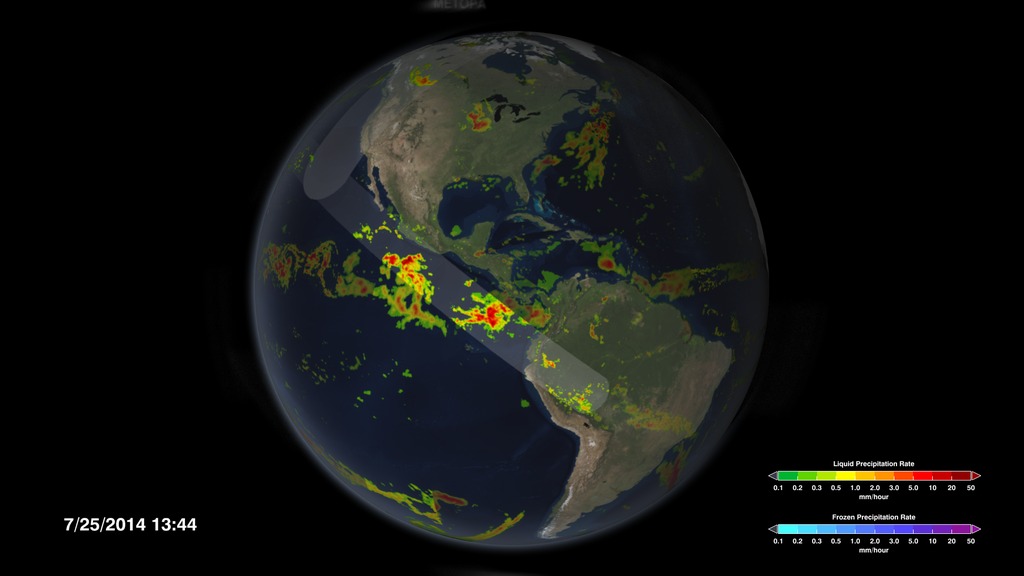
Go to this pageLike orbiting sentinels, NASA’s Earth-observing satellites vigilantly monitor our planet’s ever-changing pulse from their unique vantage points in orbit. This animation shows the orbits of all of the current satellite missions. The flight paths are based on actual orbital elements. These missions—many joint with other nations and/or agencies—are able to collect global measurements of rainfall, solar irradiance, clouds, sea surface height, ocean salinity, and other aspects of the environment. Together, these measurements help scientists better diagnose the “health” of the Earth system.This animation will be regularly updated to show the orbits of the current earth observing fleet. This most recent version, published in March 2017, includes the CYGNSS constellation and DSCOVR at L1. Visit the original page here.Previous versions from recent years include:entry 4274 a February 2015 version including SMAPentry 3996 a spring 2014 version including GPM entry 4070 a May 2013 version which added Landsat-8entry 3892 a Dec 2011 version which added Suomi NPP and Aquariusentry 3725 a version from June 2010 ||
- ID: 30763 Hyperwall Visual
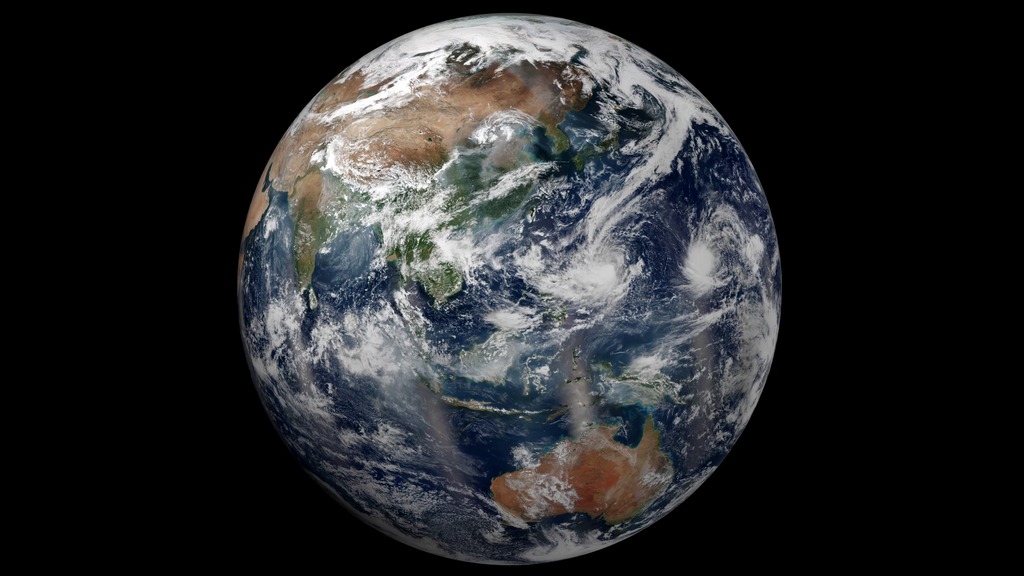
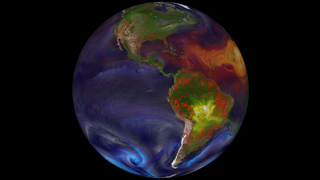
Blue Marble 2015
Go to this pageThe Blue Marble, October 2015 || R_earth_viirs_1080p.00001_print.jpg (1024x576) [117.4 KB] || R_earth_viirs_1080p.00001_searchweb.png (180x320) [56.3 KB] || R_earth_viirs_1080p.00001_thm.png (80x40) [4.3 KB] || R_earth_viirs_1080p.mp4 (1920x1080) [20.1 MB] || R_earth_viirs_720p.mp4 (1280x720) [11.0 MB] || R_earth_viirs_720p.webm (1280x720) [5.3 MB] || R_Earth_fast_2304p.mp4 (4096x2304) [52.5 MB] || R_earth_viirs_360p.mp4 (640x360) [3.6 MB] || fast (4104x2304) [32.0 KB] || R_earth_viirs_4k.mp4 (4104x2304) [52.5 MB] ||
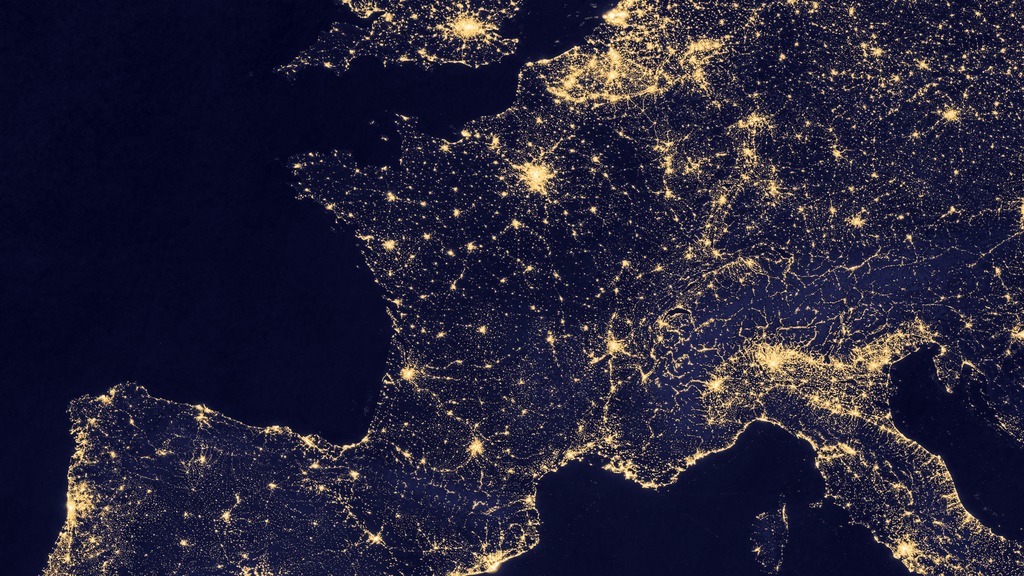
- ID: 30082 Hyperwall Visual
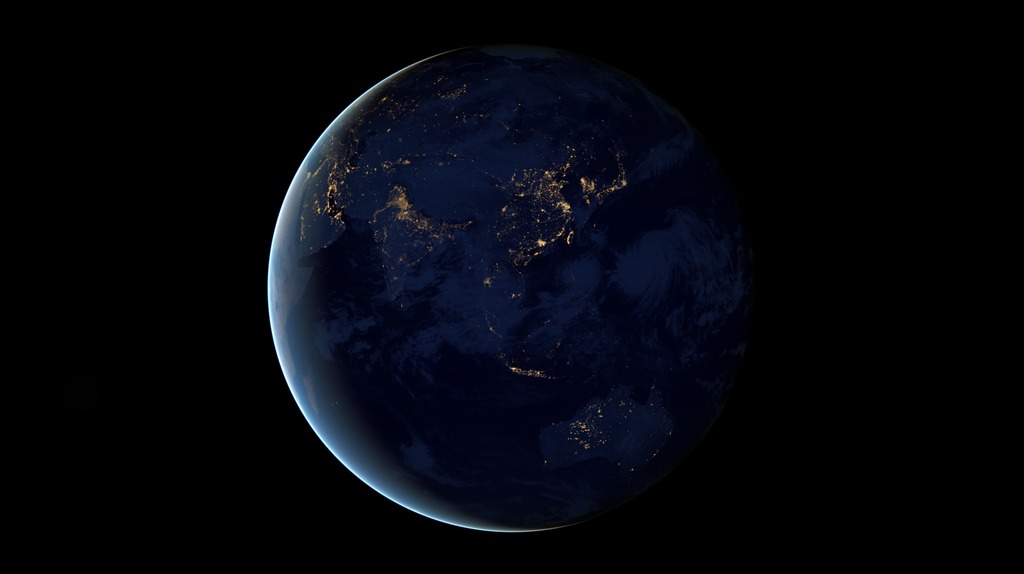
Rotating Earth at Night
Go to this pageThis new space-based view of Earth’s city lights is a composite assembled from data acquired by the Suomi National Polar-orbiting Partnership (Suomi NPP) satellite. The data was acquired over nine days in April 2012 and thirteen days in October 2012. It took the satellite 312 orbits and 2.5 terabytes of data to get a clear shot of every parcel of Earth’s land surface and islands. This new data was then mapped over existing MODIS Blue Marble imagery to provide a realistic view of the planet. The view was made possible by the “day-night band” of Suomi NPP’s Visible Infrared Imaging Radiometer Suite. VIIRS detects light in a range of wavelengths from green to near-infrared and uses “smart” light sensors to observe dim signals such as city lights, auroras, wildfires, and reflected moonlight. This low-light sensor can distinguish night lights tens to hundreds of times better than previous satellites. ||
- ID: 30065 Hyperwall Visual

NASA Earth Science Division Missions
Go to this pageIn order to study the Earth as a whole system and understand how it is changing, NASA develops and supports a large number of Earth observing missions. These missions provide Earth science researchers the necessary data to address key questions about global climate change.
Wildland Fires
The Wildland Fires Application area promotes the use of Earth observations and models focused on addressing issues related to wildland fire in support of management strategies, business practices, and policy analysis and decisions. The Wildland Fire applications includes support of all aspects of pre, active and post-fire analysis tools that use Earth observations and models to enhance fuel load estimates, fuel treatment planning, risk assessment, air quality, insect infestations, burned area remediation and rehabilitation, and other topics that lead to improved land-management decisions.
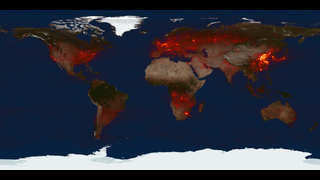
- ID: 3868 Visualization
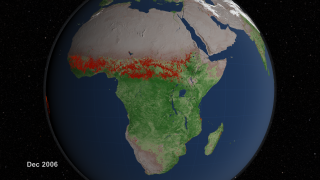
Global Fire Observations and MODIS NDVI
Go to this pageThis visualization leads viewers on a narrated global tour of fire detections beginning in July 2002 and ending July 2011. The visualization also includes vegetation and snow cover data to show how fires respond to seasonal changes. The tour begins in Australia in 2002 by showing a network of massive grassland fires spreading across interior Australia as well as the greener Eucalyptus forests in the northern and eastern part of the continent. The tour then shifts to Asia where large numbers of agricultural fires are visible first in China in June 2004, then across a huge swath of Europe and western Russia in August, and then across India and Southeast Asia through the early part of 2005. It moves next to Africa, the continent that has more abundant burning than any other. MODIS observations have shown that some 70 percent of the world's fires occur in Africa alone. In what's a fairly average burning season, the visualization shows a huge outbreak of savanna fires during the dry season in Central Africa in July, August, and September of 2006, driven mainly by agricultural activities but also by the fact that the region experiences more lightning than anywhere else in the world. The tour shifts next to South America where a steady flickering of fire is visible across much of the Amazon rainforest with peaks of activity in September and November of 2009. Almost all of the fires in the Amazon are the direct result of human activity, including slash-and-burn agriculture, because the high moisture levels in the region prevent inhibit natural fires from occurring. It concludes in North America, a region where fires are comparatively rare. North American fires make up just 2 percent of the world's burned area each year. The fires that receive the most attention in the United States, the uncontrolled forest fires in the West, are less visible than the wave of agricultural fires prominent in the Southeast and along the Mississippi River Valley, but some of the large wildfires that struck Texas earlier this spring are visible. More information on the Fire Information for Resource Management System (FIRMS) is available at http://maps.geog.umd.edu/firms/. ||
- Section
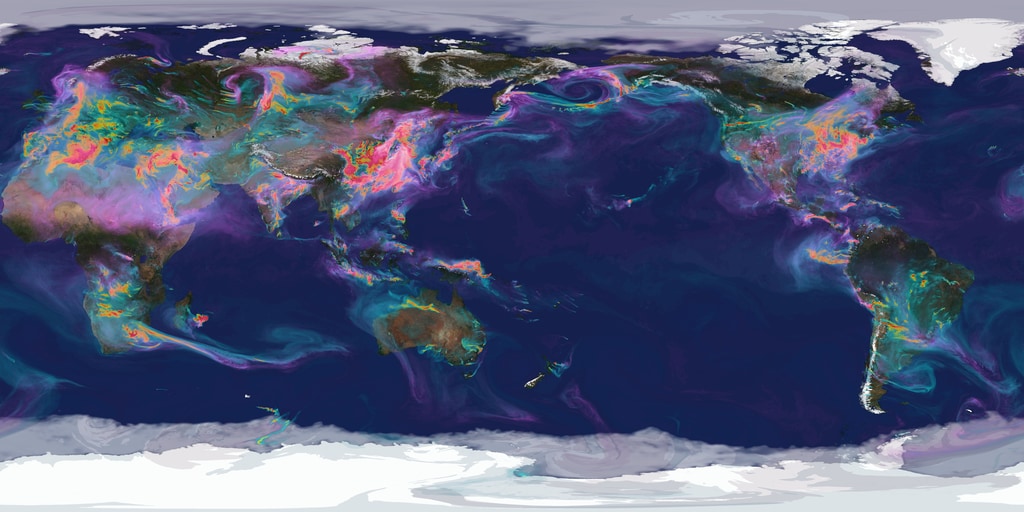
Around the World with Aerosols and Fires
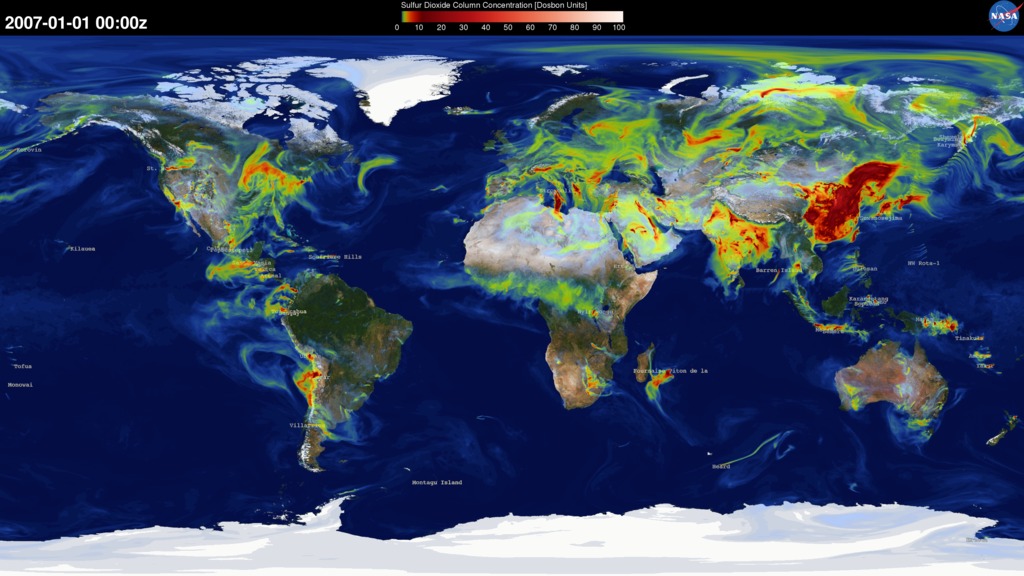
Go to this sectionTiny solid and liquid particles suspended in the atmosphere are called aerosols. Windblown dust, sea salts, volcanic ash, smoke from wildfires, and pollution from factories are all examples of aerosols. Depending upon their size, type, and location, aerosols can either cool the surface, or warm it. They can help clouds to form, or they can inhibit cloud formation. And if inhaled, some aerosols can be harmful to people’s health. To study aerosols, researchers from NASA’s Global Modeling and Assimilation Office ran a simulation of the atmosphere that captured how winds transport aerosols around the world. The simulation shows sea salt and dust swirl inside cyclones, sulfates stream from volcanoes, and carbon burst from fires (red dots) from May 2005 to May 2007, produced by the Goddard Earth Observing System Model Version 5, or GEOS-5. In general, dust appears in shades of orange, sea salt appears in shades of blue, sulfates appear white, and carbon appears in shades of green. Such simulations allow scientists to better understand how these tiny particulates travel in the atmosphere and influence weather and climate.
- ID: 4484 Visualization
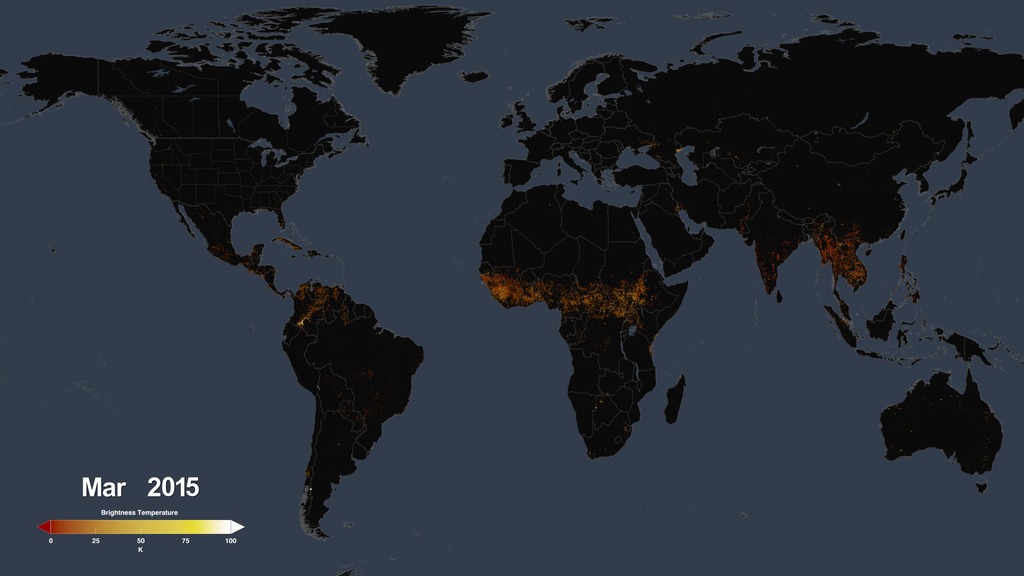
Global Fires 2015-2016 Visualizations
Go to this pageGlobal Fires 2015-2016, with Dates and Colorbar || global_fires_statelines_0000_print.jpg (1024x576) [73.9 KB] || global_fires_statelines_0000_searchweb.png (320x180) [41.4 KB] || global_fires_statelines_0000_thm.png (80x40) [4.6 KB] || global_fires_statelines (1920x1080) [0 Item(s)] || global_fires_statelines_1080p30.mp4 (1920x1080) [8.5 MB] || global_fires_statelines_1080p30.webm (1920x1080) [2.3 MB] || global_fires_statelines_1080p30.mp4.hwshow [197 bytes] ||
- ID: 30797 Hyperwall Visual
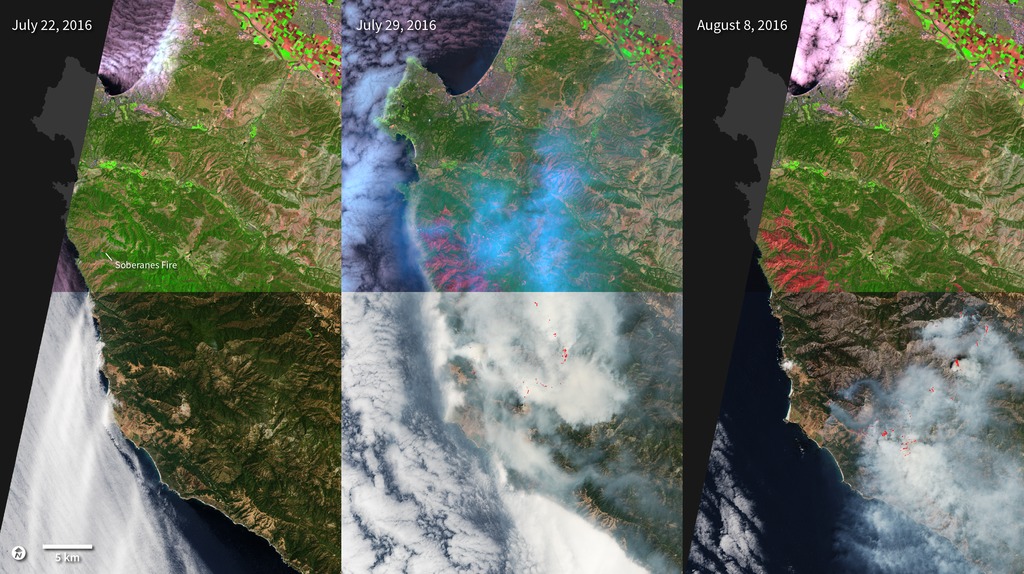
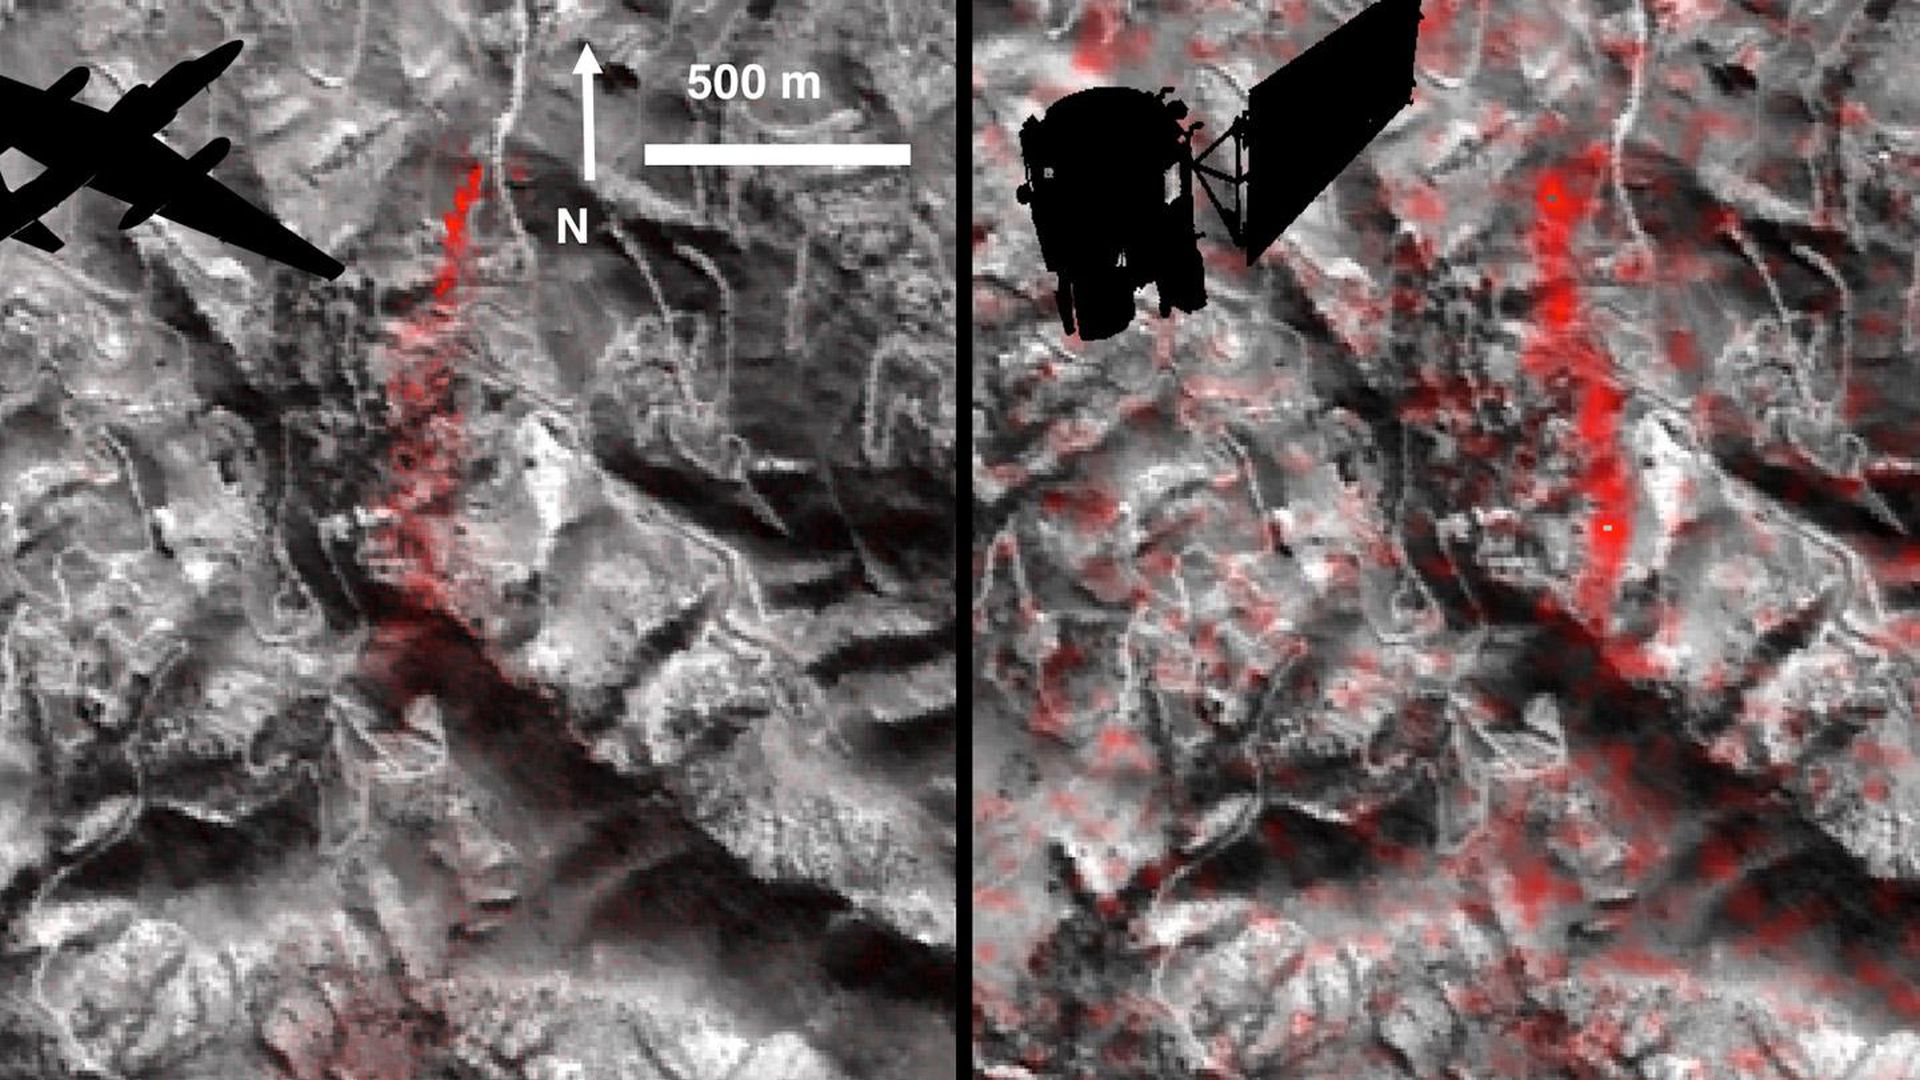
Landsat 8 Views the Soberanes Fire
Go to this pageBy chance, Landsat 8 acquired imagery of the Soberanes fire burning near the California coast between Monterey and Big Sur a few hours after it started on July 22, 2016. Seven days later, on July 29, the fire had grown so much that the surrounding area is almost entirely covered by smoke. This set of Landsat images shows the region on [left to right] July 22, July 29, and August 8 in true color (using bands 4, 3, and 2) and also in shortwave and near-infrared light (using bands 7, 5, and 4). Active fires, which can be detected based on calculations using the shortwave infrared and near-infrared bands, are shown in red on the true color images. The shortwave and near-infrared images penetrate the smoke to provide a clearer view of the burn scar. In this false-color view, active fires are bright red and orange, scarred land is dark red, and intact vegetation and human development are shades of green. ||
- ID: 4407 Visualization
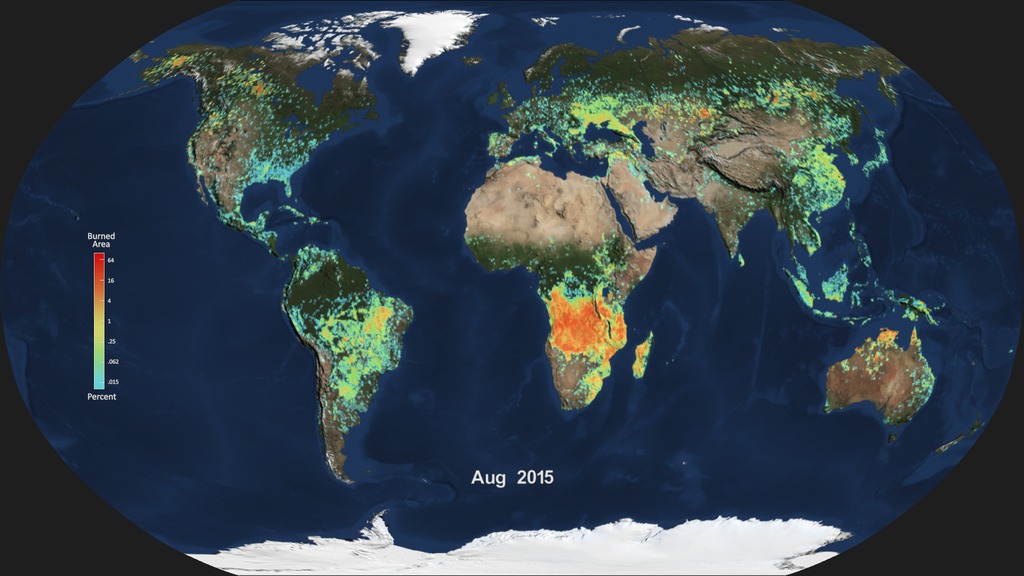
Monthly burned area from the Global Fire Emissions Database (GFED)
Go to this pageThe final animation of the monthly burned area percent shown in the Robinson projection with a colorbar and date overlay || comp_burned_area_pct.2234_print.jpg (1024x576) [128.4 KB] || comp_burned_area_pct.2234_searchweb.png (320x180) [78.4 KB] || comp_burned_area_pct.2234_thm.png (80x40) [6.4 KB] || comp_burned_area_pct.2234_web.png (320x180) [78.4 KB] || comp_burned_area_pct_1080p30.mp4 (1920x1080) [44.1 MB] || comp_burned_area_pct_1080p30.webm (1920x1080) [8.4 MB] || robinson_final (1920x1080) [0 Item(s)] || Comp_burned_area_pct_720p30.mp4 (1280x720) [26.2 MB] || robinson_final (3840x2160) [0 Item(s)] || comp_burned_area_4407.key [29.7 MB] || comp_burned_area_4407.pptx [27.1 MB] || comp_burned_area_pct_4k_2160p30.mp4 (3840x2160) [142.3 MB] || comp_burned_area_pct_1080p30.mp4.hwshow [228 bytes] ||
- ID: 12056 Produced Video

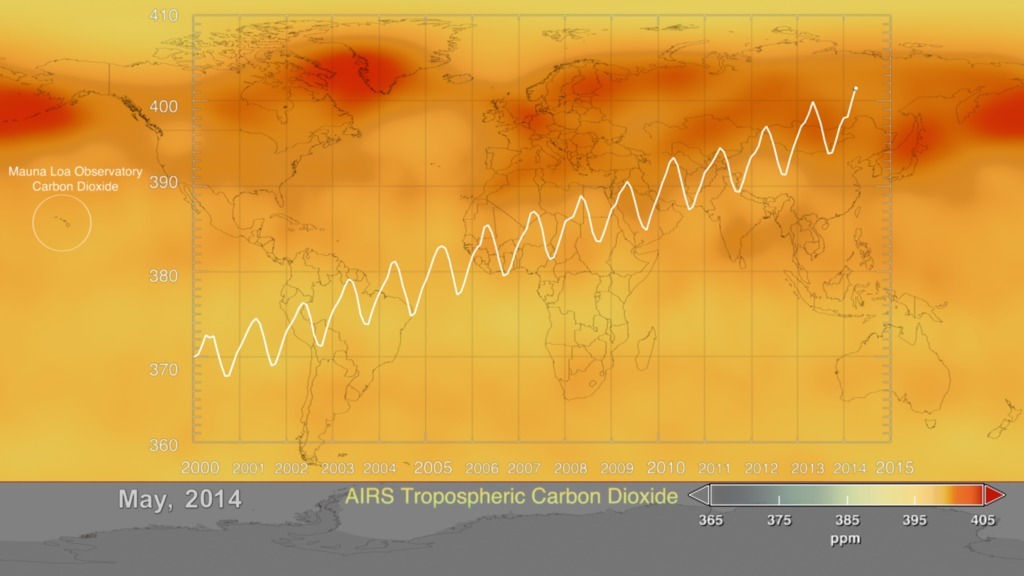
Carbon Dioxide Sources From a High-Resolution Climate Model
Go to this pageAnimation of carbon dioxide released from two different sources: fires (biomass burning) and massive urban centers known as megacities. The animation covers a five day period in June 2006. The model is based on real emission data and is then set to run so that scientists can observe how the greenhouse gas behaves once it has been emitted. || tagged_co2_global_loop_appletv_print.jpg (1024x576) [102.9 KB] || tagged_co2_global_loop_appletv_searchweb.png (320x180) [75.4 KB] || tagged_co2_global_loop_appletv_thm.png (80x40) [6.0 KB] || tagged_co2_global_loop_appletv.m4v (1280x720) [25.1 MB] || tagged_co2_global_loop_youtube_hq.mov (1920x1080) [80.0 MB] || tagged_co2_global_loop.webm (960x540) [14.5 MB] || tagged_co2_global_loop_ipod_sm.mp4 (320x240) [7.8 MB] || tagged_co2_global_loop.mpeg (1280x720) [172.7 MB] || tagged_co2_global_loop_prores.mov (1280x720) [707.1 MB] ||
- ID: 30627 Hyperwall Visual
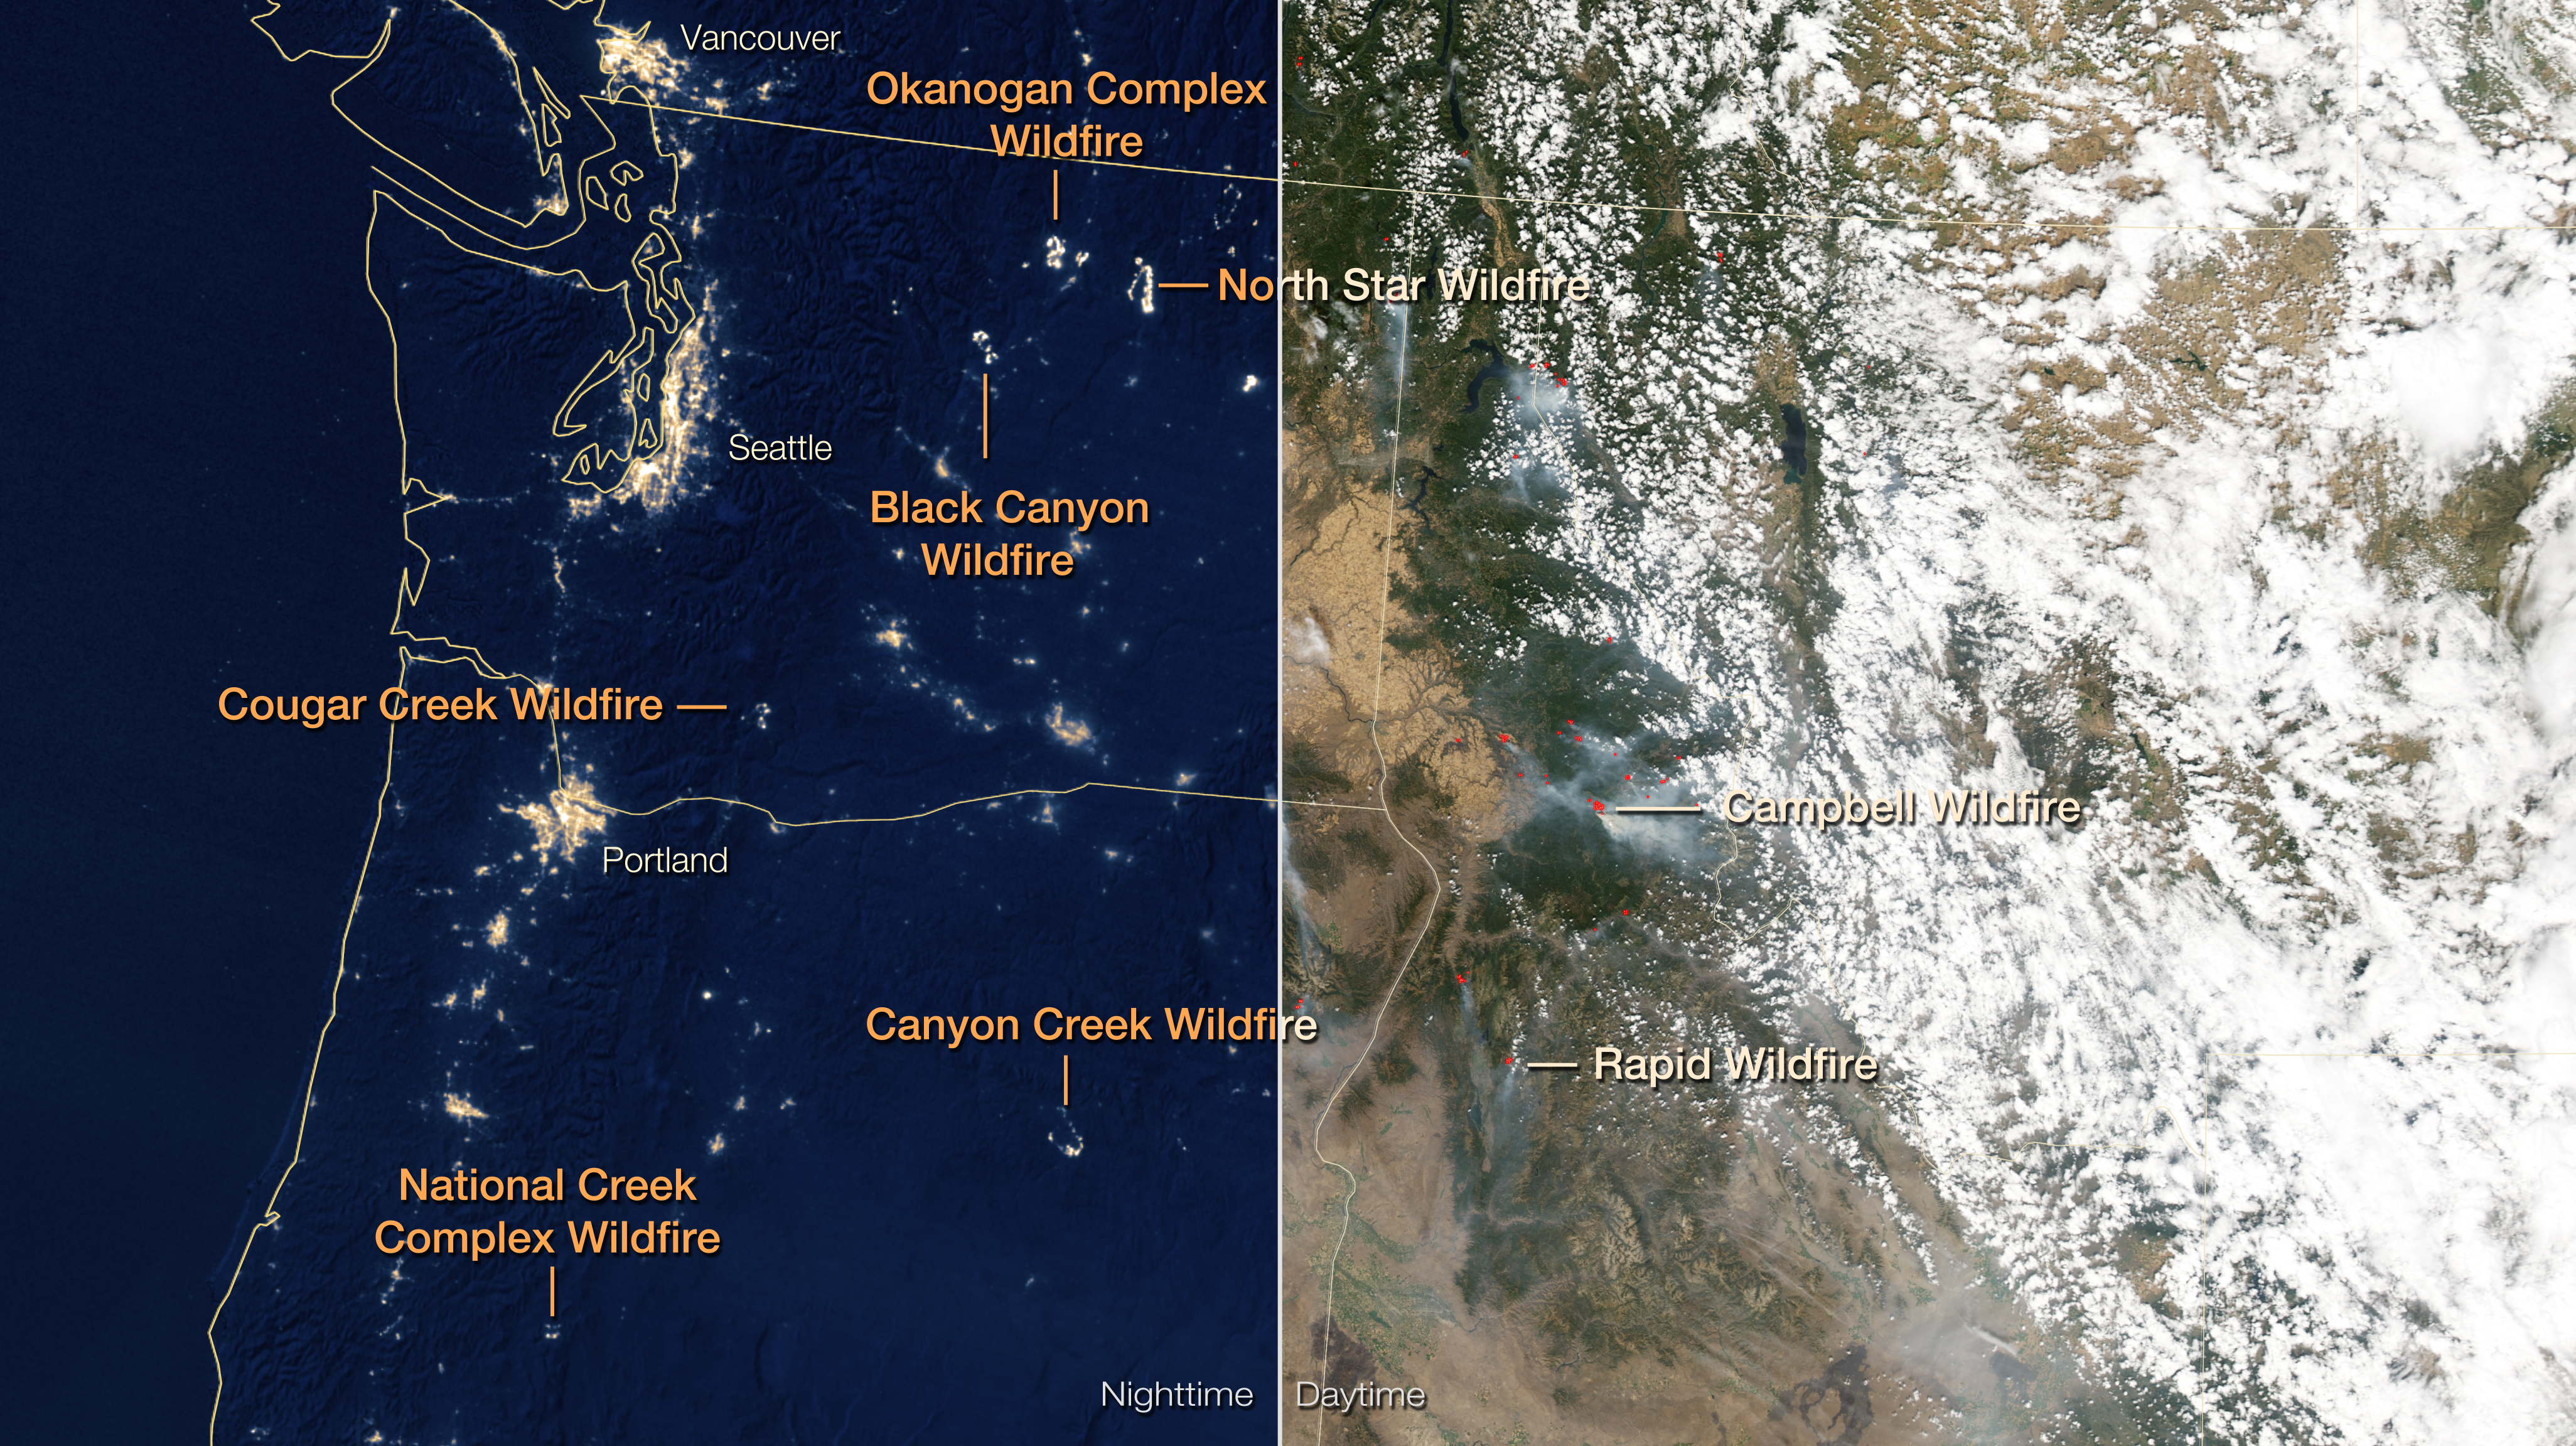
Fires at Night in the U.S. Northwest
Go to this pageFires at Night in the U.S. Northwest || nw_fires_at_night_preview.jpg (1024x575) [5.5 MB] || nw_fires_at_night_preview_thm.png (80x40) [24.2 KB] || nw_fires_at_night_preview_searchweb.png (180x320) [136.1 KB] || nw_fires_at_night_ae_1080p.mp4 (1920x1080) [7.4 MB] || nw_fires_at_night_ae_720p.mp4 (1280x720) [3.8 MB] || nw_fires_at_night_ae_720p.webm (1280x720) [4.7 MB] || nw_fires_at_night_2304p.mp4 (4096x2304) [22.8 MB] || nw_fires_at_night_ae_360p.mp4 (640x360) [1.2 MB] || 4104x2304_16x9_30p (4104x2304) [64.0 KB] || nw_fires_at_night_30627.pptx [30.2 MB] || nw_fires_at_night_30627.key [32.0 MB] ||
- ID: 30194 Hyperwall Visual
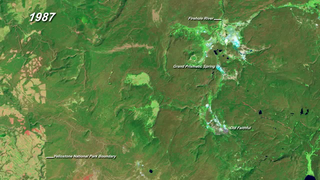
Burn Recovery in Yellowstone
Go to this pageIn the summer of 1988, lightning- and human-ignited fires consumed vast stretches of Yellowstone National Park. By the time the first snowfall extinguished the last flames in September, 793,000 of the park’s 2,221,800 acres had burned.This series of images shows the scars left in the wake of the western Yellowstone fires and the slow recovery in the twenty years that followed. Taken by Landsat-5, the images were made with a combination of visible and infrared light (green, short-wave infrared, and near infrared) to highlight the burned area and changes in vegetation. In the years that follow, the burn scar fades progressively. On the ground, grasses and wildflowers sprung up from the ashes and tiny pine trees took root and began to grow. Though changes did occur between 1988 and 2010, recovery has been slow. In 2010, the burned area is still clearly discernible.Images acquired by Landsat satellites Reference: NASA’s Earth Observatory ||
- ID: 30195 Hyperwall Visual

Night Views of Fires in Siberia
Go to this pageThe vast majority of Russian wildfires occur in Siberia, generally along the southern border. This year’s blazes have followed the typical pattern and occurred primarily east of the Urals. This pair of images from August 3, 2012 shows fires using two different instruments. The Suomi National Polar-orbiting Partnership (NPP) satellite carries an instrument called the “day-night band,” designed to be sensitive to such low levels of visible light that it can detect wildfires in the dark of the night. On August 3, 2012, the Visible Infrared Imaging Radiometer Suite (VIIRS) on Suomi NPP acquired the right image of wildfires blazing in eastern Siberia. The white outlines are the actively burning perimeters of several fires. ||
- ID: 4093 Visualization
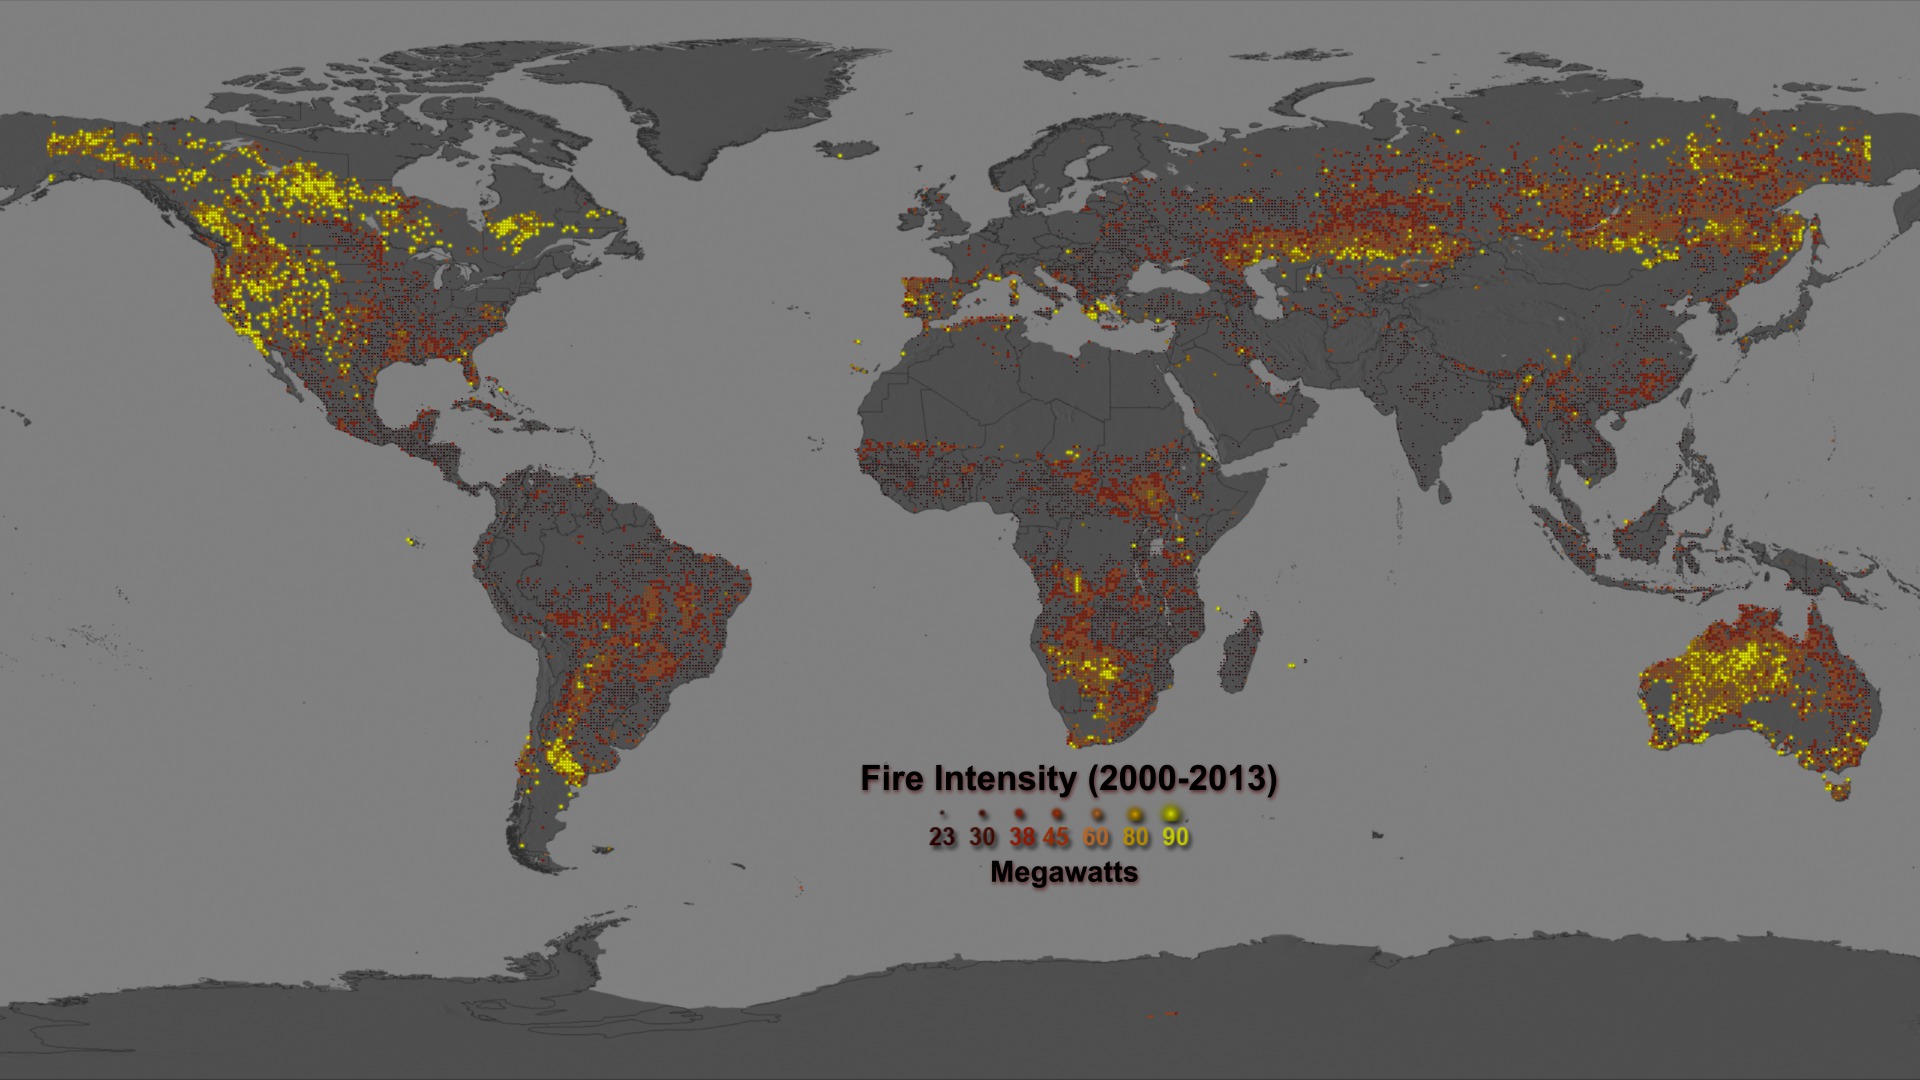
Mapping the Fire Intensity Global Record (2000 through 2013)
Go to this pageThis visualization displays the MODIS Climate Modeling Grid (CMG) Mean Fire Radiative Power (FRP). The CMG fire products incorporate MODIS active fire data into gridded statistical summaries of fire pixel information intended for use in regional and global modeling. The products are currently generated at 0.5 degree spatial resolution. Many of the lower intensity fires shown in red were prescribed fires, lit for either agricultural or ecosystem management purposes. Orange indicates fires that were more intense with the most intense FRP being shown in yellow. Notice, many of the most intense fires occurred in higher latitudes. ||
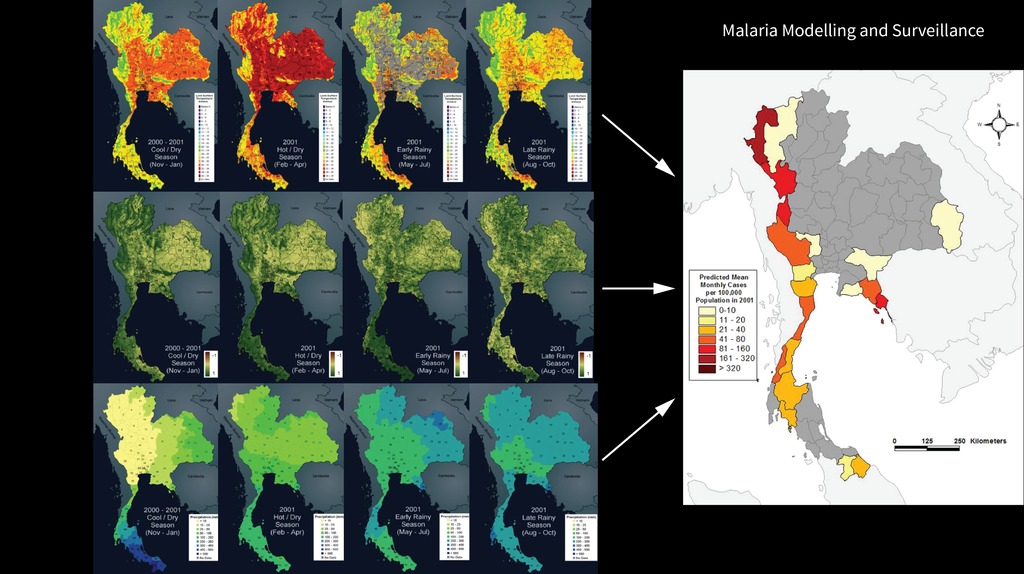
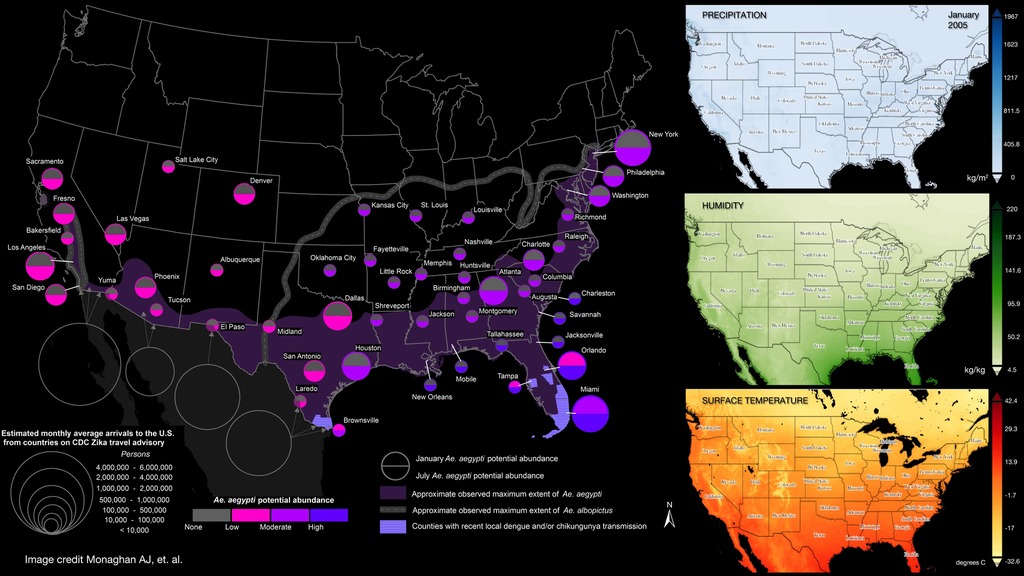
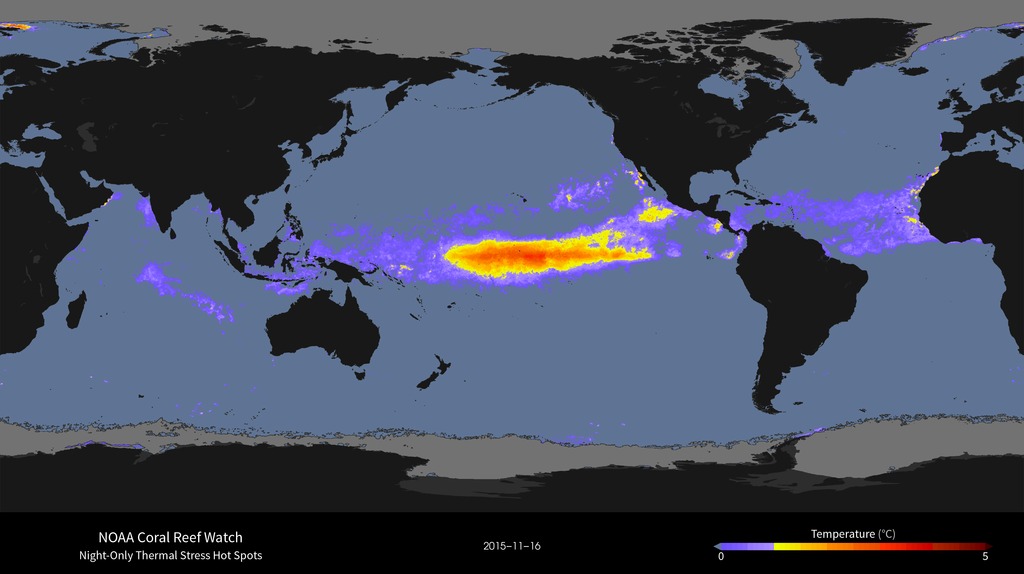
Health & Air Quality
The Health & Air Quality Applications area encourages the use of Earth observations in air quality management and public health, particularly involving environmental health and infectious diseases. The area addresses issues of toxic and pathogenic exposure and health-related hazards and their effects for risk characterization and mitigation. The area promotes uses of Earth observations data and models regarding implementation of air quality standards, policy, and regulations for economic and human welfare. The area also addresses effects of climate change on air quality and public health to support managers, policy makers, and ultimately the public with health-related decisions and actions.
- ID: 11579
- ID: 30014
 Hyperwall Visual
 - ID: 4447
- ID: 3783
- ID: 12221
 Produced Video
 - ID: 30699
 Hyperwall Visual
 - ID: 30593
 Hyperwall Visual
 - ID: 30824
 Hyperwall Visual
 - ID: 30791
 Hyperwall Visual
 - ID: 3868Visualization
- ID: 30637
 Hyperwall Visual
 - ID: 30641
 Hyperwall Visual
 - ID: 30787
 Hyperwall Visual
 - ID: 3882
 Visualization
- ID: 4273
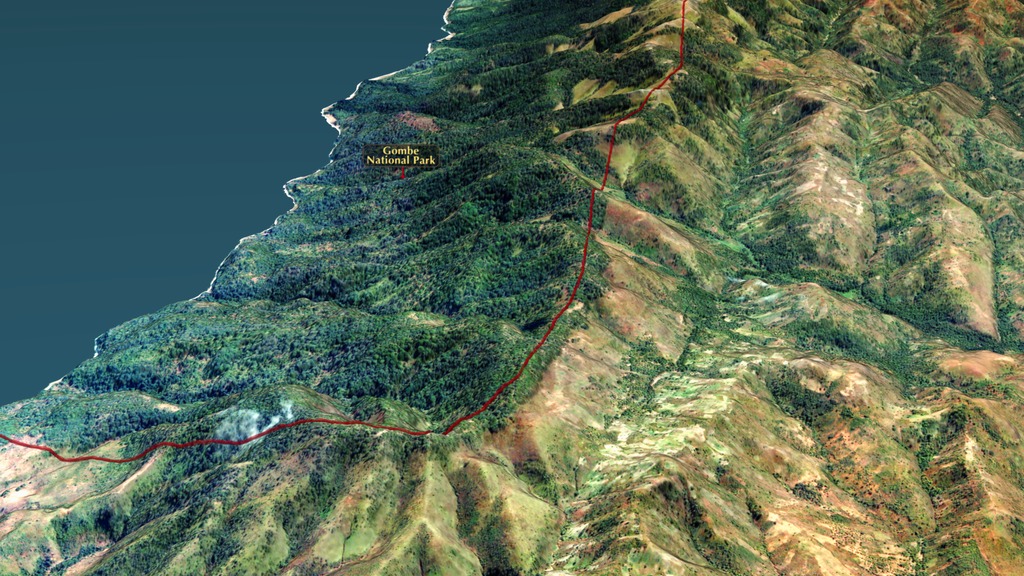
Ecological Forecasting
The Ecological Forecasting Applications area promotes the use of Earth observations and models to analyze and forecast changes that affect ecosystems and to develop effective resource management strategies. Primary user communities are natural resource managers (both land and marine) and those involved in conservation and sustainable ecosystem management.
- ID: 30059
 Hyperwall Visual
 - ID: 30215
 Hyperwall Visual
 - ID: 30874
 Hyperwall Visual
 - ID: 4476
- ID: 30730
 Hyperwall Visual
 - ID: 30521
 Hyperwall Visual
 - ID: 30158
 Hyperwall Visual
 - ID: 30693
 Hyperwall Visual
 - ID: 30194Hyperwall Visual
- ID: 3868Visualization
- ID: 3947
- ID: 30634
 Hyperwall Visual
 - ID: 30595
 Hyperwall Visual
 - ID: 3912
 Visualization
 - ID: 3913
 Visualization
 - ID: 30728
 Hyperwall Visual
 - ID: 4483
 Visualization
 - ID: 30677
 Hyperwall Visual
 - ID: 4452
- ID: 4184
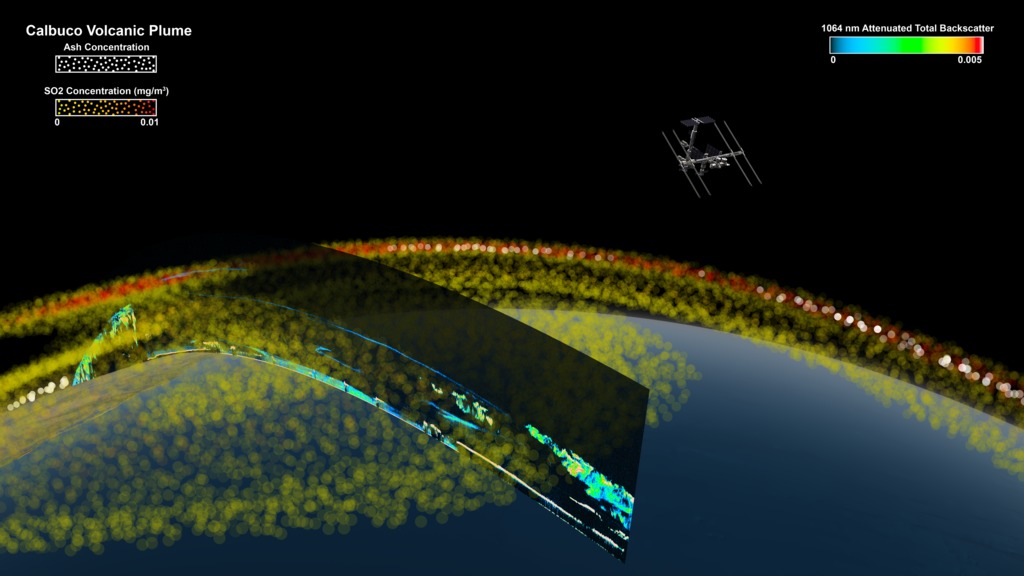
Disasters
The Disasters Applications area promotes the use of Earth observations to improve prediction of, preparation for, response to, and recovery from natural and technological disasters. The Disasters area supports projects to enhance management practices and disaster reduction across disaster types, including floods, earthquakes, volcanoes, and landslides. Disaster applications and applied research on natural hazards support emergency preparedness leaders in developing mitigation approaches, such as early warning systems, and providing information and maps to disaster response and recovery teams.
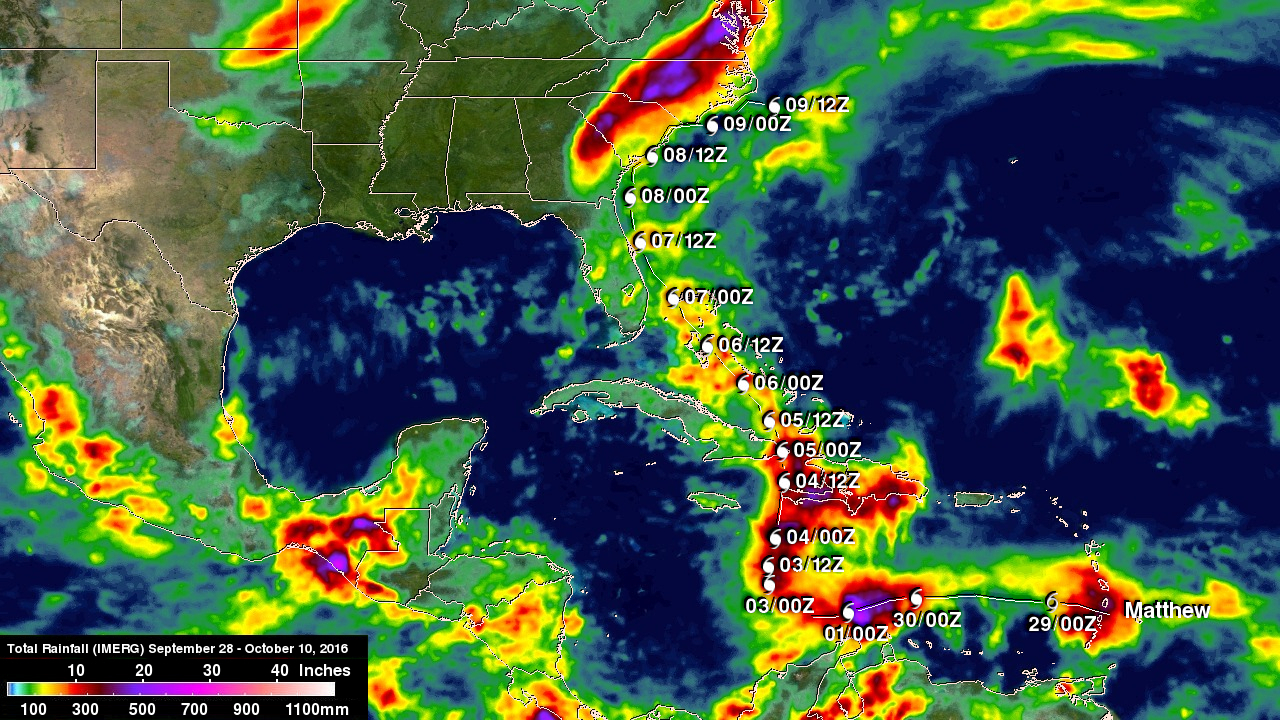
- ID: 3783
- ID: 30307
 Hyperwall Visual
 - ID: 30188
 Hyperwall Visual
 - ID: 30308
 Hyperwall Visual
 - ID: 30744
- ID: 30637Hyperwall Visual
- ID: 30641Hyperwall Visual
- ID: 4283
 Visualization
 - ID: 4284
- ID: 4304
- ID: 4543
 Visualization
 - ID: 30833
 Hyperwall Visual
 - ID: 4542
 Visualization
 - ID: 3912Visualization
- ID: 4173
 Visualization
 - ID: 30657
 Hyperwall Visual
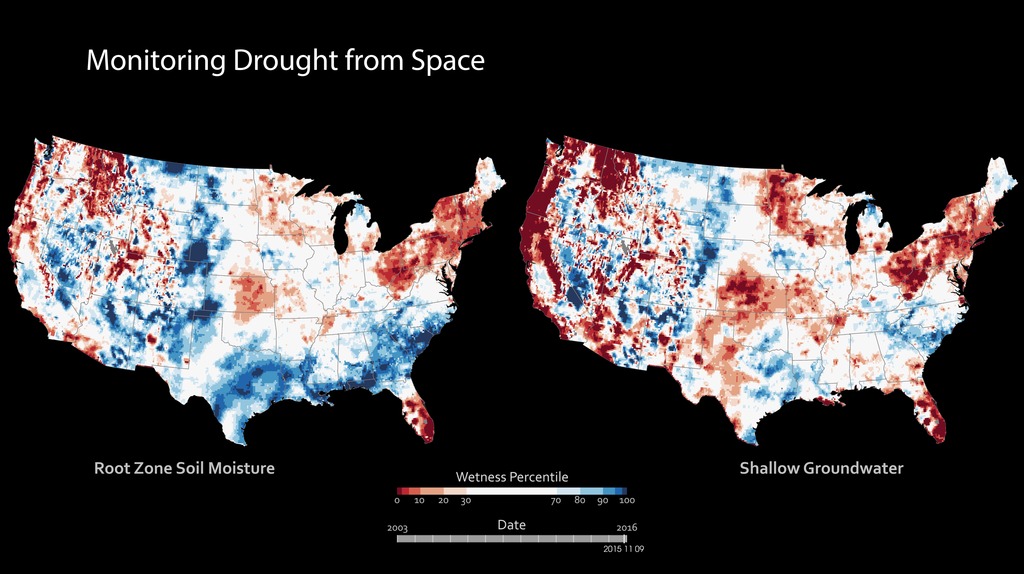
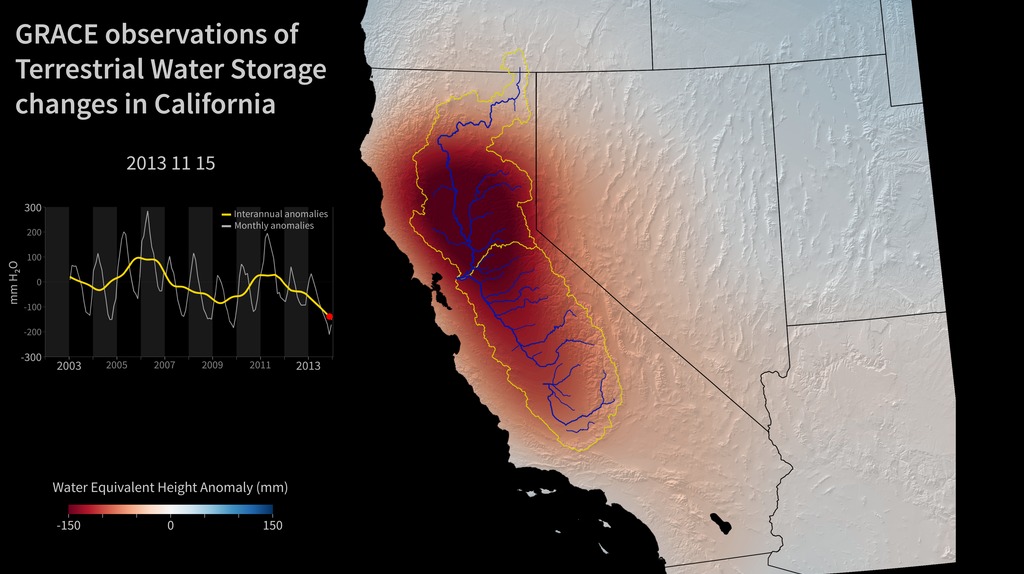
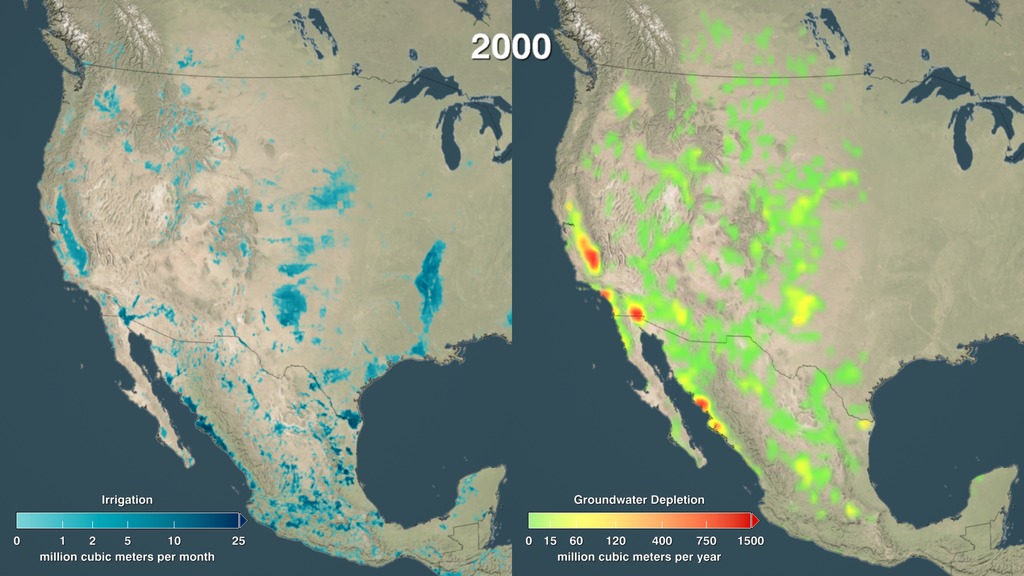
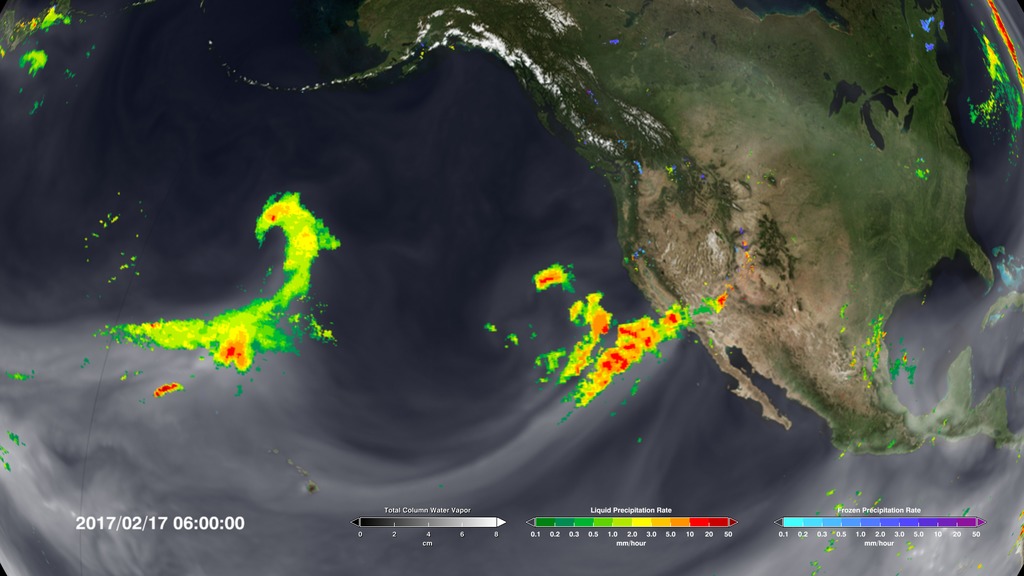
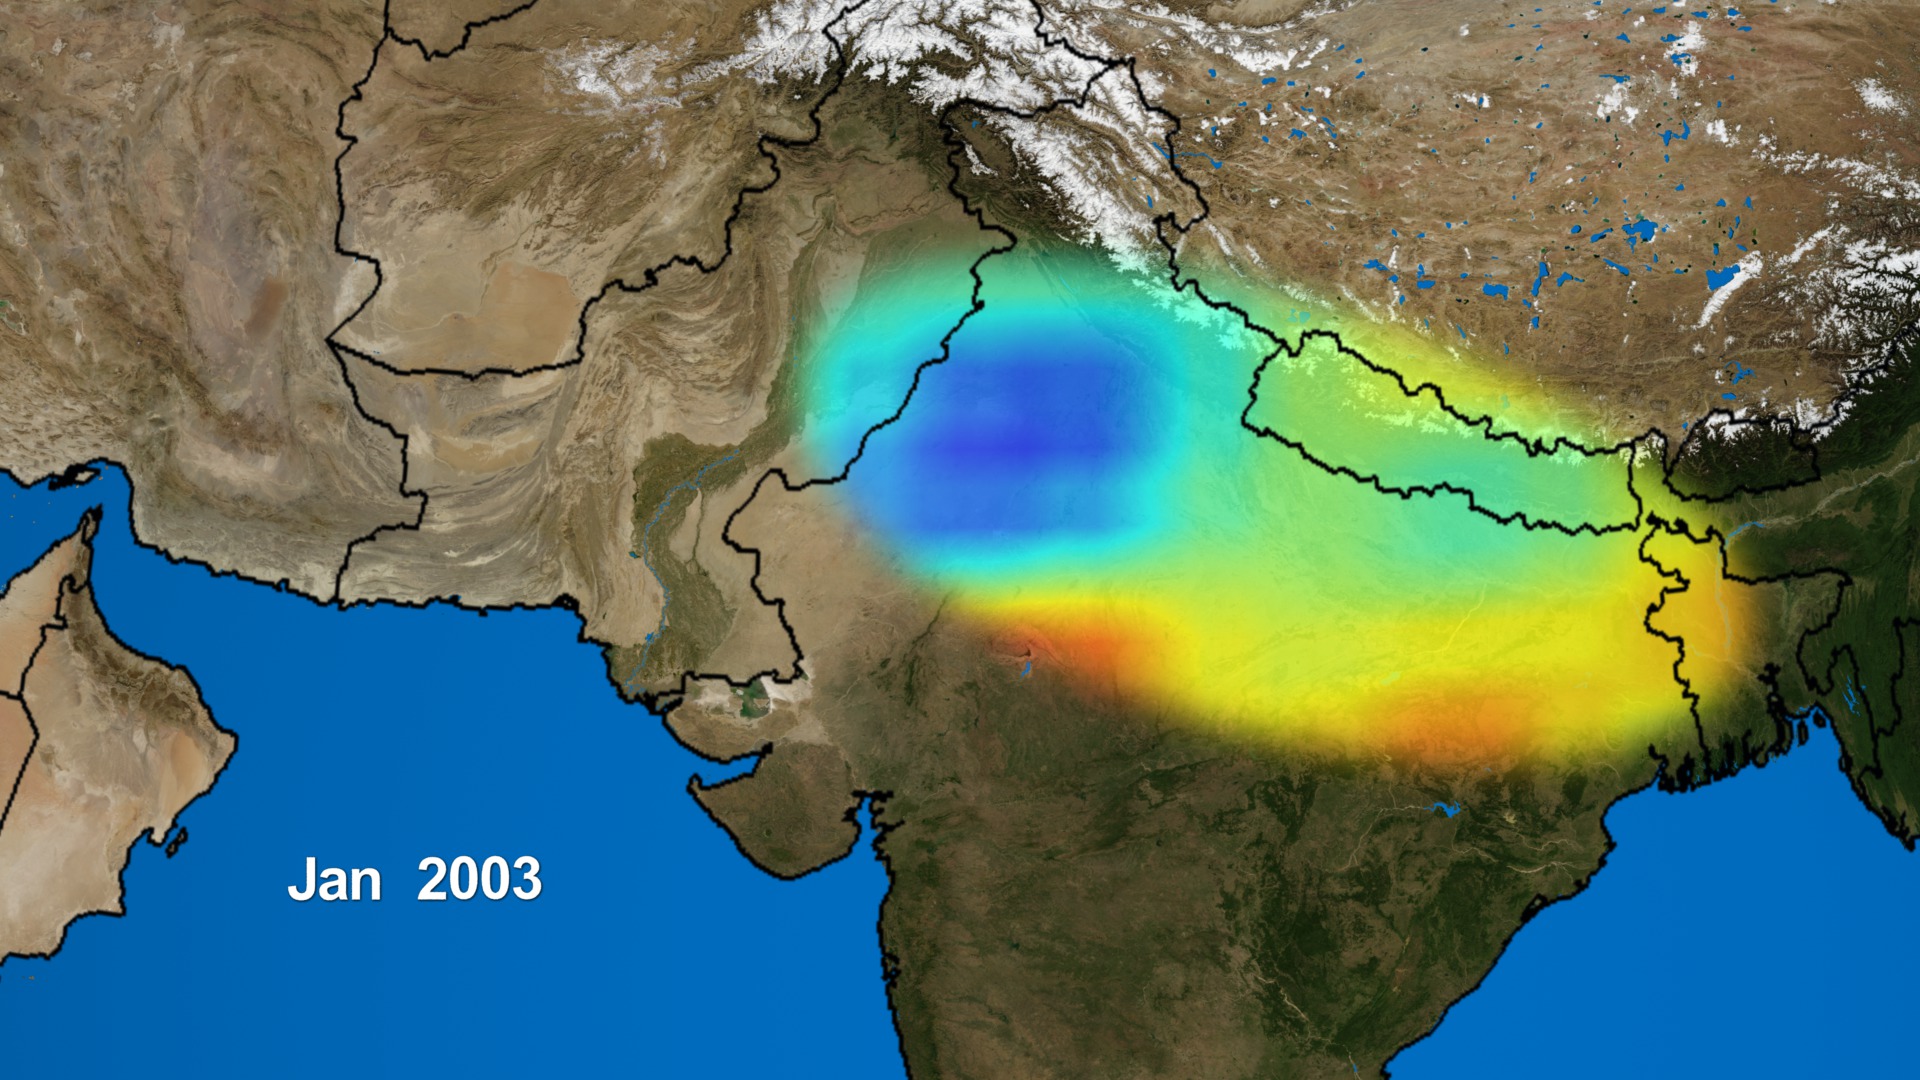
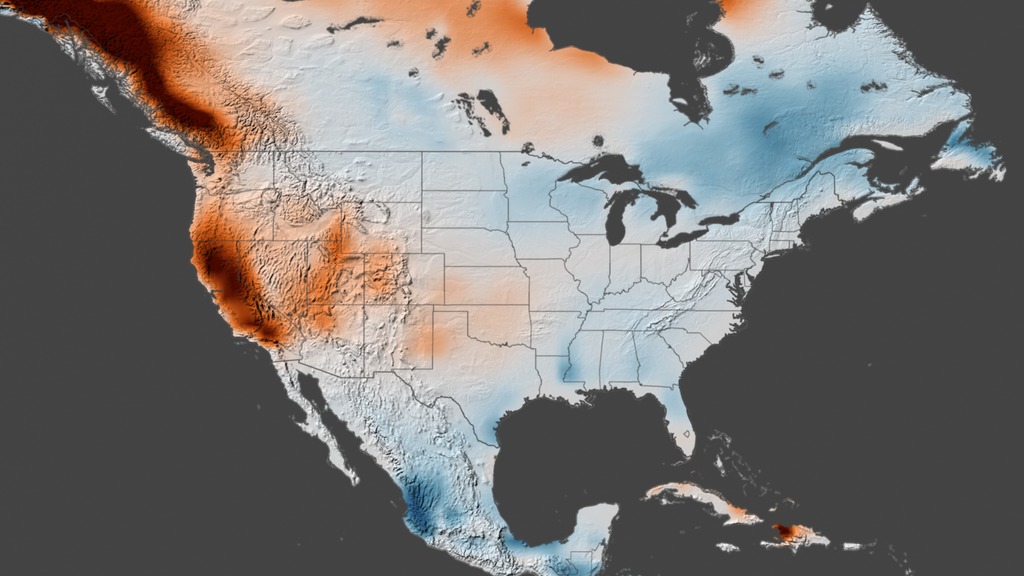
Water Resources
The Water Resources Applications area supports the use of Earth observations in water resources management related to water demand, supply, and quality. The program includes five functional themes: drought; stream flow and flood forecasting; evapotranspiration and irrigation; water quality; and climate effects on water resources.
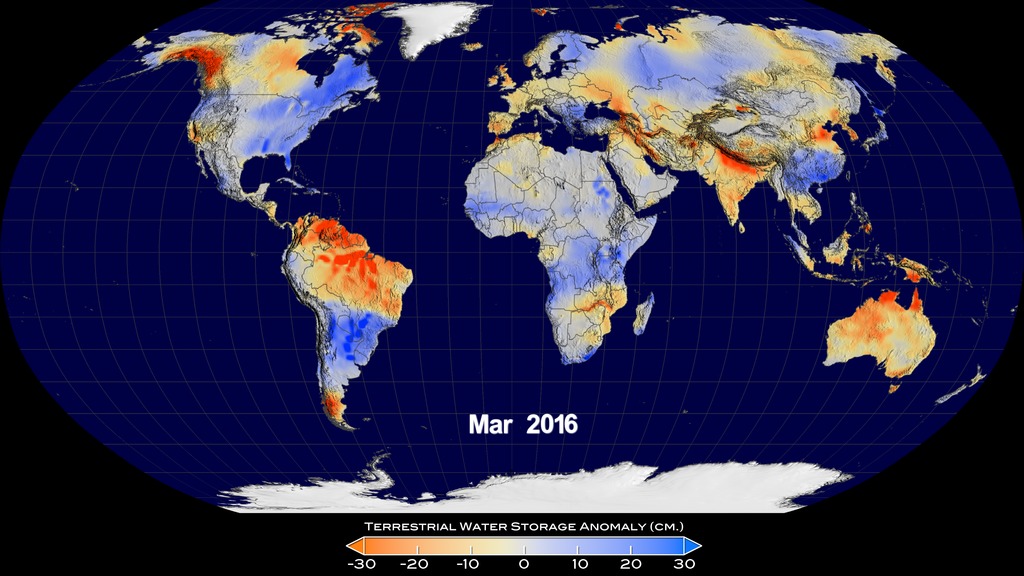
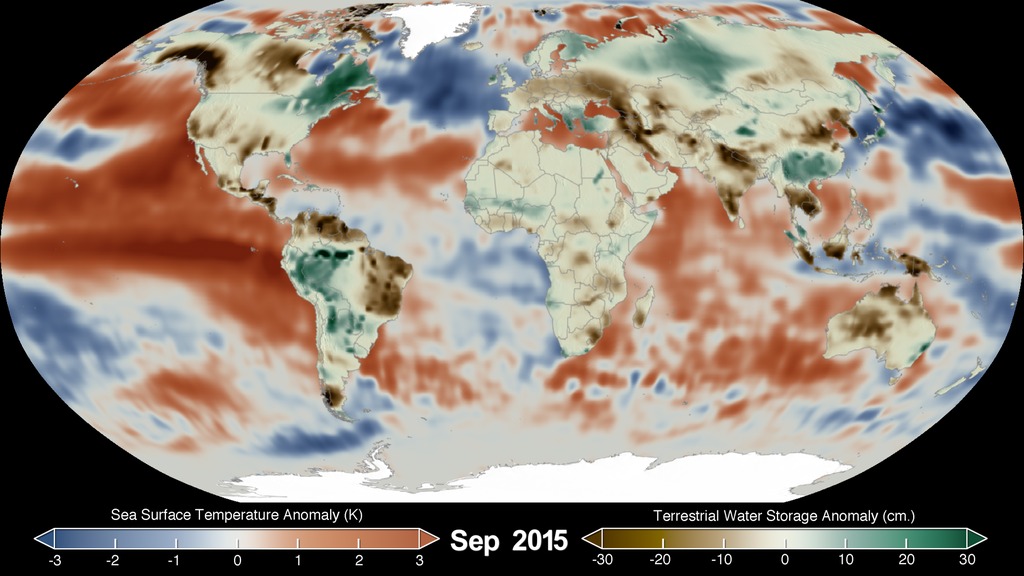
- ID: 4523
 Visualization
 - ID: 4555
 Visualization
 - ID: 4134
- ID: 4338
 Visualization
 - ID: 30521Hyperwall Visual
- ID: 4283Visualization
- ID: 4285
- ID: 30580
 Hyperwall Visual
 - ID: 4071

- ID: 4072
- ID: 30698
 Hyperwall Visual
 - ID: 4413
Recent Presentations
Recent hyperwall presentations on Applied Science.
 Link
LinkEarth Observations Supporting Wildfire Management
Various NASA Programs and technology development components contribute to the wildfire management community. In addition to components and materials developed for life support systems for astronauts that have crosscutting utility in the firefighting community, other technologies from Aeronautics, Space observation systems and, Earth sciences all play a major role in supporting today’s firefighter. This presentation was given at AGU 2016 by Vince Ambrosia
Go to this link- Link
Earth Observations for Global Water Knowledge
The NASA Applied Sciences Program Water Resources application area supports the integration of NASA Earth observations and technologies into management tools for the water resources management community. This presentation reviews the sources of data that are used for monitoring and predicting ground water balance and water availability. These data include gravity anomalies, precipitation amounts and measurements of soil moisture, and they are a vital input to crop health assessments. This presentation was given at AGU 2016 by John Bolten.
Go to this link - Link
An Overview of NASA's Applied Science Program
A presentation given by Lawrence Friedl at ISRSE 2015
Go to this link 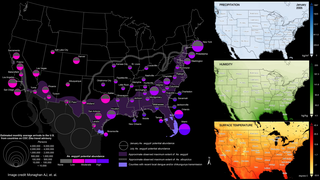 Link
LinkNASA Earth Observation Systems and Applications for Public Health
A presentation given by Shobhana Gupta at APHA 2016
Go to this link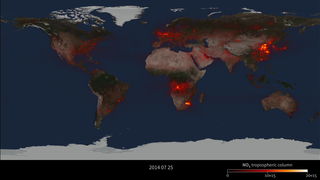 Link
LinkFrom Smog to Volcanic Ash: NASA Earth Observations for Air Quality Applications
A presentation given by John Haynes at APHA 2016
Go to this link- Link
Observations of our Planet from Space Using NASA's Satellites
A presentation given by Dr. Ali Omar at AWMA 2016
Go to this link  Link
LinkNatural Hazards monitoring and mitigation
A presentation given by David Green at 2015 Digital Earth
Go to this link- Link
Improving Global-Scale observations to Halt Illegal Fishing
A presentation given by Miguel Román at State Oceans 2016
Go to this link - Link
Earth’s Biodiversity: The View from Space
A presentation given by Allison Leidner at IUCN 2016
Go to this link  Link
LinkEarth’s Biodiversity: Another View from Space
A presentation given by Woody Turner at IUCN 2016
Go to this link