Earth
ID: 5019
This visualization shows the planned orbit of NASA’s PACE mission (Plankton, Aerosol, Cloud, ocean Ecosystem). The visualization is organized into three sections.
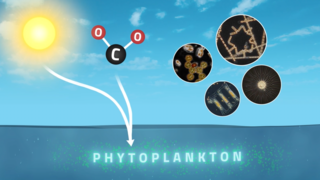
In terms of life on Earth, color describes more than simply how features look. In many cases color serves as a proxy for biological processes. When studying ocean biology, colors count in a big way.
The PACE mission has been conceived principally as a way to measure ocean color for assessing large scale ocean health. These measurements will provide data to determine the distribution of phytoplankton, tiny plants and algae that sustain the marine food web. A simple way to think about this is the more “green” that’s visible from space, the more prevalent are plant cells containing chlorophyll, an essential green pigment responsible for energy-producing photosynthesis in plants. Phytoplankton populations are fundamental to understanding the overall health of the ocean food web, as well as a wide range of related processes.
PACE will be able to see other colors too—a broad range of color, in fact, stretching beyond the bounds of visible light into both ultraviolet as well as infrared. PACE will also be able to make measurements of aerosols in the atmosphere, essential for scientists to improve our understanding of and our ability to forecast weather and climate.
PACE continues a more than 20 year legacy of ocean color measurements, providing the scientific community with a long time series of data. That legacy enables better assessments of long term trends about complex processes on Earth.
PACE will be able to see other colors too—a broad range of color, in fact, stretching beyond the bounds of visible light into both ultraviolet as well as infrared. PACE will also be able to make measurements of aerosols in the atmosphere, essential for scientists to improve our understanding of and our ability to forecast weather and climate.
PACE continues a more than 20-year legacy of ocean color measurements, providing the scientific community with a long time series of data. That legacy enables better assessments of long-term trends about complex processes on Earth.
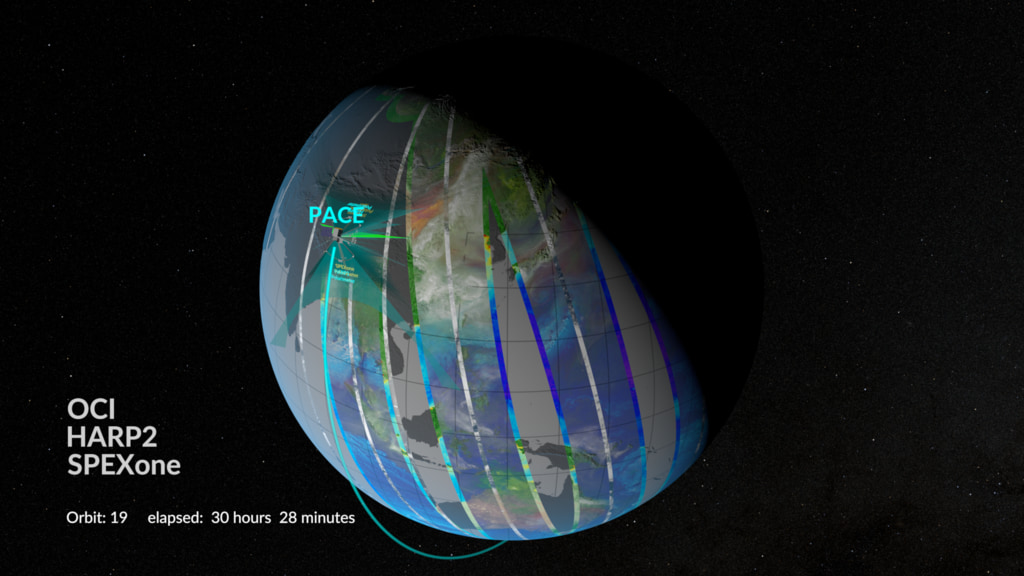
PACE orbit with swaths and instrument fields of view
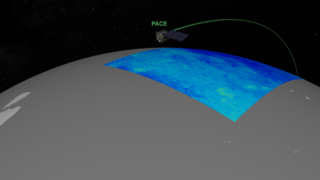
- In the first section, PACE's orbit is shown from a global view. PACE will be in a 98-degree-inclination, sun-synchronous polar orbit with an equatorial crossing time of 1:00 pm local time. PACE's orbital period (i.e., the time it takes to complete one orbit) is 98.3 minutes at an altitude of 676.5 km.
- In second section, the camera zooms in to look at the fields of view of each of PACE's instruments:
• The Ocean Color Instrument (OCI) viewing width is 113 degrees. During each orbit on the sunlit side of the Earth, OCI will change its pointing from 20 degrees behind the spacecraft (aft) when south of the Sun's latitude to 20 degrees ahead of the spacecraft (fore) when north. This is to avoid having the instrument’s field of view look into Sun glint. OCI will change its pointing back from fore to aft on the dark side of each orbit.
• The Hyper Angular Rainbow Polarimeter #2(HARP2) instrument has a viewing width of 94 degrees. HARP2 has 10 viewing angles along the orbit track for its blue, green, and near-infrared wavelength channels and 60 viewing angles for its red wavelength channel. These viewing angles vary along the direction of travel over a range of 114 degrees. The ground swath as viewed on Earth will vary in width with viewing angle.
• The Spectro-polarimeter for Planetary Exploration (SPEXone) instrument's ground swath is about 100 km wide. SPEXone has 5 different viewing angles from -50 degrees (aft) to +50 degrees (fore). Like HARP2, the ground swath as viewed on Earth will vary in width with viewing angle. - The third section shows example ground swaths for each instrument. SPEXone has a relatively narrow swath. HARP2 has a wider swath for its nadir (straight down) view. OCI has an even wider swath. At the end all 3 instruments swaths are shown at the same time.
In terms of life on Earth, color describes more than simply how features look. In many cases color serves as a proxy for biological processes. When studying ocean biology, colors count in a big way.
The PACE mission has been conceived principally as a way to measure ocean color for assessing large scale ocean health. These measurements will provide data to determine the distribution of phytoplankton, tiny plants and algae that sustain the marine food web. A simple way to think about this is the more “green” that’s visible from space, the more prevalent are plant cells containing chlorophyll, an essential green pigment responsible for energy-producing photosynthesis in plants. Phytoplankton populations are fundamental to understanding the overall health of the ocean food web, as well as a wide range of related processes.
PACE will be able to see other colors too—a broad range of color, in fact, stretching beyond the bounds of visible light into both ultraviolet as well as infrared. PACE will also be able to make measurements of aerosols in the atmosphere, essential for scientists to improve our understanding of and our ability to forecast weather and climate.
PACE continues a more than 20 year legacy of ocean color measurements, providing the scientific community with a long time series of data. That legacy enables better assessments of long term trends about complex processes on Earth.
PACE will be able to see other colors too—a broad range of color, in fact, stretching beyond the bounds of visible light into both ultraviolet as well as infrared. PACE will also be able to make measurements of aerosols in the atmosphere, essential for scientists to improve our understanding of and our ability to forecast weather and climate.
PACE continues a more than 20-year legacy of ocean color measurements, providing the scientific community with a long time series of data. That legacy enables better assessments of long-term trends about complex processes on Earth.
Used Elsewhere In
Older Version
Visualization Credits
Greg Shirah (NASA/GSFC): Lead Visualizer
Jeremy Werdell (NASA/GSFC): Scientist
Fred Patt (SAIC): Engineer
Ryan Fitzgibbons (KBR Wyle Services, LLC): Producer
Kel Elkins (USRA): Visualizer
Laurence Schuler (ADNET Systems, Inc.): Technical Support
Ian Jones (ADNET Systems, Inc.): Technical Support
Jeremy Werdell (NASA/GSFC): Scientist
Fred Patt (SAIC): Engineer
Ryan Fitzgibbons (KBR Wyle Services, LLC): Producer
Kel Elkins (USRA): Visualizer
Laurence Schuler (ADNET Systems, Inc.): Technical Support
Ian Jones (ADNET Systems, Inc.): Technical Support
Please give credit for this item to:
NASA's Scientific Visualization Studio
NASA's Scientific Visualization Studio
Short URL to share this page:
https://svs.gsfc.nasa.gov/5019
Data Used:
Note: While we identify the data sets used in these visualizations, we do not store any further details nor the data sets themselves on our site.
Keywords:
DLESE >> Atmospheric science
DLESE >> Biology
GCMD >> Earth Science >> Biosphere
GCMD >> Earth Science >> Atmosphere >> Aerosols
GCMD >> Earth Science >> Atmosphere >> Clouds
SVS >> Hyperwall
NASA Science >> Earth
SVS >> 4K
NASA Earth Science Focus Areas >> Carbon Cycle and Ecosystems
GCMD keywords can be found on the Internet with the following citation: Olsen, L.M., G. Major, K. Shein, J. Scialdone, S. Ritz, T. Stevens, M. Morahan, A. Aleman, R. Vogel, S. Leicester, H. Weir, M. Meaux, S. Grebas, C.Solomon, M. Holland, T. Northcutt, R. A. Restrepo, R. Bilodeau, 2013. NASA/Global Change Master Directory (GCMD) Earth Science Keywords. Version 8.0.0.0.0
https://svs.gsfc.nasa.gov/5019
Data Used:
SeaStar/SeaWiFS/Chlorophyll Concentration
All SeaWiFS images and data presented on this web site are for research and educational use only. All commercial use of SeaWiFS data must be coordinated with GeoEye.
Credit:
NASA/Goddard Space Flight Center, The SeaWiFS Project and GeoEye, Scientific Visualization Studio. NOTE: All SeaWiFS images and data presented on this web site are for research and educational use only. All commercial use of SeaWiFS data must be coordinated with GeoEye (NOTE: In January 2013, DigitalGlobe and GeoEye combined to become one DigitalGlobe.).
NASA/Goddard Space Flight Center, The SeaWiFS Project and GeoEye, Scientific Visualization Studio. NOTE: All SeaWiFS images and data presented on this web site are for research and educational use only. All commercial use of SeaWiFS data must be coordinated with GeoEye (NOTE: In January 2013, DigitalGlobe and GeoEye combined to become one DigitalGlobe.).
Comiso's Daily Sea Ice Concentration
Data Compilation - NASA/GSFCSeaStar/SeaWiFS/NDVI
All SeaWiFS images and data presented on this web site are for research and educational use only. All commercial use of SeaWiFS data must be coordinated with GeoEye.
Credit:
NASA/Goddard Space Flight Center, The SeaWiFS Project and GeoEye, Scientific Visualization Studio. NOTE: All SeaWiFS images and data presented on this web site are for research and educational use only. All commercial use of SeaWiFS data must be coordinated with GeoEye (NOTE: In January 2013, DigitalGlobe and GeoEye combined to become one DigitalGlobe.).
NASA/Goddard Space Flight Center, The SeaWiFS Project and GeoEye, Scientific Visualization Studio. NOTE: All SeaWiFS images and data presented on this web site are for research and educational use only. All commercial use of SeaWiFS data must be coordinated with GeoEye (NOTE: In January 2013, DigitalGlobe and GeoEye combined to become one DigitalGlobe.).
Terra and Aqua/MODIS/Normalized Difference Vegetation Index (NDVI) also referred to as: NDVI
NASAGEOS Atmospheric Model
Model - NASA GMAOInteractive Multisensor Snow and Ice Mapping System (IMS)/IMS Daily Northern Hemisphere Snow and Ice Analysis - 24 km Resolution also referred to as: IMS Daily Northern Hemisphere Snow and Ice Analysis
Analysis - NOAASuomi NPP/VIIRS/Chlorophyll Concentration also referred to as: Chlorophyll
Observed DataSuomi NPP/VIIRS/NDVI also referred to as: Normalized Difference Vegetation Index
AnalysisPACE orbit planning ephemeris (TLE) also referred to as: PACE orbit planning ephemeris (TLE)
Ephemeris - NASA
Credit:
Fred Patt
Fred Patt
Keywords:
DLESE >> Atmospheric science
DLESE >> Biology
GCMD >> Earth Science >> Biosphere
GCMD >> Earth Science >> Atmosphere >> Aerosols
GCMD >> Earth Science >> Atmosphere >> Clouds
SVS >> Hyperwall
NASA Science >> Earth
SVS >> 4K
NASA Earth Science Focus Areas >> Carbon Cycle and Ecosystems
GCMD keywords can be found on the Internet with the following citation: Olsen, L.M., G. Major, K. Shein, J. Scialdone, S. Ritz, T. Stevens, M. Morahan, A. Aleman, R. Vogel, S. Leicester, H. Weir, M. Meaux, S. Grebas, C.Solomon, M. Holland, T. Northcutt, R. A. Restrepo, R. Bilodeau, 2013. NASA/Global Change Master Directory (GCMD) Earth Science Keywords. Version 8.0.0.0.0


