Earth
ID: 4926
Tropical Storm Fred, the 6th named storm of the 2021 Atlantic hurricane season, began as a westward moving disturbance in the central Atlantic east of the Lesser Antilles. The system passed through the southern Leeward Islands during the early morning hours of August 10 but still lacked a well-defined center of circulation. Despite significant thunderstorm activity within the system, it wasn’t until late that evening, when the system was passing just south of Puerto Rico, that the National Hurricane Center (NHC) identified a well-defined circulation and upgraded the system to Tropical Storm Fred.
Despite the warm waters in the Caribbean, Fred’s nearly constant interaction with land and wind shear over the next few days limited any development. After Fred’s initial landfall as a tropical storm along the south coast of the Dominican Republic on the afternoon of August 11th, the storm tracked directly across the mountainous terrain of Hispaniola and weakened to a tropical depression. The center re-emerged over water on the 12th, but a combination of westerly and southwesterly wind shear and a track close to the north coast of Cuba kept Fred from redeveloping. Then, after encountering more shear while moving across western Cuba on the 13th, Fred further weakened before finally emerging into the southeast Gulf of Mexico as an open wave on the 14th. It takes time for a disorganized tropical system to re-strengthen, and the 14th saw increasing thunderstorm activity and slow re-organization. However, by the morning of August 15th, NHC found that the system had once again become a tropical storm. Now located in the east-central Gulf approximately due west of Fort Myers, Florida, Fred was in the process of recurving to the north due to an upper-level trough of low pressure to the northwest and a ridge of high pressure to the south and east.
Fred slowly intensified on August 15 as it moved northeastward through the eastern Gulf of Mexico in the direction of the Florida panhandle with maximum sustained winds increasing to 50 mph by late in the evening. By 7:30 am CDT on the morning of the 16th, NHC reported that Fred’s maximum sustained winds had increased to 60 mph, making it a strong tropical storm. Fred was now just 80 miles south of Apalachicola, Florida and moving north.
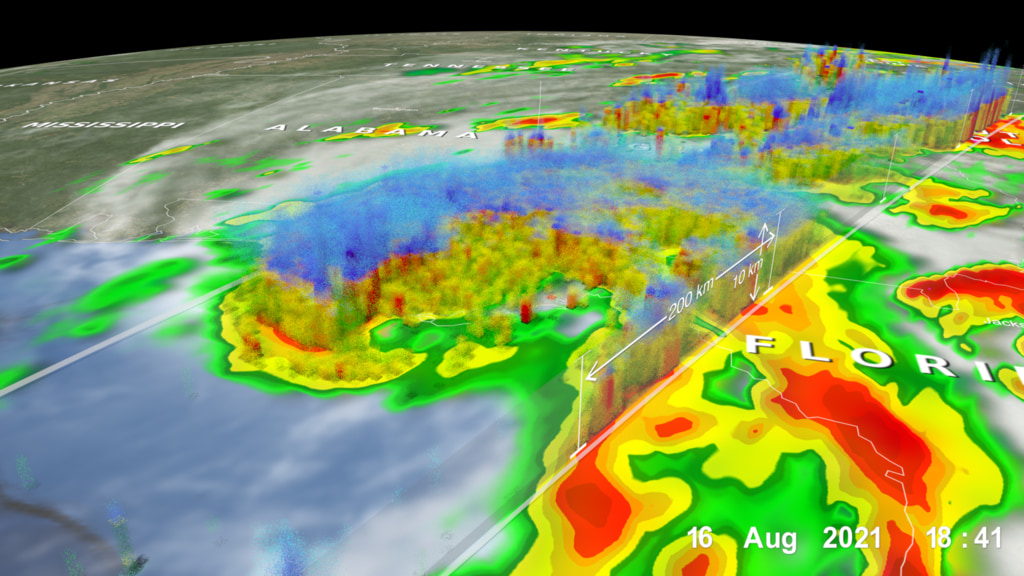
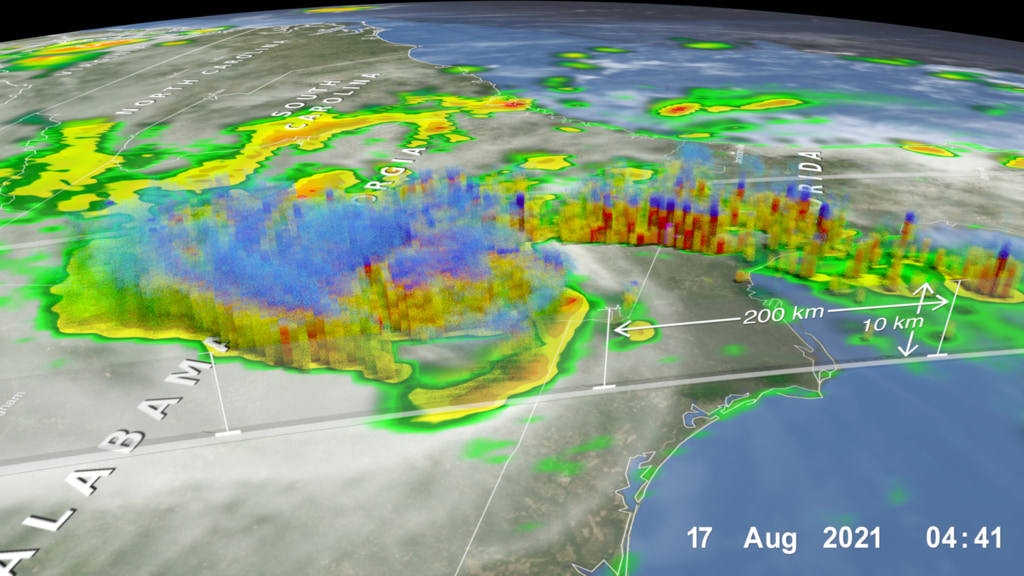
Several hours later at 18:41 UTC (1:41 pm CDT), just before the storm center made landfall, the NASA / JAXA GPM Core Observatory satellite flew over Fred, capturing 3D data on the structure and intensity of precipitation within the storm. The above animation shows a detailed look into Fred from GPM. Rainfall rates derived from the GPM Microwave Imager (GMI) and Dual-frequency Precipitation Radar (DPR) show heavy rainbands (in red and orange) wrapping up around the eastern, northern and western sides of the storm. This pattern, coupled with the intense rain rates (shown in magenta) and tall towers (shown in the blue shading) just west of the center, suggests that Fred was poised for further strengthening. Fred made landfall shortly after the time of the GPM overpass at 19:15 UTC (2:15 pm CDT) near Cape San Blas, Florida with sustained winds of 65 mph. Precipitation data derived from the Integrated Multi-satellitE Retrievals for GPM (IMERG) show half-hourly rainfall estimates for the surrounding region leading up to the GPM overpass.
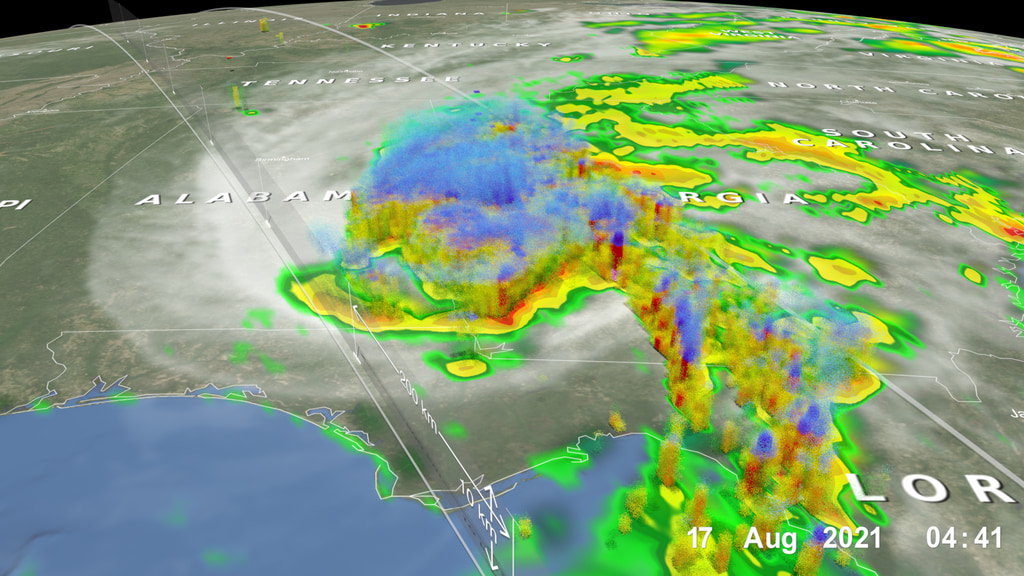
After making landfall, Fred tracked northward across the Florida panhandle and into far southeastern Alabama. At this time, the GPM Core Observatory overflew Fred once again. This next animation shows Fred later that evening at 04:41 UTC 17 August (11:41 pm CDT 16 August) preceded again by IMERG rainfall estimates. Once over land, tropical storms and hurricanes usually weaken steadily and GPM shows that Fred’s circulation has begun to diminish with the bulk of the rain now occurring on the eastern side of the center, which is located over far southeastern Alabama near the Georgia border. Banding is still evident, and Fred was still a tropical storm, but its sustained winds were now reported at 40 mph by NHC. After this, Fred continued to track generally northward across northern Georgia and up along the western side of the Appalachians, bringing plenty of tropical moisture with it. Fred has brought widespread amounts of generally 2 to 4 inches of rain along its path with locally higher amounts upwards of 8 inches. This has led to flooding in parts of the Appalachians, especially in western North Carolina where multiple roads and bridges were reported to be washed out. Fred is also being blamed for several tornadoes across the Southeast and one indirect fatality in Florida.
GPM data is archived at https://pps.gsfc.nasa.gov/


NASA/JAXA GPM Satellite Sees Tropical Storm Fred Make Florida Landfall
Despite the warm waters in the Caribbean, Fred’s nearly constant interaction with land and wind shear over the next few days limited any development. After Fred’s initial landfall as a tropical storm along the south coast of the Dominican Republic on the afternoon of August 11th, the storm tracked directly across the mountainous terrain of Hispaniola and weakened to a tropical depression. The center re-emerged over water on the 12th, but a combination of westerly and southwesterly wind shear and a track close to the north coast of Cuba kept Fred from redeveloping. Then, after encountering more shear while moving across western Cuba on the 13th, Fred further weakened before finally emerging into the southeast Gulf of Mexico as an open wave on the 14th. It takes time for a disorganized tropical system to re-strengthen, and the 14th saw increasing thunderstorm activity and slow re-organization. However, by the morning of August 15th, NHC found that the system had once again become a tropical storm. Now located in the east-central Gulf approximately due west of Fort Myers, Florida, Fred was in the process of recurving to the north due to an upper-level trough of low pressure to the northwest and a ridge of high pressure to the south and east.
Fred slowly intensified on August 15 as it moved northeastward through the eastern Gulf of Mexico in the direction of the Florida panhandle with maximum sustained winds increasing to 50 mph by late in the evening. By 7:30 am CDT on the morning of the 16th, NHC reported that Fred’s maximum sustained winds had increased to 60 mph, making it a strong tropical storm. Fred was now just 80 miles south of Apalachicola, Florida and moving north.
Several hours later at 18:41 UTC (1:41 pm CDT), just before the storm center made landfall, the NASA / JAXA GPM Core Observatory satellite flew over Fred, capturing 3D data on the structure and intensity of precipitation within the storm. The above animation shows a detailed look into Fred from GPM. Rainfall rates derived from the GPM Microwave Imager (GMI) and Dual-frequency Precipitation Radar (DPR) show heavy rainbands (in red and orange) wrapping up around the eastern, northern and western sides of the storm. This pattern, coupled with the intense rain rates (shown in magenta) and tall towers (shown in the blue shading) just west of the center, suggests that Fred was poised for further strengthening. Fred made landfall shortly after the time of the GPM overpass at 19:15 UTC (2:15 pm CDT) near Cape San Blas, Florida with sustained winds of 65 mph. Precipitation data derived from the Integrated Multi-satellitE Retrievals for GPM (IMERG) show half-hourly rainfall estimates for the surrounding region leading up to the GPM overpass.
After making landfall, Fred tracked northward across the Florida panhandle and into far southeastern Alabama. At this time, the GPM Core Observatory overflew Fred once again. This next animation shows Fred later that evening at 04:41 UTC 17 August (11:41 pm CDT 16 August) preceded again by IMERG rainfall estimates. Once over land, tropical storms and hurricanes usually weaken steadily and GPM shows that Fred’s circulation has begun to diminish with the bulk of the rain now occurring on the eastern side of the center, which is located over far southeastern Alabama near the Georgia border. Banding is still evident, and Fred was still a tropical storm, but its sustained winds were now reported at 40 mph by NHC. After this, Fred continued to track generally northward across northern Georgia and up along the western side of the Appalachians, bringing plenty of tropical moisture with it. Fred has brought widespread amounts of generally 2 to 4 inches of rain along its path with locally higher amounts upwards of 8 inches. This has led to flooding in parts of the Appalachians, especially in western North Carolina where multiple roads and bridges were reported to be washed out. Fred is also being blamed for several tornadoes across the Southeast and one indirect fatality in Florida.
GPM data is archived at https://pps.gsfc.nasa.gov/
Related
Visualization Credits
Alex Kekesi (Global Science and Technology, Inc.): Lead Data Visualizer
Greg Shirah (NASA/GSFC): Data Visualizer
Scott Braun (NASA/GSFC): Lead Scientist
George Huffman (NASA/GSFC): Lead Scientist
Ryan Fitzgibbons (USRA): Producer
Stephen Lang (SSAI): Lead Writer
Jacob Reed (Telophase): Writer
Greg Shirah (NASA/GSFC): Data Visualizer
Scott Braun (NASA/GSFC): Lead Scientist
George Huffman (NASA/GSFC): Lead Scientist
Ryan Fitzgibbons (USRA): Producer
Stephen Lang (SSAI): Lead Writer
Jacob Reed (Telophase): Writer
Please give credit for this item to:
NASA's Scientific Visualization Studio
NASA's Scientific Visualization Studio
Short URL to share this page:
https://svs.gsfc.nasa.gov/4926
Mission:
Global Precipitation Measurement (GPM)
Data Used:
Note: While we identify the data sets used in these visualizations, we do not store any further details nor the data sets themselves on our site.
This item is part of this series:
GPM Animations
Keywords:
DLESE >> Atmospheric science
DLESE >> Hydrology
DLESE >> Natural hazards
SVS >> Tropical Storm
GCMD >> Earth Science >> Atmosphere >> Atmospheric Phenomena >> Hurricanes
GCMD >> Earth Science >> Atmosphere >> Precipitation >> Rain
GCMD >> Location >> Florida
SVS >> Hyperwall
NASA Science >> Earth
NASA Earth Science Focus Areas >> Weather and Atmospheric Dynamics
GCMD keywords can be found on the Internet with the following citation: Olsen, L.M., G. Major, K. Shein, J. Scialdone, S. Ritz, T. Stevens, M. Morahan, A. Aleman, R. Vogel, S. Leicester, H. Weir, M. Meaux, S. Grebas, C.Solomon, M. Holland, T. Northcutt, R. A. Restrepo, R. Bilodeau, 2013. NASA/Global Change Master Directory (GCMD) Earth Science Keywords. Version 8.0.0.0.0
https://svs.gsfc.nasa.gov/4926
Mission:
Global Precipitation Measurement (GPM)
Data Used:
CPC (Climate Prediction Center) Cloud Composite
Data Compilation - Climate Prediction Center (CPC) - 8/15/2021 - 8/17/2021
Global cloud cover from multiple satellites
GPM/GMI/Surface Precipitation also referred to as: Rain Rates
8/16/2021 18:35 - 18:40Z, 8/17/2021 4:20 - 4:25Z
Credit:
Data provided by the joint NASA/JAXA GPM mission.
Data provided by the joint NASA/JAXA GPM mission.
GPM/DPR/Ku also referred to as: Volumetric Precipitation data
Observed Data - JAXA - 8/16/2021 18:11 - 18:41Z, 8/17/2021 4:11 - 4:41Z
Credit:
Data provided by the joint NASA/JAXA GPM mission.
Data provided by the joint NASA/JAXA GPM mission.
also referred to as: IMERG
Data Compilation - NASA/GSFC - 8/15/2021 - 8/17/2021This item is part of this series:
GPM Animations
Keywords:
DLESE >> Atmospheric science
DLESE >> Hydrology
DLESE >> Natural hazards
SVS >> Tropical Storm
GCMD >> Earth Science >> Atmosphere >> Atmospheric Phenomena >> Hurricanes
GCMD >> Earth Science >> Atmosphere >> Precipitation >> Rain
GCMD >> Location >> Florida
SVS >> Hyperwall
NASA Science >> Earth
NASA Earth Science Focus Areas >> Weather and Atmospheric Dynamics
GCMD keywords can be found on the Internet with the following citation: Olsen, L.M., G. Major, K. Shein, J. Scialdone, S. Ritz, T. Stevens, M. Morahan, A. Aleman, R. Vogel, S. Leicester, H. Weir, M. Meaux, S. Grebas, C.Solomon, M. Holland, T. Northcutt, R. A. Restrepo, R. Bilodeau, 2013. NASA/Global Change Master Directory (GCMD) Earth Science Keywords. Version 8.0.0.0.0


