Earth
ID: 4844
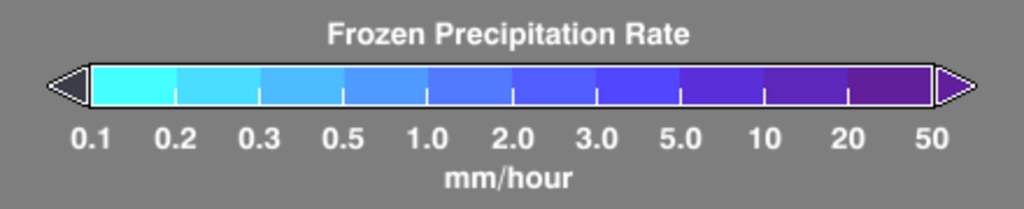
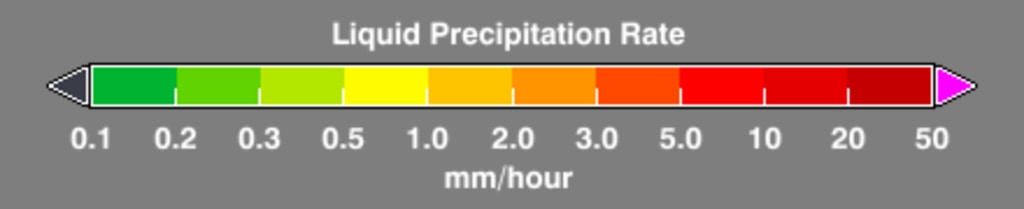
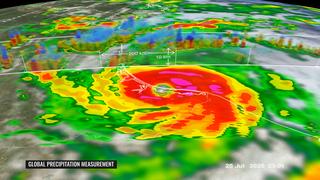
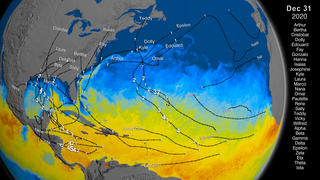
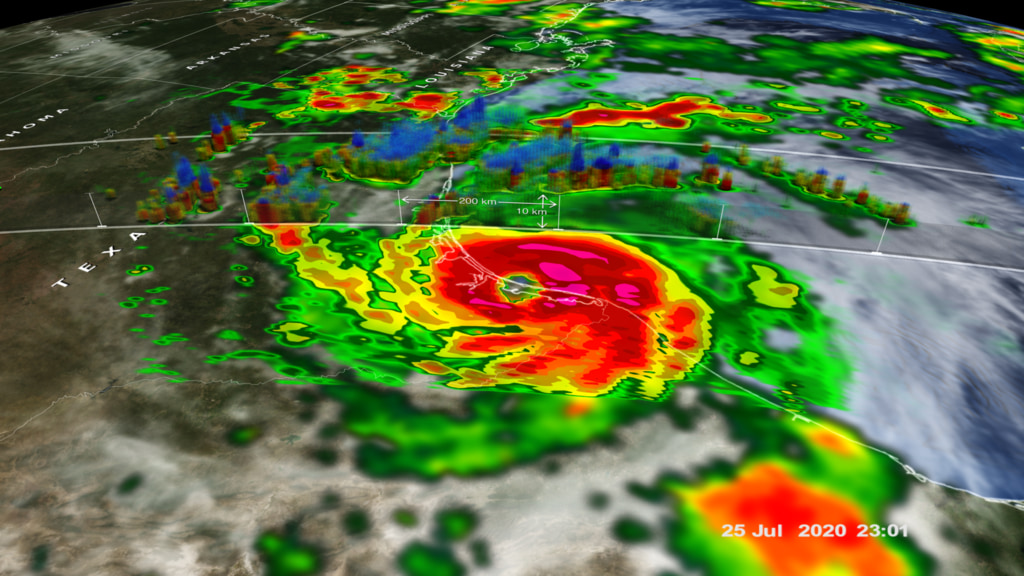
After forming from a tropical easterly wave in the central Gulf of Mexico, Tropical Depression #8 had intensified enough by the evening of July 21st to be named Tropical Storm Hanna by the National Hurricane Center (NHC) and in the process became the earliest 8th named storm in an Atlantic season on record. As Hanna made its way westward from the central Gulf towards the South Texas coastline, it was constantly being monitored by an array of satellites. This animation shows Hanna’s progression from a tropical storm in the western Gulf of Mexico to a strong Category 1 hurricane at landfall on the South Texas coast using NASA’s IMERG rainfall product. With IMERG, precipitation estimates from the GPM core satellite are used to calibrate precipitation estimates from microwave and IR sensors on other satellites to produce half-hourly precipitation maps at 0.1o horizontal resolution. The start of the animation shows Tropical Storm Hanna on the evening of July 24th spinning counterclockwise in the western Gulf. Hanna’s surface rainfall pattern is rather asymmetric with a broad area of heavy rain southeast of the center with several rainbands wrapping up into the northern Gulf Coast on the east side of the storm. As Hanna continues westward towards Texas, the storm becomes more symmetric with heavy rain starting to wrap around the eastern side of the storm while an eye develops, both of which indicate that the storm is intensifying. Indeed, on the morning of July 25th, NHC reported that Hanna had reached hurricane intensity, becoming the first of the season. Hannah continued to strengthen until making landfall later that same day around 5 pm (CDT) over Padre Island as a strong Category 1 storm with sustained winds reported at 90 mph by NHC. This is reflected in the final part of the animation, which shows an overpass from the GPM core satellite, which overflew the storm around 22:26 UTC (5:26 pm CDT) just after it made landfall. Here rainfall rates derived directly from the GPM Microwave Instrument (or GMI) provide a detailed look into Hanna and show a very well-defined eye surrounded by a complete eyewall containing heavy to very heavy rain rates in nearly every quadrant of the storm. These structural characteristics reflect a strong, well-defined circulation and suggest Hanna quite likely would have reached Category 2 intensity had it remained over open water much longer.
GPM data is archived at https://pps.gsfc.nasa.gov/
NASA follows Hanna to the South Texas Coast
GPM data is archived at https://pps.gsfc.nasa.gov/
Used Elsewhere In
Related
Visualization Credits
Alex Kekesi (Global Science and Technology, Inc.): Lead Data Visualizer
Greg Shirah (NASA/GSFC): Lead Data Visualizer
George Huffman (NASA/GSFC): Lead Scientist
Dalia B Kirschbaum (NASA/GSFC): Lead Scientist
Ryan Fitzgibbons (USRA): Lead Producer
Jefferson Beck (USRA): Lead Producer
Stephen Lang (SSAI): Lead Writer
Greg Shirah (NASA/GSFC): Lead Data Visualizer
George Huffman (NASA/GSFC): Lead Scientist
Dalia B Kirschbaum (NASA/GSFC): Lead Scientist
Ryan Fitzgibbons (USRA): Lead Producer
Jefferson Beck (USRA): Lead Producer
Stephen Lang (SSAI): Lead Writer
Please give credit for this item to:
NASA's Scientific Visualization Studio
NASA's Scientific Visualization Studio
Short URL to share this page:
https://svs.gsfc.nasa.gov/4844
Mission:
Global Precipitation Measurement (GPM)
Data Used:
Note: While we identify the data sets used in these visualizations, we do not store any further details nor the data sets themselves on our site.
This item is part of this series:
GPM Animations
Keywords:
DLESE >> Atmospheric science
DLESE >> Hydrology
DLESE >> Natural hazards
GCMD >> Earth Science >> Atmosphere >> Atmospheric Phenomena >> Hurricanes
GCMD >> Earth Science >> Atmosphere >> Precipitation >> Rain
SVS >> Hyperwall
NASA Science >> Earth
GCMD >> Earth Science >> Human Dimensions >> Natural Hazards >> Floods
NASA Earth Science Focus Areas >> Weather and Atmospheric Dynamics
GCMD keywords can be found on the Internet with the following citation: Olsen, L.M., G. Major, K. Shein, J. Scialdone, S. Ritz, T. Stevens, M. Morahan, A. Aleman, R. Vogel, S. Leicester, H. Weir, M. Meaux, S. Grebas, C.Solomon, M. Holland, T. Northcutt, R. A. Restrepo, R. Bilodeau, 2013. NASA/Global Change Master Directory (GCMD) Earth Science Keywords. Version 8.0.0.0.0
https://svs.gsfc.nasa.gov/4844
Mission:
Global Precipitation Measurement (GPM)
Data Used:
CPC (Climate Prediction Center) Cloud Composite
Data Compilation - Climate Prediction Center (CPC) - 7/24/2020 - 7/25/2020
Global cloud cover from multiple satellites
GPM/GMI/Surface Precipitation also referred to as: Rain Rates
7/25/2020 21:28-23:01Z
Credit:
Data provided by the joint NASA/JAXA GPM mission.
Data provided by the joint NASA/JAXA GPM mission.
GPM/DPR/Ku also referred to as: Volumetric Precipitation data
Observed Data - JAXA - 7/25/2020 21:28-23:01Z
Credit:
Data provided by the joint NASA/JAXA GPM mission.
Data provided by the joint NASA/JAXA GPM mission.
also referred to as: IMERG
Data Compilation - NASA/GSFC - 7/24/2020 - 7/25/2020This item is part of this series:
GPM Animations
Keywords:
DLESE >> Atmospheric science
DLESE >> Hydrology
DLESE >> Natural hazards
GCMD >> Earth Science >> Atmosphere >> Atmospheric Phenomena >> Hurricanes
GCMD >> Earth Science >> Atmosphere >> Precipitation >> Rain
SVS >> Hyperwall
NASA Science >> Earth
GCMD >> Earth Science >> Human Dimensions >> Natural Hazards >> Floods
NASA Earth Science Focus Areas >> Weather and Atmospheric Dynamics
GCMD keywords can be found on the Internet with the following citation: Olsen, L.M., G. Major, K. Shein, J. Scialdone, S. Ritz, T. Stevens, M. Morahan, A. Aleman, R. Vogel, S. Leicester, H. Weir, M. Meaux, S. Grebas, C.Solomon, M. Holland, T. Northcutt, R. A. Restrepo, R. Bilodeau, 2013. NASA/Global Change Master Directory (GCMD) Earth Science Keywords. Version 8.0.0.0.0


