Earth
ID: 4681
Hurricane Florence originally formed from an African Easterly wave that emerged off the west coast of Africa back on the 30th of August. When it reached the vicinity of the Cape Verde Islands the next day, it was organized enough to become a tropical depression. The following day the depression strengthened enough to become a tropical storm and Florence was born on the 1st of September. Over the next 3 days, Florence gradually strengthened as it moved in a general west-northwest direction into the central Atlantic. Then, on the 4th of September, Florence began to rapidly intensify. By the morning of the 5th, Florence was a Category 3 hurricane before reaching Category 4 intensity later that afternoon with maximum sustained winds estimated at 130 mph by the National Hurricane Center (NHC). At this point, Florence became the victim of increasingly strong southwesterly wind shear, which greatly weakened the storm all the way back down to a tropical storm the by evening of the 6th.
The following GOES-East Infrared (IR) loop shows Florence from 17:54 UTC (1:54 pm EDT) 6 September to 19:27 UTC (3:27 pm EDT) 7 September when it was struggling against the strong southwesterly wind shear in the Central Atlantic. A very interesting looking feature is the arc-shaped cloud that propagates outward from the storm towards the west. This cloud feature is occurring at upper-levels and is likely tied to a gravity wave propagating outward from an area of intense convection that erupted from deep within the storm. When the tops of these smaller scale storms within a storm reach the upper troposphere, they can trigger gravity waves. As these waves progagate outward they can enhance cloud formation where they induce rising motion and erode cloud where they induce downward motion or subsidence. As this arc-shaped cloud is able to propagate outward uniformly from the center, it must be occurring above the shear layer. Compensating areas of subsidence can also surround the strong rising motion occurring within the tall convective clouds. This can help to erode surrounding clouds and may be contributing to the clearing that occurs between the arc-shaped cloud and the main
area of convection.
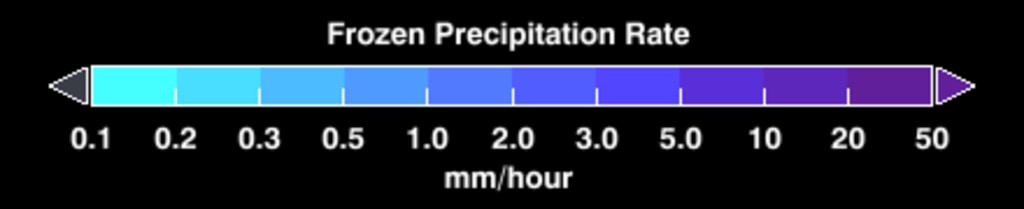
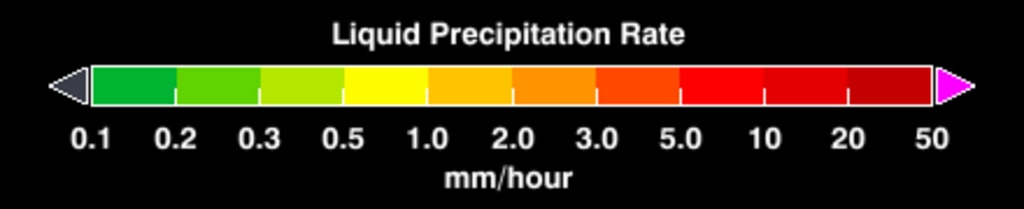
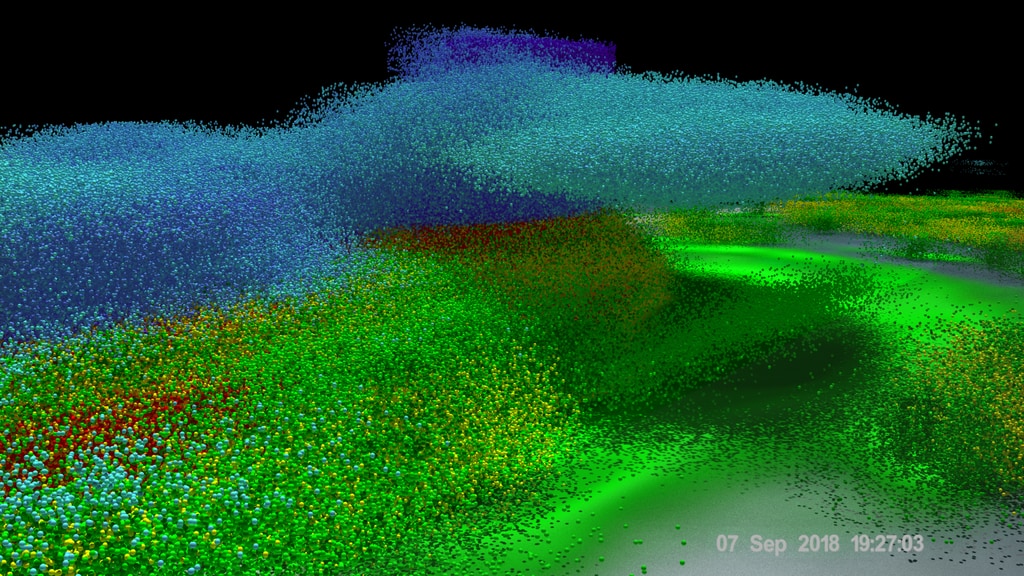
The end of the loop shows surface rainfall and a 3D flyby of Florence courtesy of the GPM core satellite, which passed over the storm at around 19:21 UTC (3:21 pm EDT) on the 7th. At the surface, two areas of intense rain (shown in magenta) reveal the presence of two areas of strong thunderstorms within Florence north and northeast of the center. The flyby shows a 3D rendering of the radar structure of the storm. The darker blue tower indicates an area of deep convection that has penetrated well over 10 km high and is associated with the southernmost area of intense rain just north of the center. It is these areas of deep convection that fuel the storm by releasing heat, known as latent heat, mainly from condensation, near the core. Although it would be nearly 2 days before Florence re-gained hurricane intensity, these convective towers are what helped Florence to survive the effects of the wind shear and eventually grow back into a Category 4 hurricane.
GPM is a joint mission between NASA and the Japanese space agency JAXA.
Caption by Stephen Lang (SSAI/NASA GSFC) and Joe Munchak (GSFC).
A short 360 video flying under Florence is available here:
Look for a longer narrated 360 video flying through Hurricane Maria in the coming weeks!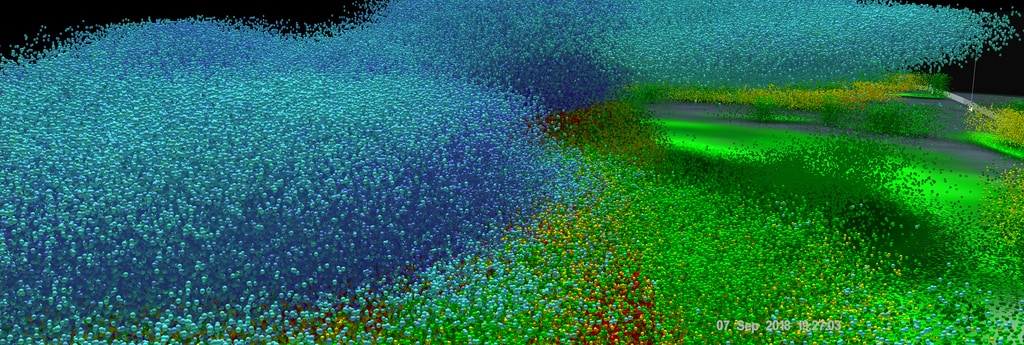
GOES and GPM Capture Florence Trying to Intensify Over the Atlantic
The following GOES-East Infrared (IR) loop shows Florence from 17:54 UTC (1:54 pm EDT) 6 September to 19:27 UTC (3:27 pm EDT) 7 September when it was struggling against the strong southwesterly wind shear in the Central Atlantic. A very interesting looking feature is the arc-shaped cloud that propagates outward from the storm towards the west. This cloud feature is occurring at upper-levels and is likely tied to a gravity wave propagating outward from an area of intense convection that erupted from deep within the storm. When the tops of these smaller scale storms within a storm reach the upper troposphere, they can trigger gravity waves. As these waves progagate outward they can enhance cloud formation where they induce rising motion and erode cloud where they induce downward motion or subsidence. As this arc-shaped cloud is able to propagate outward uniformly from the center, it must be occurring above the shear layer. Compensating areas of subsidence can also surround the strong rising motion occurring within the tall convective clouds. This can help to erode surrounding clouds and may be contributing to the clearing that occurs between the arc-shaped cloud and the main
area of convection.
The end of the loop shows surface rainfall and a 3D flyby of Florence courtesy of the GPM core satellite, which passed over the storm at around 19:21 UTC (3:21 pm EDT) on the 7th. At the surface, two areas of intense rain (shown in magenta) reveal the presence of two areas of strong thunderstorms within Florence north and northeast of the center. The flyby shows a 3D rendering of the radar structure of the storm. The darker blue tower indicates an area of deep convection that has penetrated well over 10 km high and is associated with the southernmost area of intense rain just north of the center. It is these areas of deep convection that fuel the storm by releasing heat, known as latent heat, mainly from condensation, near the core. Although it would be nearly 2 days before Florence re-gained hurricane intensity, these convective towers are what helped Florence to survive the effects of the wind shear and eventually grow back into a Category 4 hurricane.
GPM is a joint mission between NASA and the Japanese space agency JAXA.
Caption by Stephen Lang (SSAI/NASA GSFC) and Joe Munchak (GSFC).
A short 360 video flying under Florence is available here:
Look for a longer narrated 360 video flying through Hurricane Maria in the coming weeks!
Used Elsewhere In
Related
Visualization Credits
Greg Shirah (NASA/GSFC): Lead Visualizer
Kel Elkins (USRA): Visualizer
Alex Kekesi (Global Science and Technology, Inc.): Visualizer
George Huffman (NASA/GSFC): Scientist
Dalia B Kirschbaum (NASA/GSFC): Scientist
Rob Gutro (NASA/GSFC): Science Writer
Owen Kelley (George Mason University): Scientist
Laurence Schuler (ADNET Systems, Inc.): Technical Support
Ian Jones (ADNET Systems, Inc.): Technical Support
Stephen Lang (NASA/GSFC): Scientist
Stephen J. Munchak (University of Maryland): Scientist
Please give credit for this item to:
NASA's Scientific Visualization Studio
NASA's Scientific Visualization Studio
Short URL to share this page:
https://svs.gsfc.nasa.gov/4681
Data Used:
Note: While we identify the data sets used in these visualizations, we do not store any further details nor the data sets themselves on our site.
This item is part of this series:
GPM Animations
Keywords:
DLESE >> Atmospheric science
SVS >> GPM
DLESE >> Natural hazards
GCMD >> Earth Science >> Atmosphere >> Precipitation
GCMD >> Earth Science >> Atmosphere >> Atmospheric Phenomena >> Hurricanes
SVS >> Hyperwall
SVS >> Hurricanes >> Natural Hazards
NASA Science >> Earth
SVS >> 360
NASA Earth Science Focus Areas >> Weather and Atmospheric Dynamics
GCMD keywords can be found on the Internet with the following citation: Olsen, L.M., G. Major, K. Shein, J. Scialdone, S. Ritz, T. Stevens, M. Morahan, A. Aleman, R. Vogel, S. Leicester, H. Weir, M. Meaux, S. Grebas, C.Solomon, M. Holland, T. Northcutt, R. A. Restrepo, R. Bilodeau, 2013. NASA/Global Change Master Directory (GCMD) Earth Science Keywords. Version 8.0.0.0.0
https://svs.gsfc.nasa.gov/4681
Data Used:
GOES
09/07/2018 18:27GPM/GMI/Surface Precipitation also referred to as: Rain Rates
09/07/2018 18:27
Credit:
Data provided by the joint NASA/JAXA GPM mission.
Data provided by the joint NASA/JAXA GPM mission.
GPM/DPR/Ku also referred to as: Volumetric Precipitation data
Observed Data - JAXA - 09/07/2018 18:27
Credit:
Data provided by the joint NASA/JAXA GPM mission.
Data provided by the joint NASA/JAXA GPM mission.
also referred to as: IMERG
Data Compilation - NASA/GSFC - 09/07/2018 18:27This item is part of this series:
GPM Animations
Keywords:
DLESE >> Atmospheric science
SVS >> GPM
DLESE >> Natural hazards
GCMD >> Earth Science >> Atmosphere >> Precipitation
GCMD >> Earth Science >> Atmosphere >> Atmospheric Phenomena >> Hurricanes
SVS >> Hyperwall
SVS >> Hurricanes >> Natural Hazards
NASA Science >> Earth
SVS >> 360
NASA Earth Science Focus Areas >> Weather and Atmospheric Dynamics
GCMD keywords can be found on the Internet with the following citation: Olsen, L.M., G. Major, K. Shein, J. Scialdone, S. Ritz, T. Stevens, M. Morahan, A. Aleman, R. Vogel, S. Leicester, H. Weir, M. Meaux, S. Grebas, C.Solomon, M. Holland, T. Northcutt, R. A. Restrepo, R. Bilodeau, 2013. NASA/Global Change Master Directory (GCMD) Earth Science Keywords. Version 8.0.0.0.0


