Earth
ID: 4625
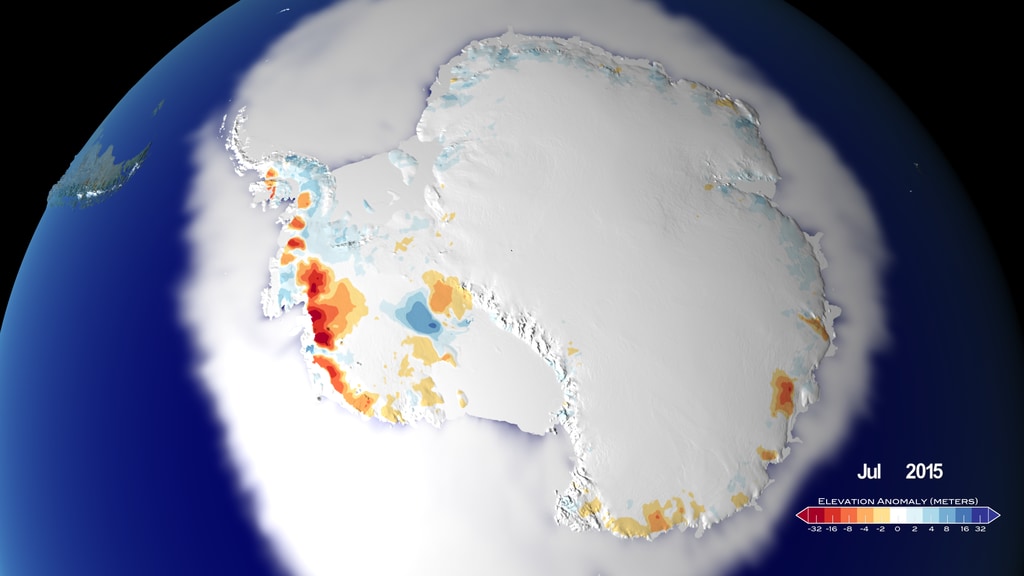
As more and more land ice elevation data is collected in Antarctica, NASA scientists are amassing the vasts amounts of data and using it to track land ice elevation changes over time. This effort is part of the NASA MEaSUReS ITS_LIVE project.
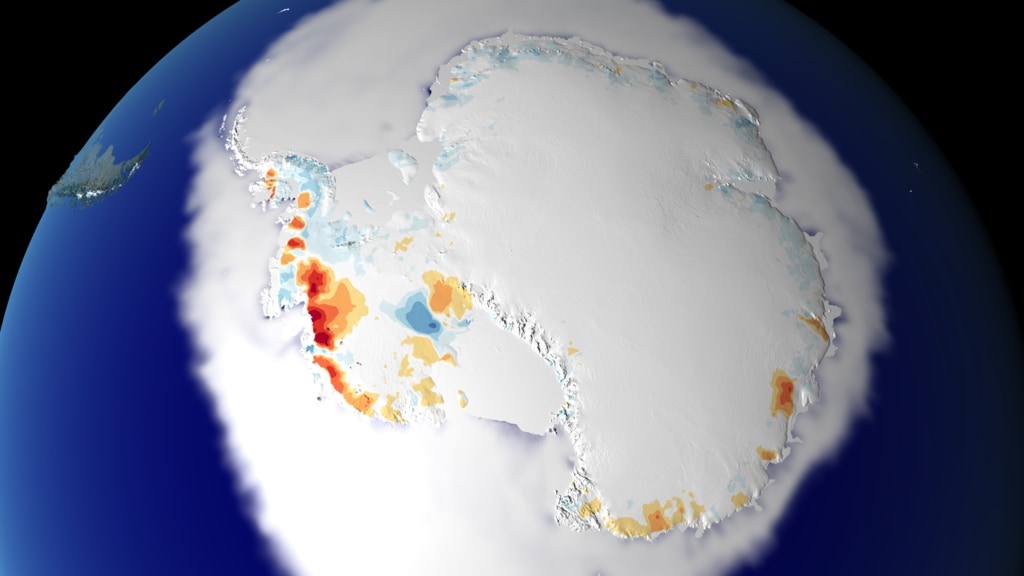
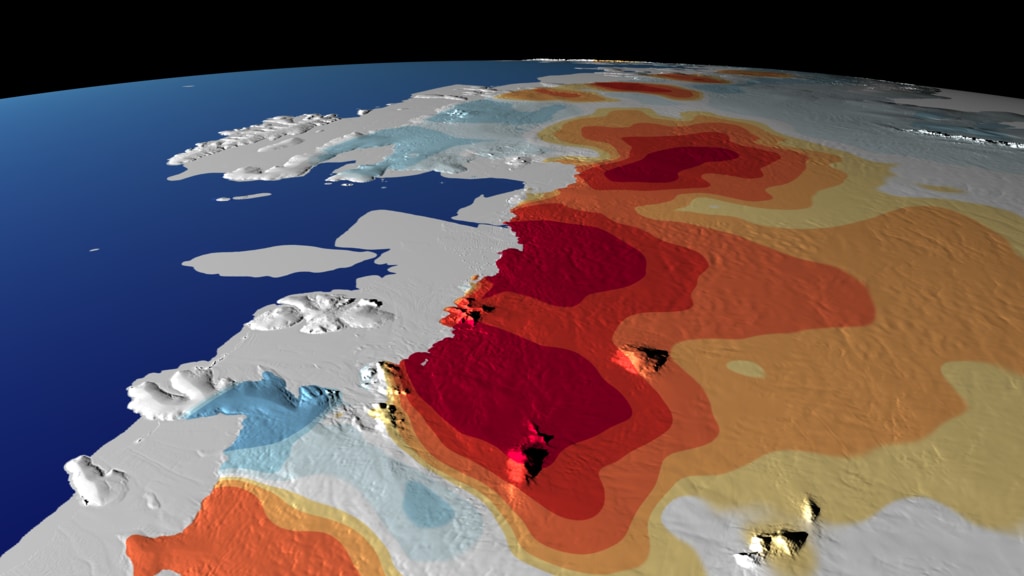
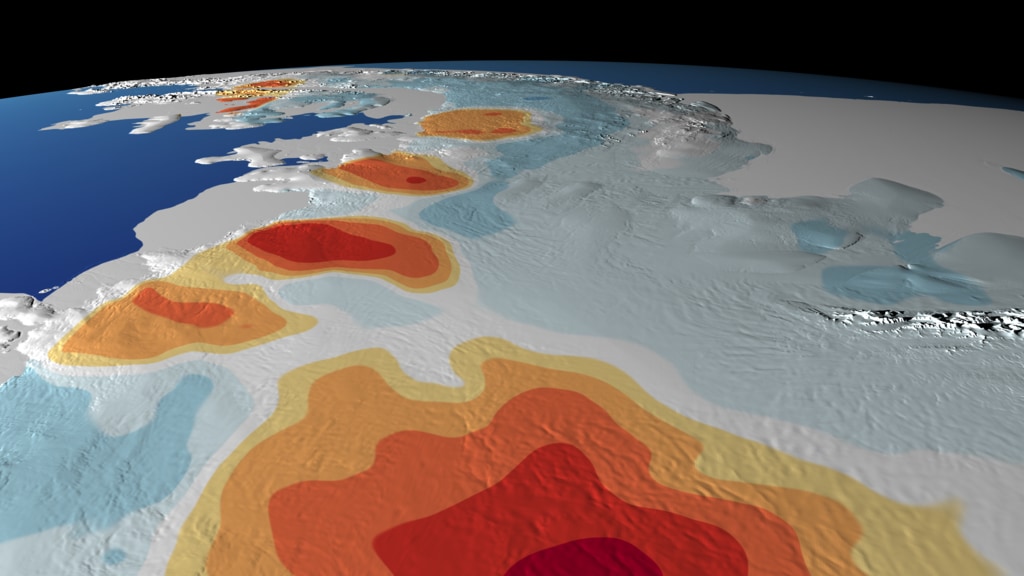
25 Years of Antarctic Land Ice Elevation Change Anomalies (West Coast Fly Over)
Visualization Credits
Alex Kekesi (Global Science and Technology, Inc.): Lead Visualizer
Alex S. Gardner (NASA/JPL CalTech): Lead Scientist
LK Ward (USRA): Lead Producer
Laurence Schuler (ADNET Systems, Inc.): Technical Support
Ian Jones (ADNET Systems, Inc.): Technical Support
Johan Nilsson (JPL): Scientist
Alex S. Gardner (NASA/JPL CalTech): Lead Scientist
LK Ward (USRA): Lead Producer
Laurence Schuler (ADNET Systems, Inc.): Technical Support
Ian Jones (ADNET Systems, Inc.): Technical Support
Johan Nilsson (JPL): Scientist
Please give credit for this item to:
NASA's Scientific Visualization Studio
NASA's Scientific Visualization Studio
Short URL to share this page:
https://svs.gsfc.nasa.gov/4625
Data Used:
Note: While we identify the data sets used in these visualizations, we do not store any further details nor the data sets themselves on our site.
Keywords:
GCMD >> Earth Science >> Cryosphere >> Glaciers/Ice Sheets
GCMD >> Location >> Antarctica
NASA Science >> Earth
GCMD >> Earth Science >> Terrestrial Hydrosphere >> Glaciers/ice Sheets >> Glacier Elevation/ice Sheet Elevation
GCMD keywords can be found on the Internet with the following citation: Olsen, L.M., G. Major, K. Shein, J. Scialdone, S. Ritz, T. Stevens, M. Morahan, A. Aleman, R. Vogel, S. Leicester, H. Weir, M. Meaux, S. Grebas, C.Solomon, M. Holland, T. Northcutt, R. A. Restrepo, R. Bilodeau, 2013. NASA/Global Change Master Directory (GCMD) Earth Science Keywords. Version 8.0.0.0.0
https://svs.gsfc.nasa.gov/4625
Data Used:
Inter-mission Time Series of land Ice Velocity and Elevation also referred to as: ITS_LIVE
Data Compilation - NASA/JPL - 1993-2017Keywords:
GCMD >> Earth Science >> Cryosphere >> Glaciers/Ice Sheets
GCMD >> Location >> Antarctica
NASA Science >> Earth
GCMD >> Earth Science >> Terrestrial Hydrosphere >> Glaciers/ice Sheets >> Glacier Elevation/ice Sheet Elevation
GCMD keywords can be found on the Internet with the following citation: Olsen, L.M., G. Major, K. Shein, J. Scialdone, S. Ritz, T. Stevens, M. Morahan, A. Aleman, R. Vogel, S. Leicester, H. Weir, M. Meaux, S. Grebas, C.Solomon, M. Holland, T. Northcutt, R. A. Restrepo, R. Bilodeau, 2013. NASA/Global Change Master Directory (GCMD) Earth Science Keywords. Version 8.0.0.0.0


