Earth
ID: 4584
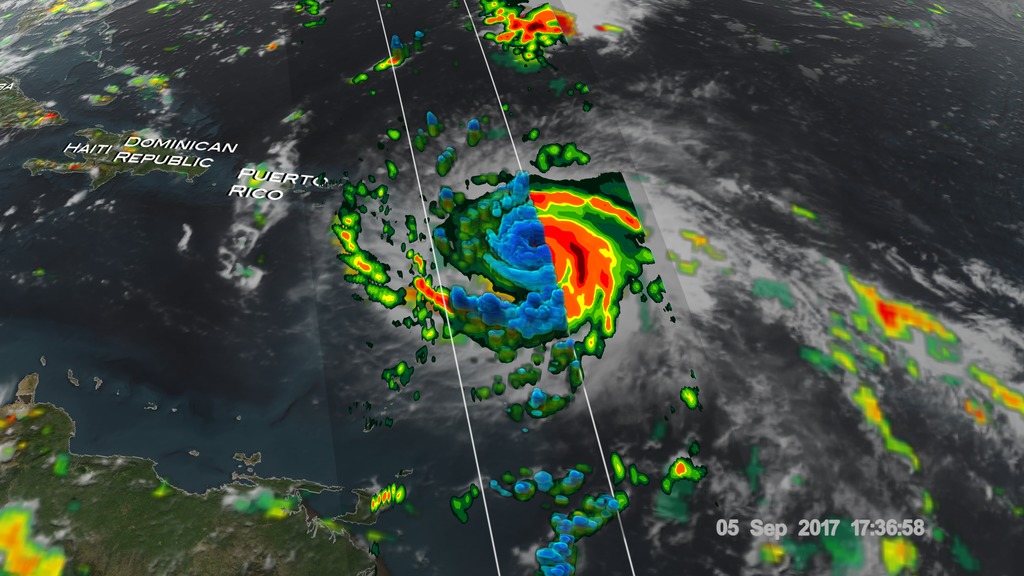
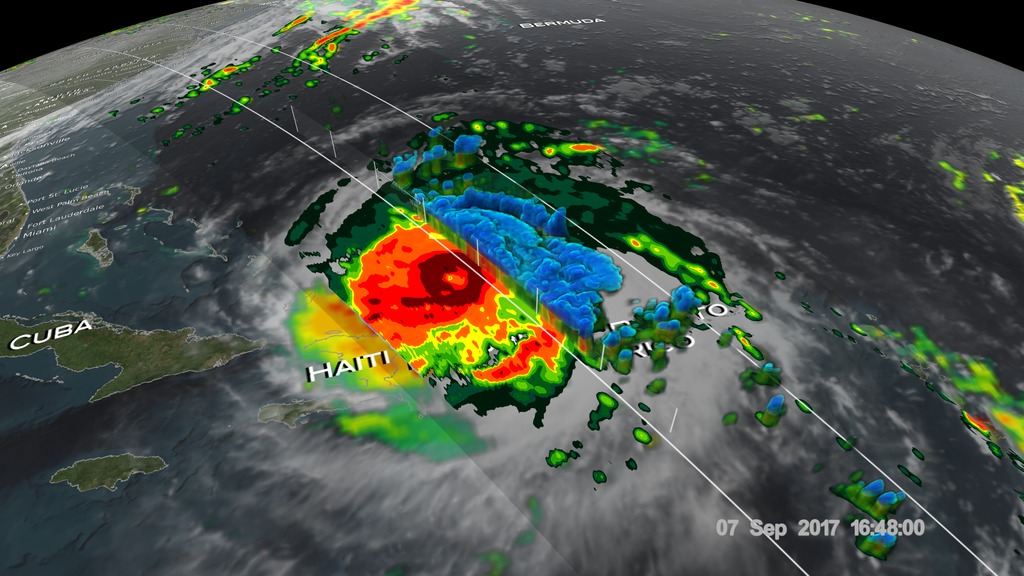
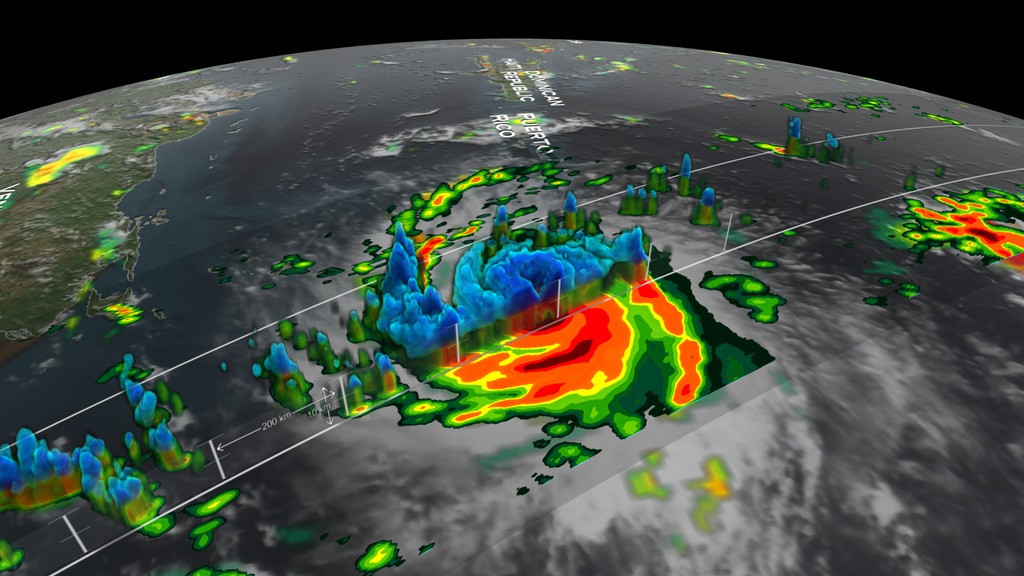
The GPM core observatory satellite had an exceptional view of hurricane Irma's eye when it flew above it on September 5, 2017 at 12:52 PM AST (1652 UTC). This visualization shows a rainfall analysis that was derived from GPM's Microwave Imager (GMI) and Dual-Frequency Precipitation Radar (DPR) data. Irma was approaching the Leeward Islands with maximum sustained winds of about 178 mph (155 kts). This made Irma a dangerous category five hurricane on the Saffir-Simpson hurricane wind scale. Intense rainfall is shown within Irma's nearly circular eye.
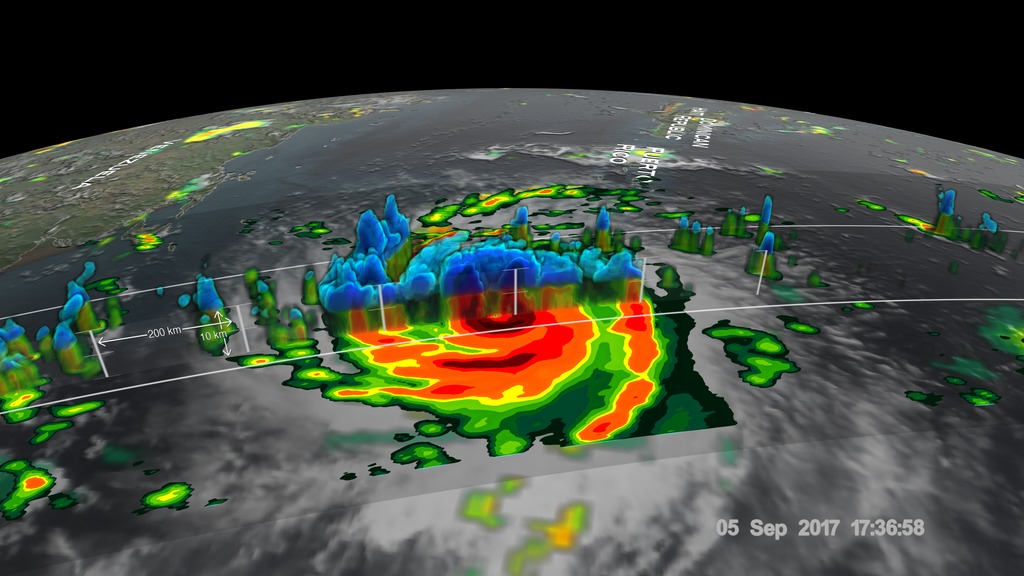
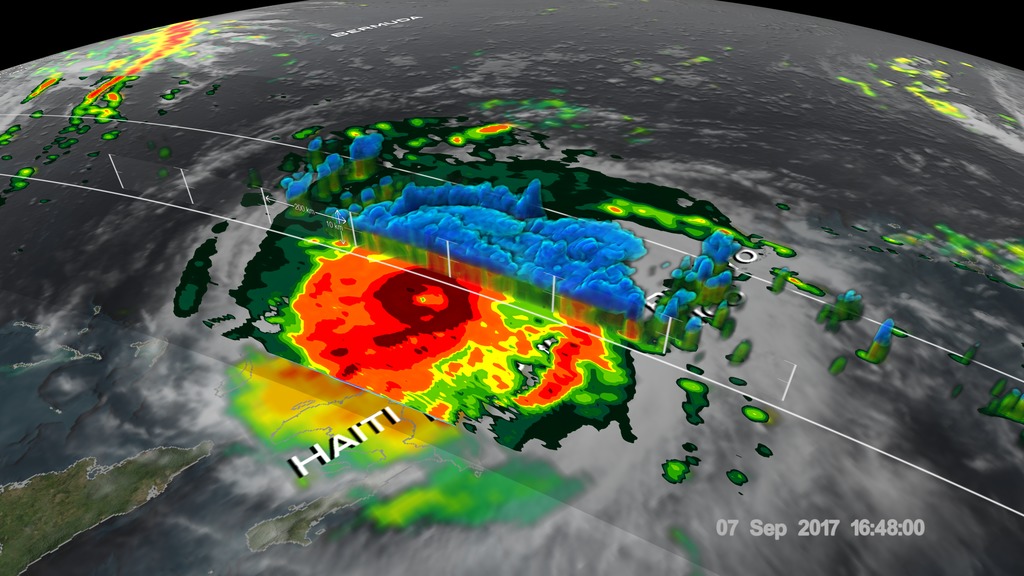
This 3-D cross-section through Irma's eye was constructed using GPM's radar (DPR Ku band) data. GPM's radar revealed that the heavy precipitation rotating around the eye was reaching altitudes greater than 7.75 miles (12.5 km). The tallest thunderstorms were found by GPM's radar in a feeder band that was located to the southwest of Irma's eye. These extreme storms were reaching heights of over 10.0 miles (16.2 km). Intense downpours in the eye wall were found to be returning radar reflectivity values of over 80dBZ to the GPM satellite.
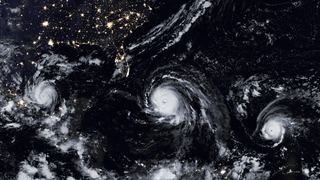
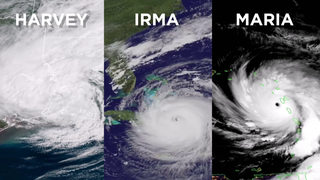
Irma rapidly intensified on September 4-5 as it moved over very warm waters and into an environment will weak vertical wind shear (the change of winds with height). Irma maintained maximum winds of 185 mph for a day and a half, making it one of the longest-lived storms at this intensity. That intensity made it the strongest observed storm over the Atlantic Ocean (excluding the Gulf of Mexico and Caribbean). Irma’s rapid intensification was very similar to Hurricane Harvey's in the Gulf about 10 days earlier.

GPM Examines Hurricane Irma
This 3-D cross-section through Irma's eye was constructed using GPM's radar (DPR Ku band) data. GPM's radar revealed that the heavy precipitation rotating around the eye was reaching altitudes greater than 7.75 miles (12.5 km). The tallest thunderstorms were found by GPM's radar in a feeder band that was located to the southwest of Irma's eye. These extreme storms were reaching heights of over 10.0 miles (16.2 km). Intense downpours in the eye wall were found to be returning radar reflectivity values of over 80dBZ to the GPM satellite.
Irma rapidly intensified on September 4-5 as it moved over very warm waters and into an environment will weak vertical wind shear (the change of winds with height). Irma maintained maximum winds of 185 mph for a day and a half, making it one of the longest-lived storms at this intensity. That intensity made it the strongest observed storm over the Atlantic Ocean (excluding the Gulf of Mexico and Caribbean). Irma’s rapid intensification was very similar to Hurricane Harvey's in the Gulf about 10 days earlier.
Used Elsewhere In
Visualization Credits
Kel Elkins (USRA): Lead Visualizer
Alex Kekesi (Global Science and Technology, Inc.): Visualizer
Horace Mitchell (NASA/GSFC): Visualizer
Ryan Fitzgibbons (USRA): Lead Producer
Gail Skofronick Jackson (NASA/GSFC): Lead Scientist
George Huffman (NASA/GSFC): Lead Scientist
Dalia B Kirschbaum (NASA/GSFC): Lead Scientist
Alex Kekesi (Global Science and Technology, Inc.): Visualizer
Horace Mitchell (NASA/GSFC): Visualizer
Ryan Fitzgibbons (USRA): Lead Producer
Gail Skofronick Jackson (NASA/GSFC): Lead Scientist
George Huffman (NASA/GSFC): Lead Scientist
Dalia B Kirschbaum (NASA/GSFC): Lead Scientist
Please give credit for this item to:
NASA's Scientific Visualization Studio
NASA's Scientific Visualization Studio
Short URL to share this page:
https://svs.gsfc.nasa.gov/4584
Mission:
Global Precipitation Measurement (GPM)
Data Used:
Note: While we identify the data sets used in these visualizations, we do not store any further details nor the data sets themselves on our site.
This item is part of this series:
Hurricanes
Keywords:
DLESE >> Atmospheric science
SVS >> HDTV
DLESE >> Hydrology
DLESE >> Natural hazards
GCMD >> Earth Science >> Atmosphere >> Precipitation
GCMD >> Earth Science >> Atmosphere >> Atmospheric Phenomena >> Hurricanes
GCMD >> Earth Science >> Atmosphere >> Precipitation >> Precipitation Amount
GCMD >> Earth Science >> Atmosphere >> Precipitation >> Precipitation Rate
GCMD >> Earth Science >> Hydrosphere >> Surface Water >> Floods
SVS >> Hyperwall
SVS >> Hurricanes >> Precipitation
NASA Science >> Earth
NASA Earth Science Focus Areas >> Weather and Atmospheric Dynamics
GCMD keywords can be found on the Internet with the following citation: Olsen, L.M., G. Major, K. Shein, J. Scialdone, S. Ritz, T. Stevens, M. Morahan, A. Aleman, R. Vogel, S. Leicester, H. Weir, M. Meaux, S. Grebas, C.Solomon, M. Holland, T. Northcutt, R. A. Restrepo, R. Bilodeau, 2013. NASA/Global Change Master Directory (GCMD) Earth Science Keywords. Version 8.0.0.0.0
https://svs.gsfc.nasa.gov/4584
Mission:
Global Precipitation Measurement (GPM)
Data Used:
GOES/IR4
09/02/2017-09/08/2017GPM/GMI/Surface Precipitation also referred to as: Rain Rates
09/05/2017 16:41:28Z, 09/07/2017 15:37:00Z
Credit:
Data provided by the joint NASA/JAXA GPM mission.
Data provided by the joint NASA/JAXA GPM mission.
GPM/DPR/Ku also referred to as: Volumetric Precipitation data
Observed Data - JAXA - 09/05/2017 16:16:40Z, 09/07/2017 15:56:39Z
Credit:
Data provided by the joint NASA/JAXA GPM mission.
Data provided by the joint NASA/JAXA GPM mission.
also referred to as: IMERG
Data Compilation - NASA/GSFC - 09/02/2017-09/08/2017This item is part of this series:
Hurricanes
Keywords:
DLESE >> Atmospheric science
SVS >> HDTV
DLESE >> Hydrology
DLESE >> Natural hazards
GCMD >> Earth Science >> Atmosphere >> Precipitation
GCMD >> Earth Science >> Atmosphere >> Atmospheric Phenomena >> Hurricanes
GCMD >> Earth Science >> Atmosphere >> Precipitation >> Precipitation Amount
GCMD >> Earth Science >> Atmosphere >> Precipitation >> Precipitation Rate
GCMD >> Earth Science >> Hydrosphere >> Surface Water >> Floods
SVS >> Hyperwall
SVS >> Hurricanes >> Precipitation
NASA Science >> Earth
NASA Earth Science Focus Areas >> Weather and Atmospheric Dynamics
GCMD keywords can be found on the Internet with the following citation: Olsen, L.M., G. Major, K. Shein, J. Scialdone, S. Ritz, T. Stevens, M. Morahan, A. Aleman, R. Vogel, S. Leicester, H. Weir, M. Meaux, S. Grebas, C.Solomon, M. Holland, T. Northcutt, R. A. Restrepo, R. Bilodeau, 2013. NASA/Global Change Master Directory (GCMD) Earth Science Keywords. Version 8.0.0.0.0


