Earth
ID: 4247
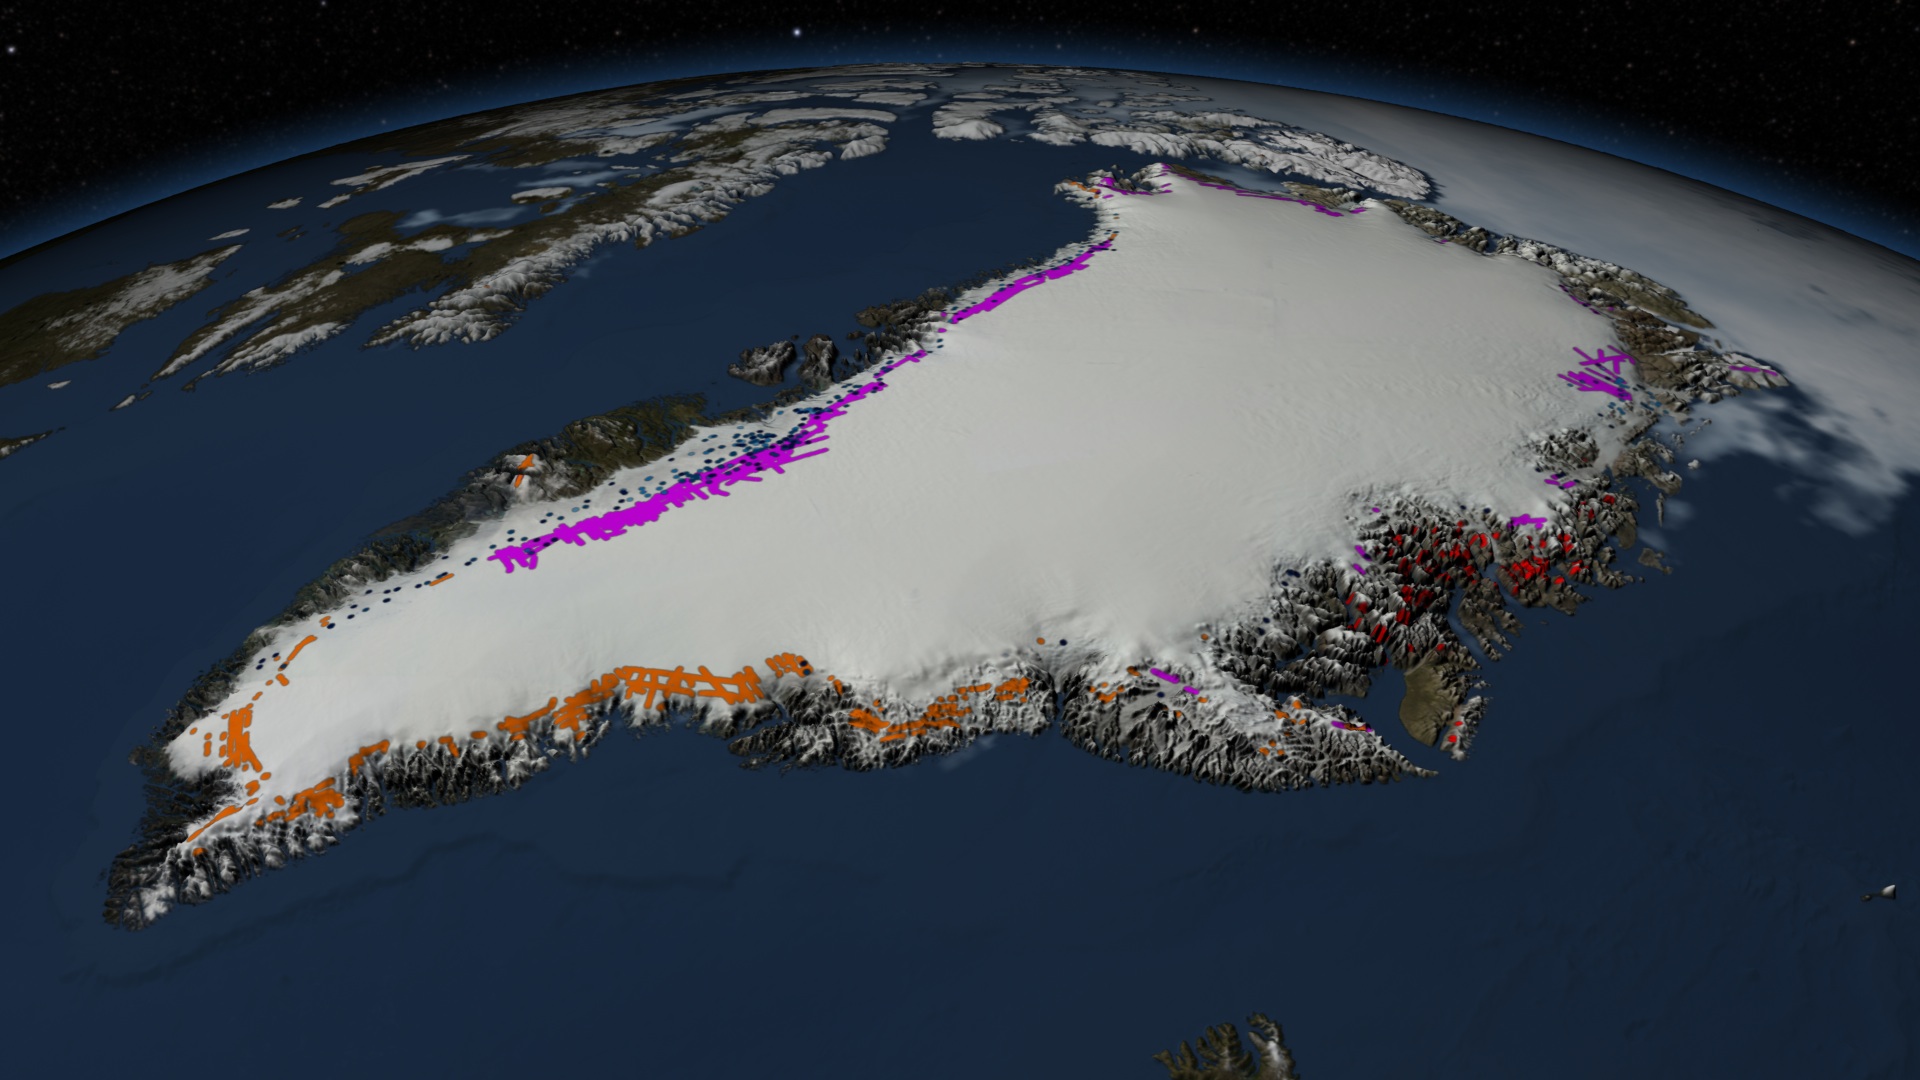
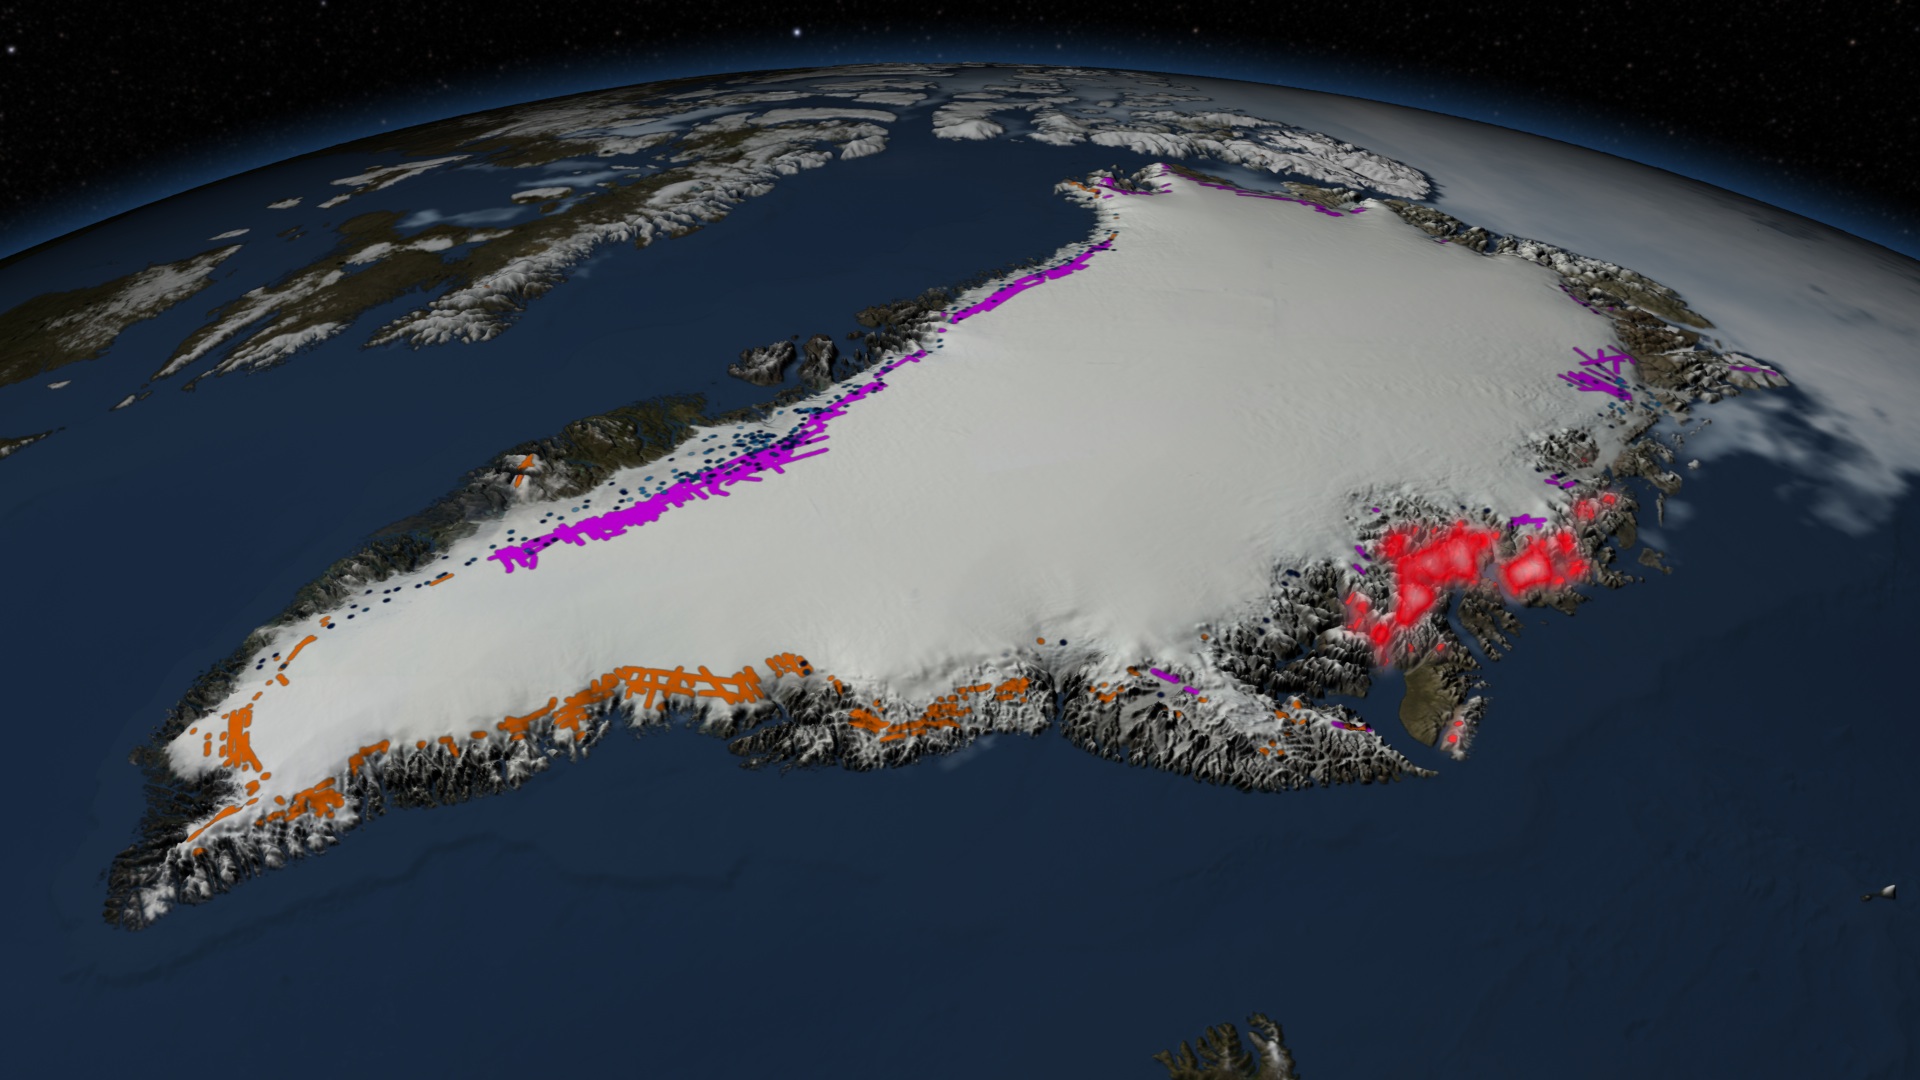
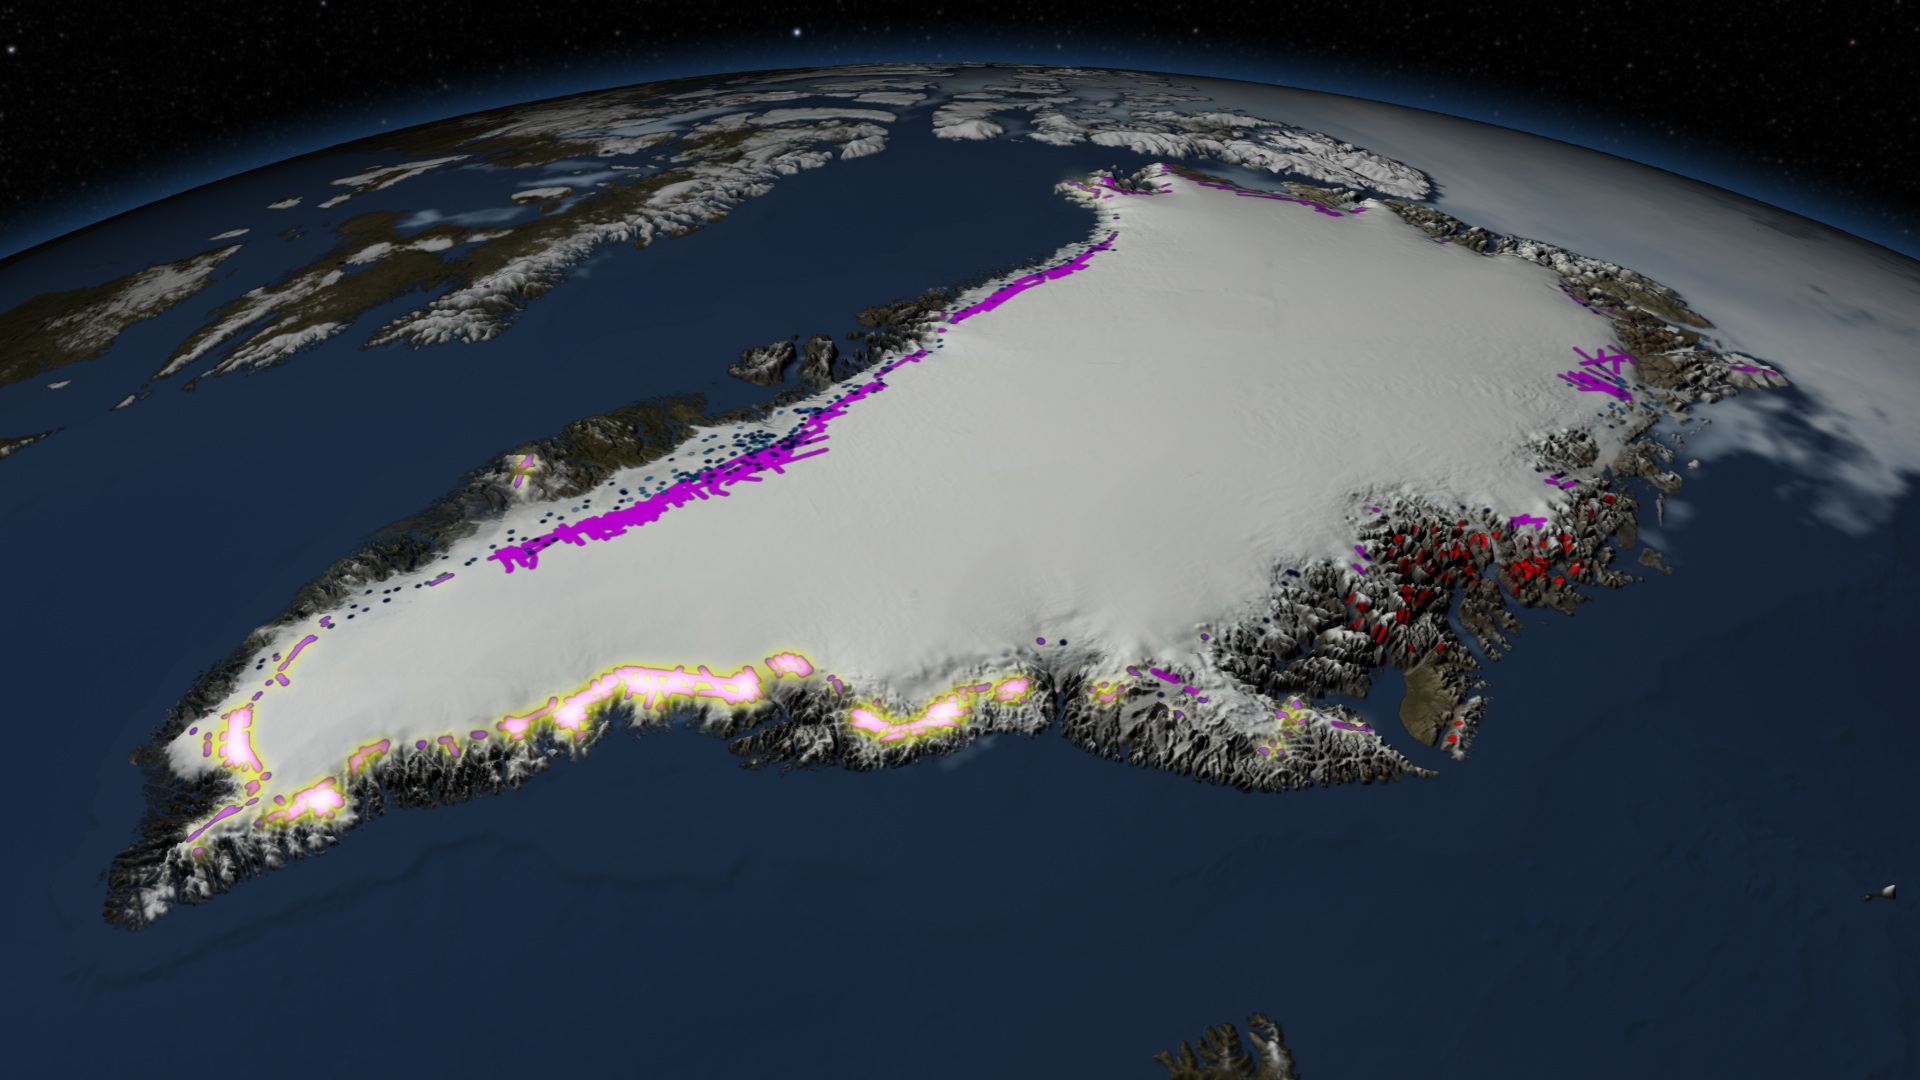
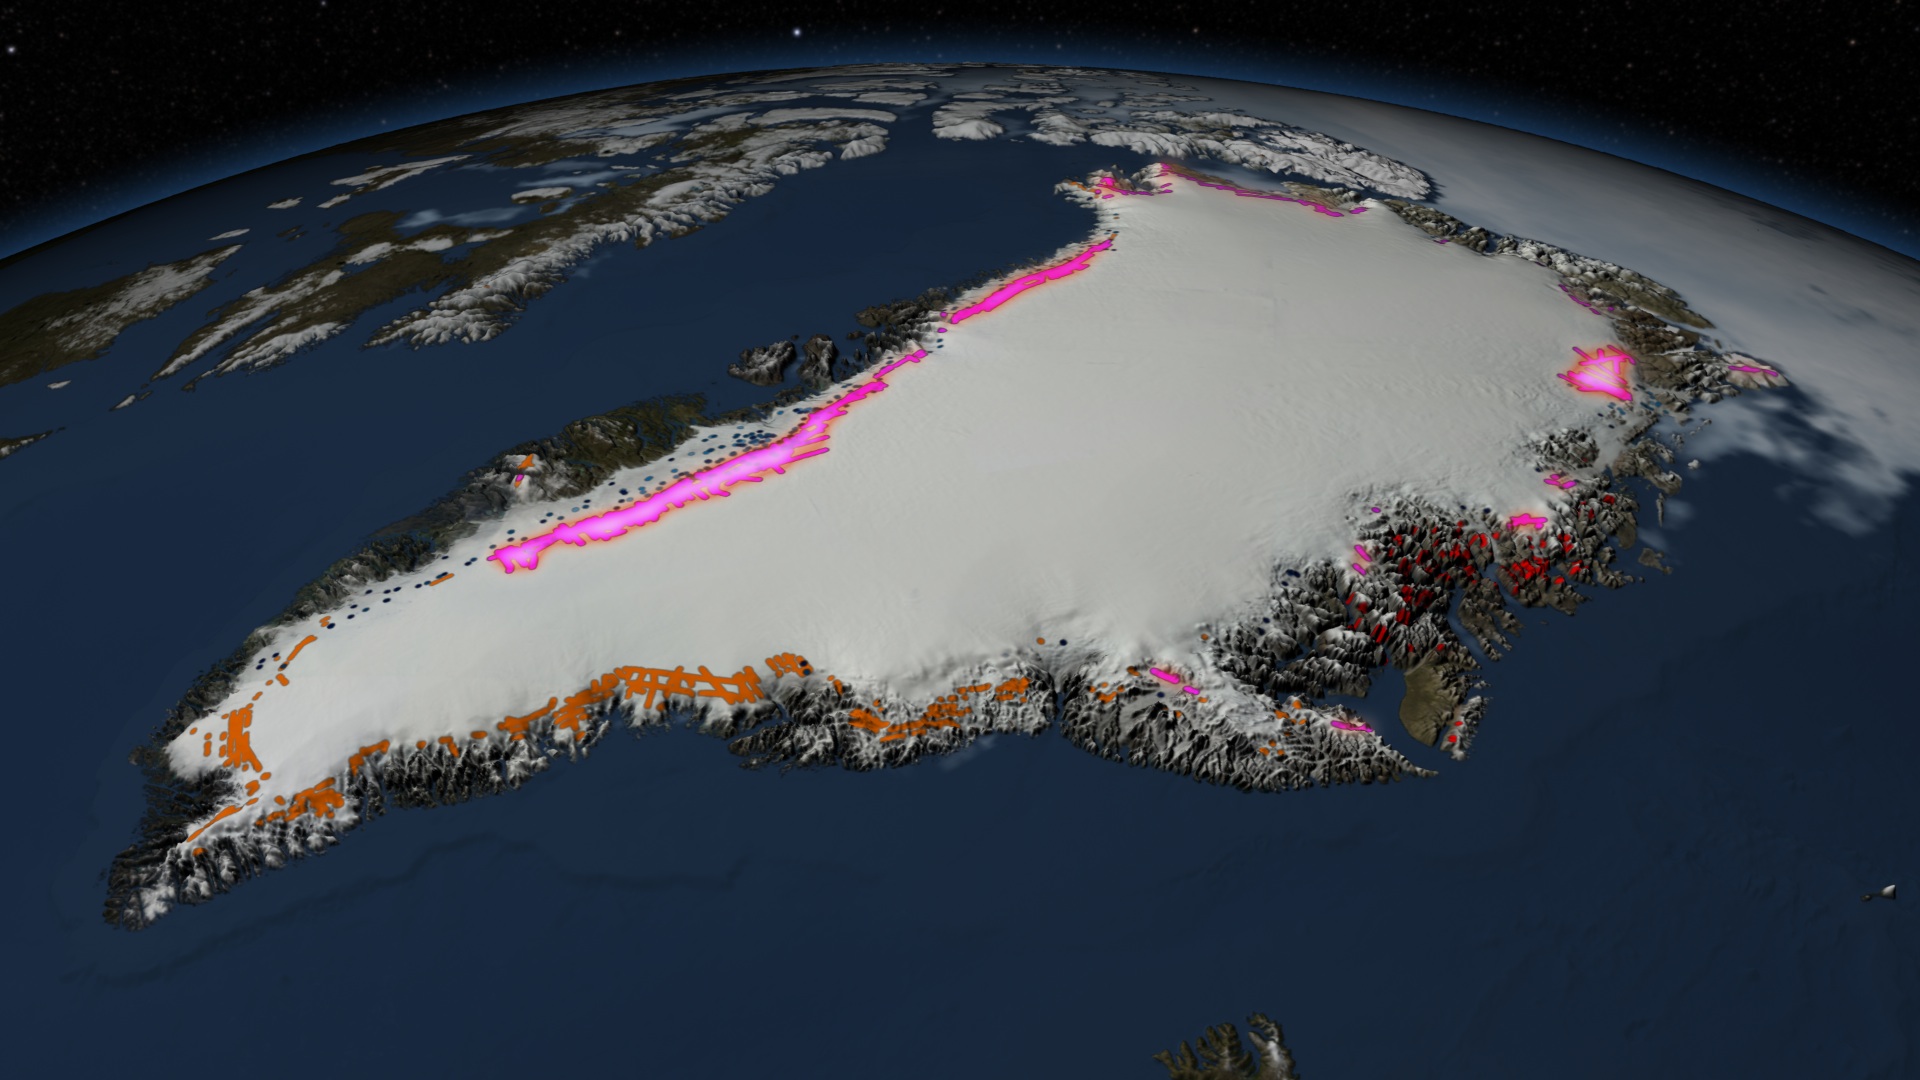
These visualizations were produced in support of the 2014 American Geophysical Union (AGU) Session titled "Surprising Findings in Greenland's Melt Dynamics". The visualization shows each of the Greenland survey areas pertaining to each speakers research topic. Each survey area is color-coded according to the corresponding AGU Session and Speaker.
1.) RED
C018-2: 110 years of local glacier and ice cap changes in Central and North East Greenland - Anders Bjork, Natural History Museum of Denmark
2.) BLUE
C51C-06: Radar Detections of Buried Supraglacial Lakes Across the Greenland Ice Sheet - Lora Koenig, National Snow and Ice Data Center, Cooperative Institute for Research in Environmental Sciences (CIRES) at the University of Colorado Boulder (CU-Boulder)
3.) ORANGE
C025-2: Recent results on the Greenland Aquifer from remote sensing and in situ measurements - Richard Forster, University of Utah
4.) VIOLET
C025-2: Massive Perched Ice Layers in the Shallow Firn of Greenland’s Lower Accumulation Area Inhibit Percolation and Enhance Runoff - Mike MacFerrin, CIRES, CU-Boulder
Greenland Survey Areas
1.) RED
C018-2: 110 years of local glacier and ice cap changes in Central and North East Greenland - Anders Bjork, Natural History Museum of Denmark
2.) BLUE
C51C-06: Radar Detections of Buried Supraglacial Lakes Across the Greenland Ice Sheet - Lora Koenig, National Snow and Ice Data Center, Cooperative Institute for Research in Environmental Sciences (CIRES) at the University of Colorado Boulder (CU-Boulder)
3.) ORANGE
C025-2: Recent results on the Greenland Aquifer from remote sensing and in situ measurements - Richard Forster, University of Utah
4.) VIOLET
C025-2: Massive Perched Ice Layers in the Shallow Firn of Greenland’s Lower Accumulation Area Inhibit Percolation and Enhance Runoff - Mike MacFerrin, CIRES, CU-Boulder
Visualization Credits
Alex Kekesi (Global Science and Technology, Inc.): Lead Animator
Cindy Starr (Global Science and Technology, Inc.): Visualizer
Ernie Wright (USRA): Animator
Alex Kekesi (Global Science and Technology, Inc.): Video Editor
Jefferson Beck (USRA): Producer
Anders Bjork (Natural History Museum of Denmark): Scientist
Richard Forster (University of Utah): Scientist
Mike MacFerrin (CU-Bolder): Scientist
Laurence Schuler (ADNET Systems, Inc.): Project Support
Ian Jones (ADNET Systems, Inc.): Project Support
Lora Koenig (NSIDC): Scientist
Please give credit for this item to:
NASA's Scientific Visualization Studio
NASA's Scientific Visualization Studio
Short URL to share this page:
https://svs.gsfc.nasa.gov/4247
Keywords:
DLESE >> Cryology
SVS >> Melting
GCMD >> Earth Science >> Cryosphere
GCMD >> Location >> Greenland
NASA Science >> Earth
GCMD keywords can be found on the Internet with the following citation: Olsen, L.M., G. Major, K. Shein, J. Scialdone, S. Ritz, T. Stevens, M. Morahan, A. Aleman, R. Vogel, S. Leicester, H. Weir, M. Meaux, S. Grebas, C.Solomon, M. Holland, T. Northcutt, R. A. Restrepo, R. Bilodeau, 2013. NASA/Global Change Master Directory (GCMD) Earth Science Keywords. Version 8.0.0.0.0


