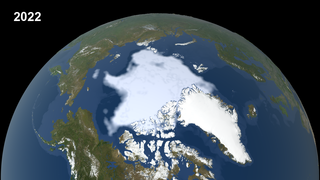
Earth
ID: 3991
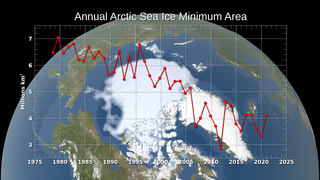
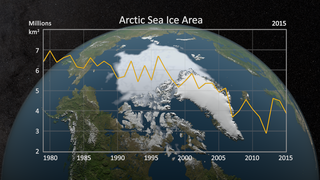
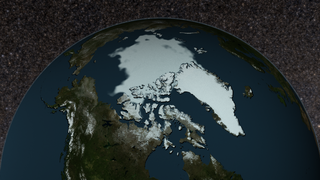
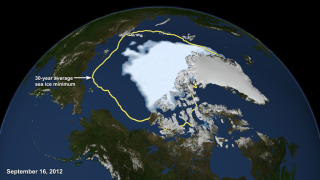
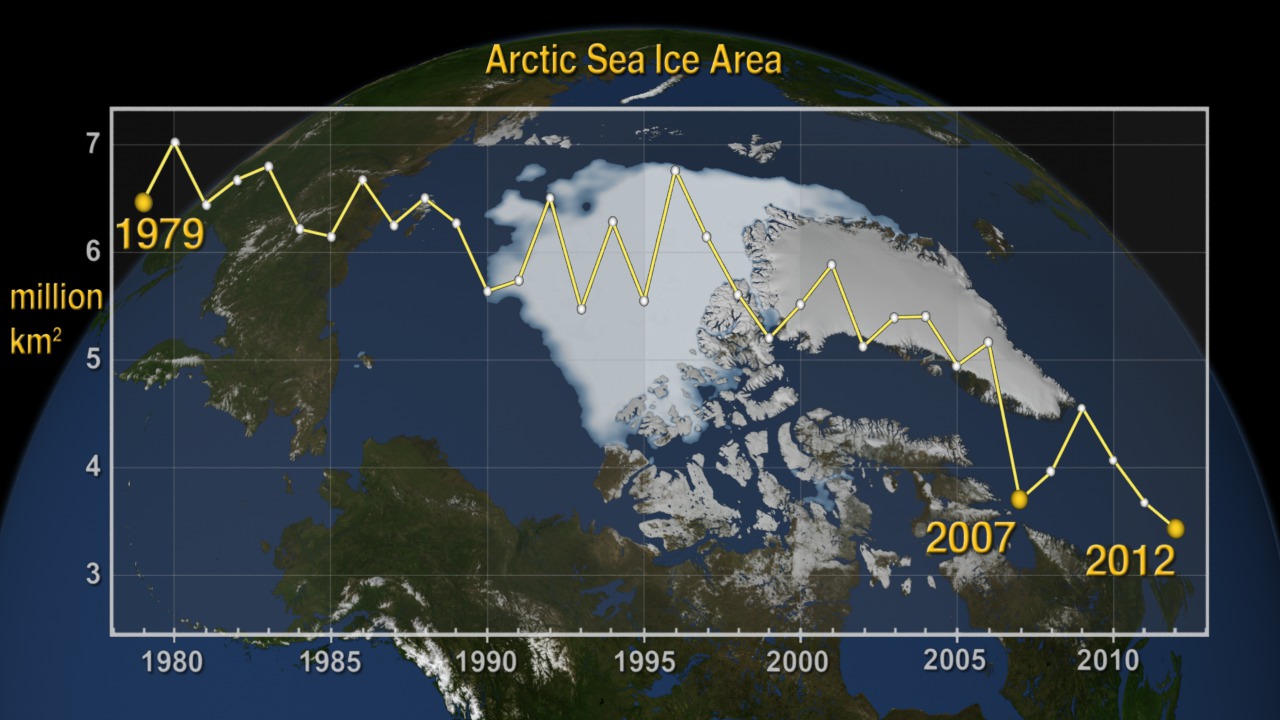
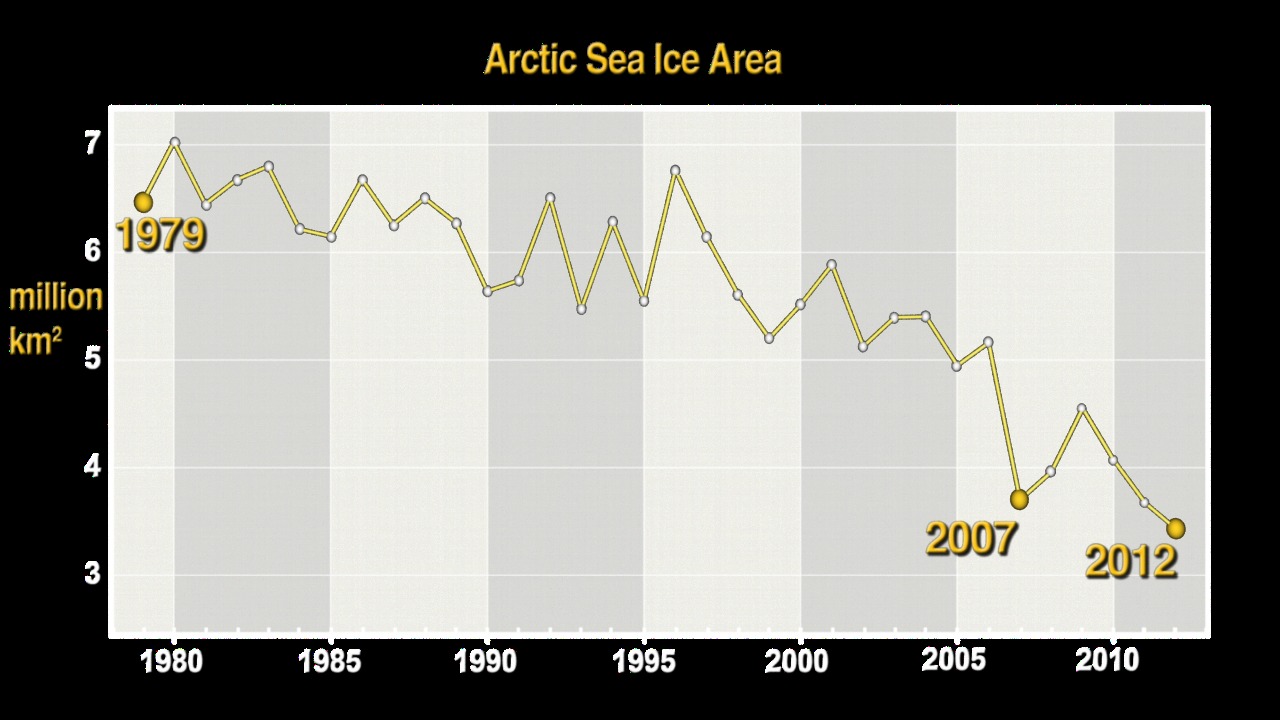
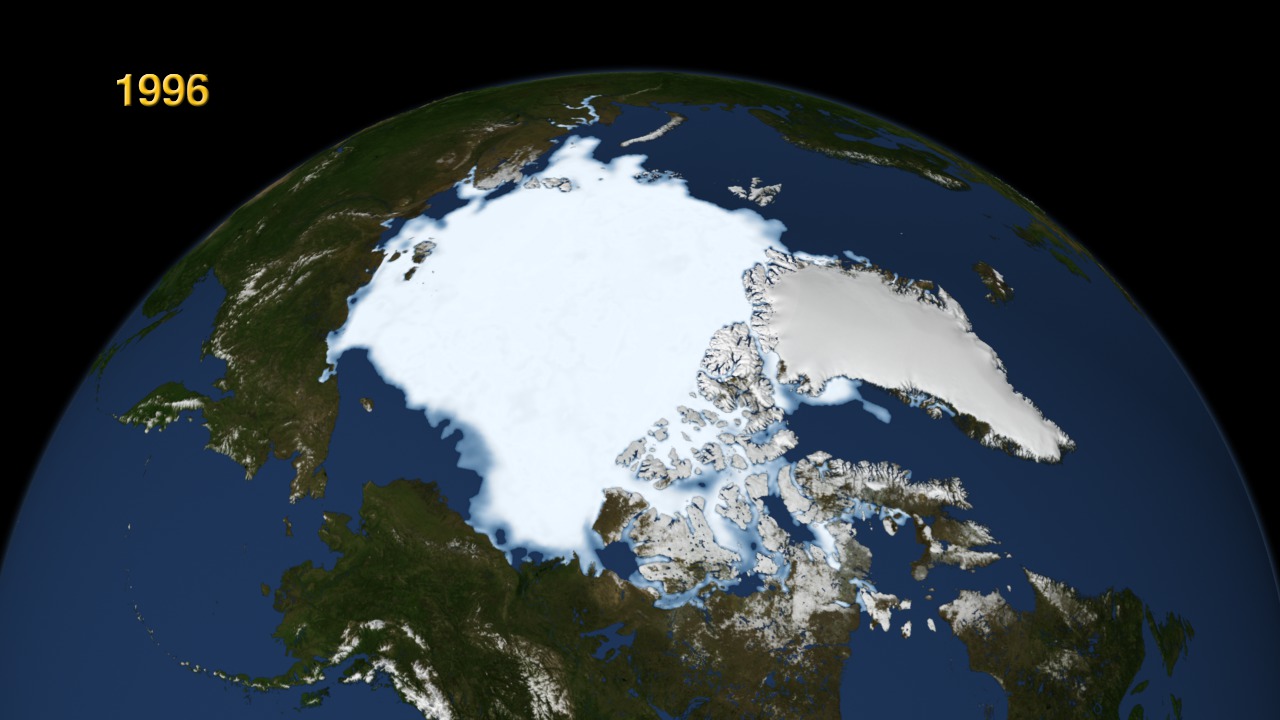
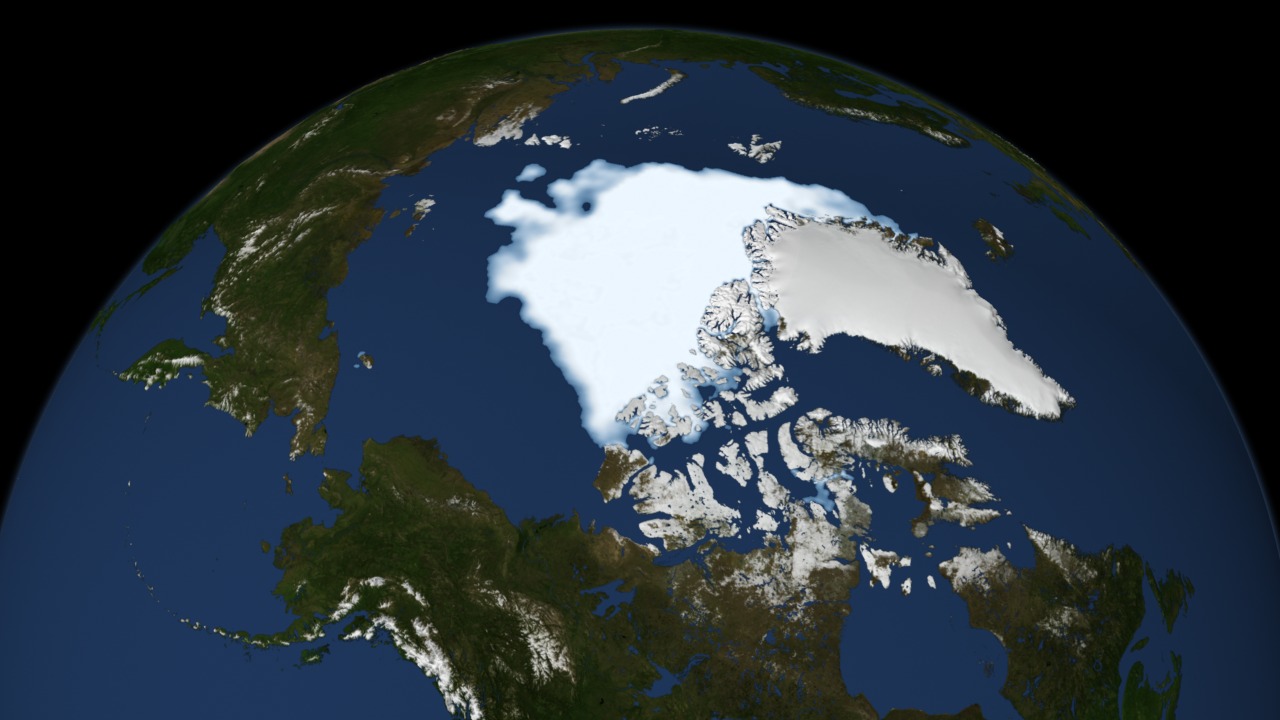
The continued significant reduction in the area covered by the summer sea ice is a dramatic illustration of the pronounced impact increased global temperatures are having on the Arctic regions. There has also been a significant reduction in the relative amount of older, thicker ice. Satellite-based passive microwave images of the sea ice cover have provided a reliable tool for continuously monitoring changes in the Arctic ice cover since 1979. The ice parameters derived from satellite ice concentration data that are most relevant to climate change studies are sea ice extent and ice area. This visualization shows the annual September minimum sea ice area in the background and a graph of the ice area values foreground. The ice area provides the total area actually covered by sea ice which is useful for estimating the total volume and therefore mass, given the average ice thickness. For more information about these ice datasets, see The Journal of Geophysical Research VOL. 113, C02S07, doi:10.1029/2007JC004257, 2008
Sea Ice Yearly Minimum 1979-2012 (SSMI data) with Graph
There is a newer version of this story located here: https://svs.gsfc.nasa.gov/5170
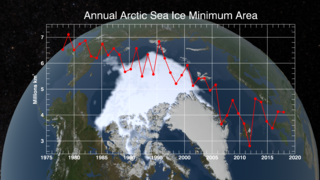
This visualization shows the annual Arctic sea ice minimum from 1979 to 2012. A semi-transparent graph is overlaid that shows the area in million square kilometers for each year's minimum day. The '1979', '2007', and '2012' data points are highlighted on the graph.
For high resolution still images of the 1979 and 2012 September sea ice minimum, see visualization #3998.
Newer Versions


Related
Visualization Credits
Cindy Starr (Global Science and Technology, Inc.): Lead Visualizer
Greg Shirah (NASA/GSFC): Animator
Lori Perkins (NASA/GSFC): Animator
Jefferson Beck (USRA): Producer
Patrick Lynch (Wyle Information Systems): Producer
Josefino Comiso (NASA/GSFC): Scientist
Robert Gersten (Wyle Information Systems): Scientist
Laurence Schuler (ADNET Systems, Inc.): Project Support
Ian Jones (ADNET Systems, Inc.): Project Support
Please give credit for this item to:
NASA/Goddard Space Flight Center Scientific Visualization Studio
The Blue Marble data is courtesy of Reto Stockli (NASA/GSFC).
NASA/Goddard Space Flight Center Scientific Visualization Studio
The Blue Marble data is courtesy of Reto Stockli (NASA/GSFC).
Short URL to share this page:
https://svs.gsfc.nasa.gov/3991
Data Used:
Note: While we identify the data sets used in these visualizations, we do not store any further details nor the data sets themselves on our site.
This item is part of this series:
Arctic Annual Sea Ice Minimum with Graph Overlay
Keywords:
DLESE >> Cryology
SVS >> HDTV
GCMD >> Earth Science >> Cryosphere >> Sea Ice
GCMD >> Earth Science >> Cryosphere >> Sea Ice >> Sea Ice Concentration
GCMD >> Earth Science >> Oceans >> Sea Ice >> Sea Ice Concentration
SVS >> Hyperwall
NASA Science >> Earth
GCMD keywords can be found on the Internet with the following citation: Olsen, L.M., G. Major, K. Shein, J. Scialdone, S. Ritz, T. Stevens, M. Morahan, A. Aleman, R. Vogel, S. Leicester, H. Weir, M. Meaux, S. Grebas, C.Solomon, M. Holland, T. Northcutt, R. A. Restrepo, R. Bilodeau, 2013. NASA/Global Change Master Directory (GCMD) Earth Science Keywords. Version 8.0.0.0.0
https://svs.gsfc.nasa.gov/3991
Data Used:
Comiso's September Minimum Sea Ice Concentration
Data Compilation - NASA/GSFC - 1979 - 2012DMSP/SSM/I
1979 - 2012
Defense Meteorological Satellite Program Special Sensor Microwave Imager
DMSP/SSM/I/Sea Ice Concentration
1979 - 2012This item is part of this series:
Arctic Annual Sea Ice Minimum with Graph Overlay
Keywords:
DLESE >> Cryology
SVS >> HDTV
GCMD >> Earth Science >> Cryosphere >> Sea Ice
GCMD >> Earth Science >> Cryosphere >> Sea Ice >> Sea Ice Concentration
GCMD >> Earth Science >> Oceans >> Sea Ice >> Sea Ice Concentration
SVS >> Hyperwall
NASA Science >> Earth
GCMD keywords can be found on the Internet with the following citation: Olsen, L.M., G. Major, K. Shein, J. Scialdone, S. Ritz, T. Stevens, M. Morahan, A. Aleman, R. Vogel, S. Leicester, H. Weir, M. Meaux, S. Grebas, C.Solomon, M. Holland, T. Northcutt, R. A. Restrepo, R. Bilodeau, 2013. NASA/Global Change Master Directory (GCMD) Earth Science Keywords. Version 8.0.0.0.0


