Earth
ID: 3152
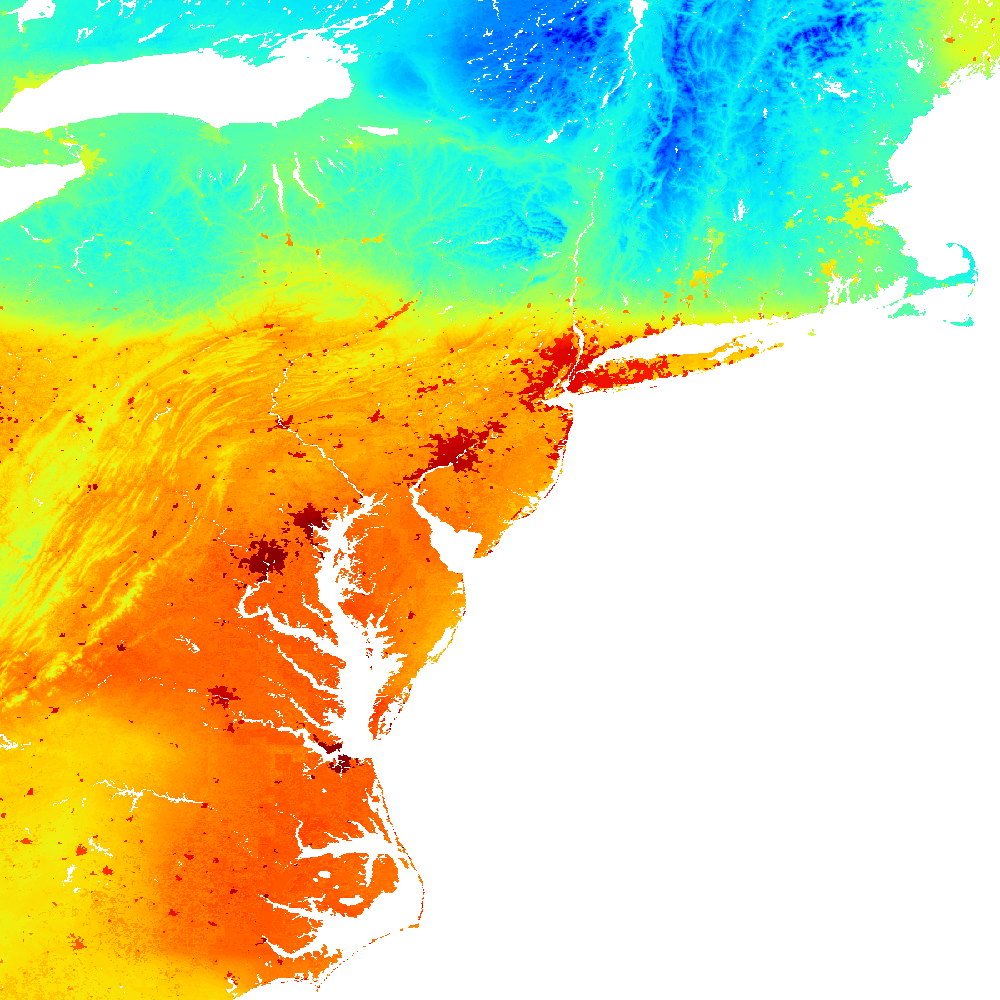
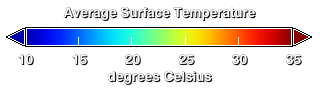
Big cities influence the environment around them. For example, urban areas are typically warmer than their surroundings. Cities are strikingly visible in computer models that simulate the Earth's land surface. This visualization shows average surface temperature predicted by the Land Information System (LIS) for a day in June 2001. Only part of the global computation is shown, focusing on the highly urbanized northeast corridor in the United States, including the cities of Boston, New York, Philadelphia, Baltimore, and Washington.
Urban Signatures: Temperature (WMS)
Visualization Credits
Jeff de La Beaujardiere (NASA): Lead Animator
Please give credit for this item to:
NASA/Goddard Space Flight Center Scientific Visualization Studio, NASA GSFC Land Information System (http://lis.gsfc.nasa.gov/)
NASA/Goddard Space Flight Center Scientific Visualization Studio, NASA GSFC Land Information System (http://lis.gsfc.nasa.gov/)
Short URL to share this page:
https://svs.gsfc.nasa.gov/3152
Data Used:
Note: While we identify the data sets used in these visualizations, we do not store any further details nor the data sets themselves on our site.
This item is part of these series:
WMS
Land Information System
Keywords:
DLESE >> Human geography
GCMD >> Earth Science >> Biosphere >> Terrestrial Ecosystems >> Urban Lands
GCMD >> Earth Science >> Human Dimensions >> Environmental Impacts >> Urbanization
GCMD >> Earth Science >> Land Surface >> Land Temperature >> Land Surface Temperature
GCMD >> Location >> United States Of America
NASA Science >> Earth
GCMD keywords can be found on the Internet with the following citation: Olsen, L.M., G. Major, K. Shein, J. Scialdone, S. Ritz, T. Stevens, M. Morahan, A. Aleman, R. Vogel, S. Leicester, H. Weir, M. Meaux, S. Grebas, C.Solomon, M. Holland, T. Northcutt, R. A. Restrepo, R. Bilodeau, 2013. NASA/Global Change Master Directory (GCMD) Earth Science Keywords. Version 8.0.0.0.0
https://svs.gsfc.nasa.gov/3152
Data Used:
LIS/Average Surface Temperature
Model - 2001/06/11This item is part of these series:
WMS
Land Information System
Keywords:
DLESE >> Human geography
GCMD >> Earth Science >> Biosphere >> Terrestrial Ecosystems >> Urban Lands
GCMD >> Earth Science >> Human Dimensions >> Environmental Impacts >> Urbanization
GCMD >> Earth Science >> Land Surface >> Land Temperature >> Land Surface Temperature
GCMD >> Location >> United States Of America
NASA Science >> Earth
GCMD keywords can be found on the Internet with the following citation: Olsen, L.M., G. Major, K. Shein, J. Scialdone, S. Ritz, T. Stevens, M. Morahan, A. Aleman, R. Vogel, S. Leicester, H. Weir, M. Meaux, S. Grebas, C.Solomon, M. Holland, T. Northcutt, R. A. Restrepo, R. Bilodeau, 2013. NASA/Global Change Master Directory (GCMD) Earth Science Keywords. Version 8.0.0.0.0


