Earth
ID: 30388
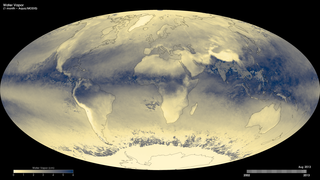
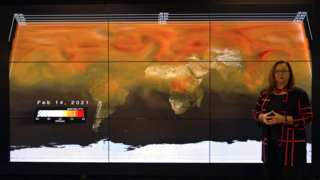
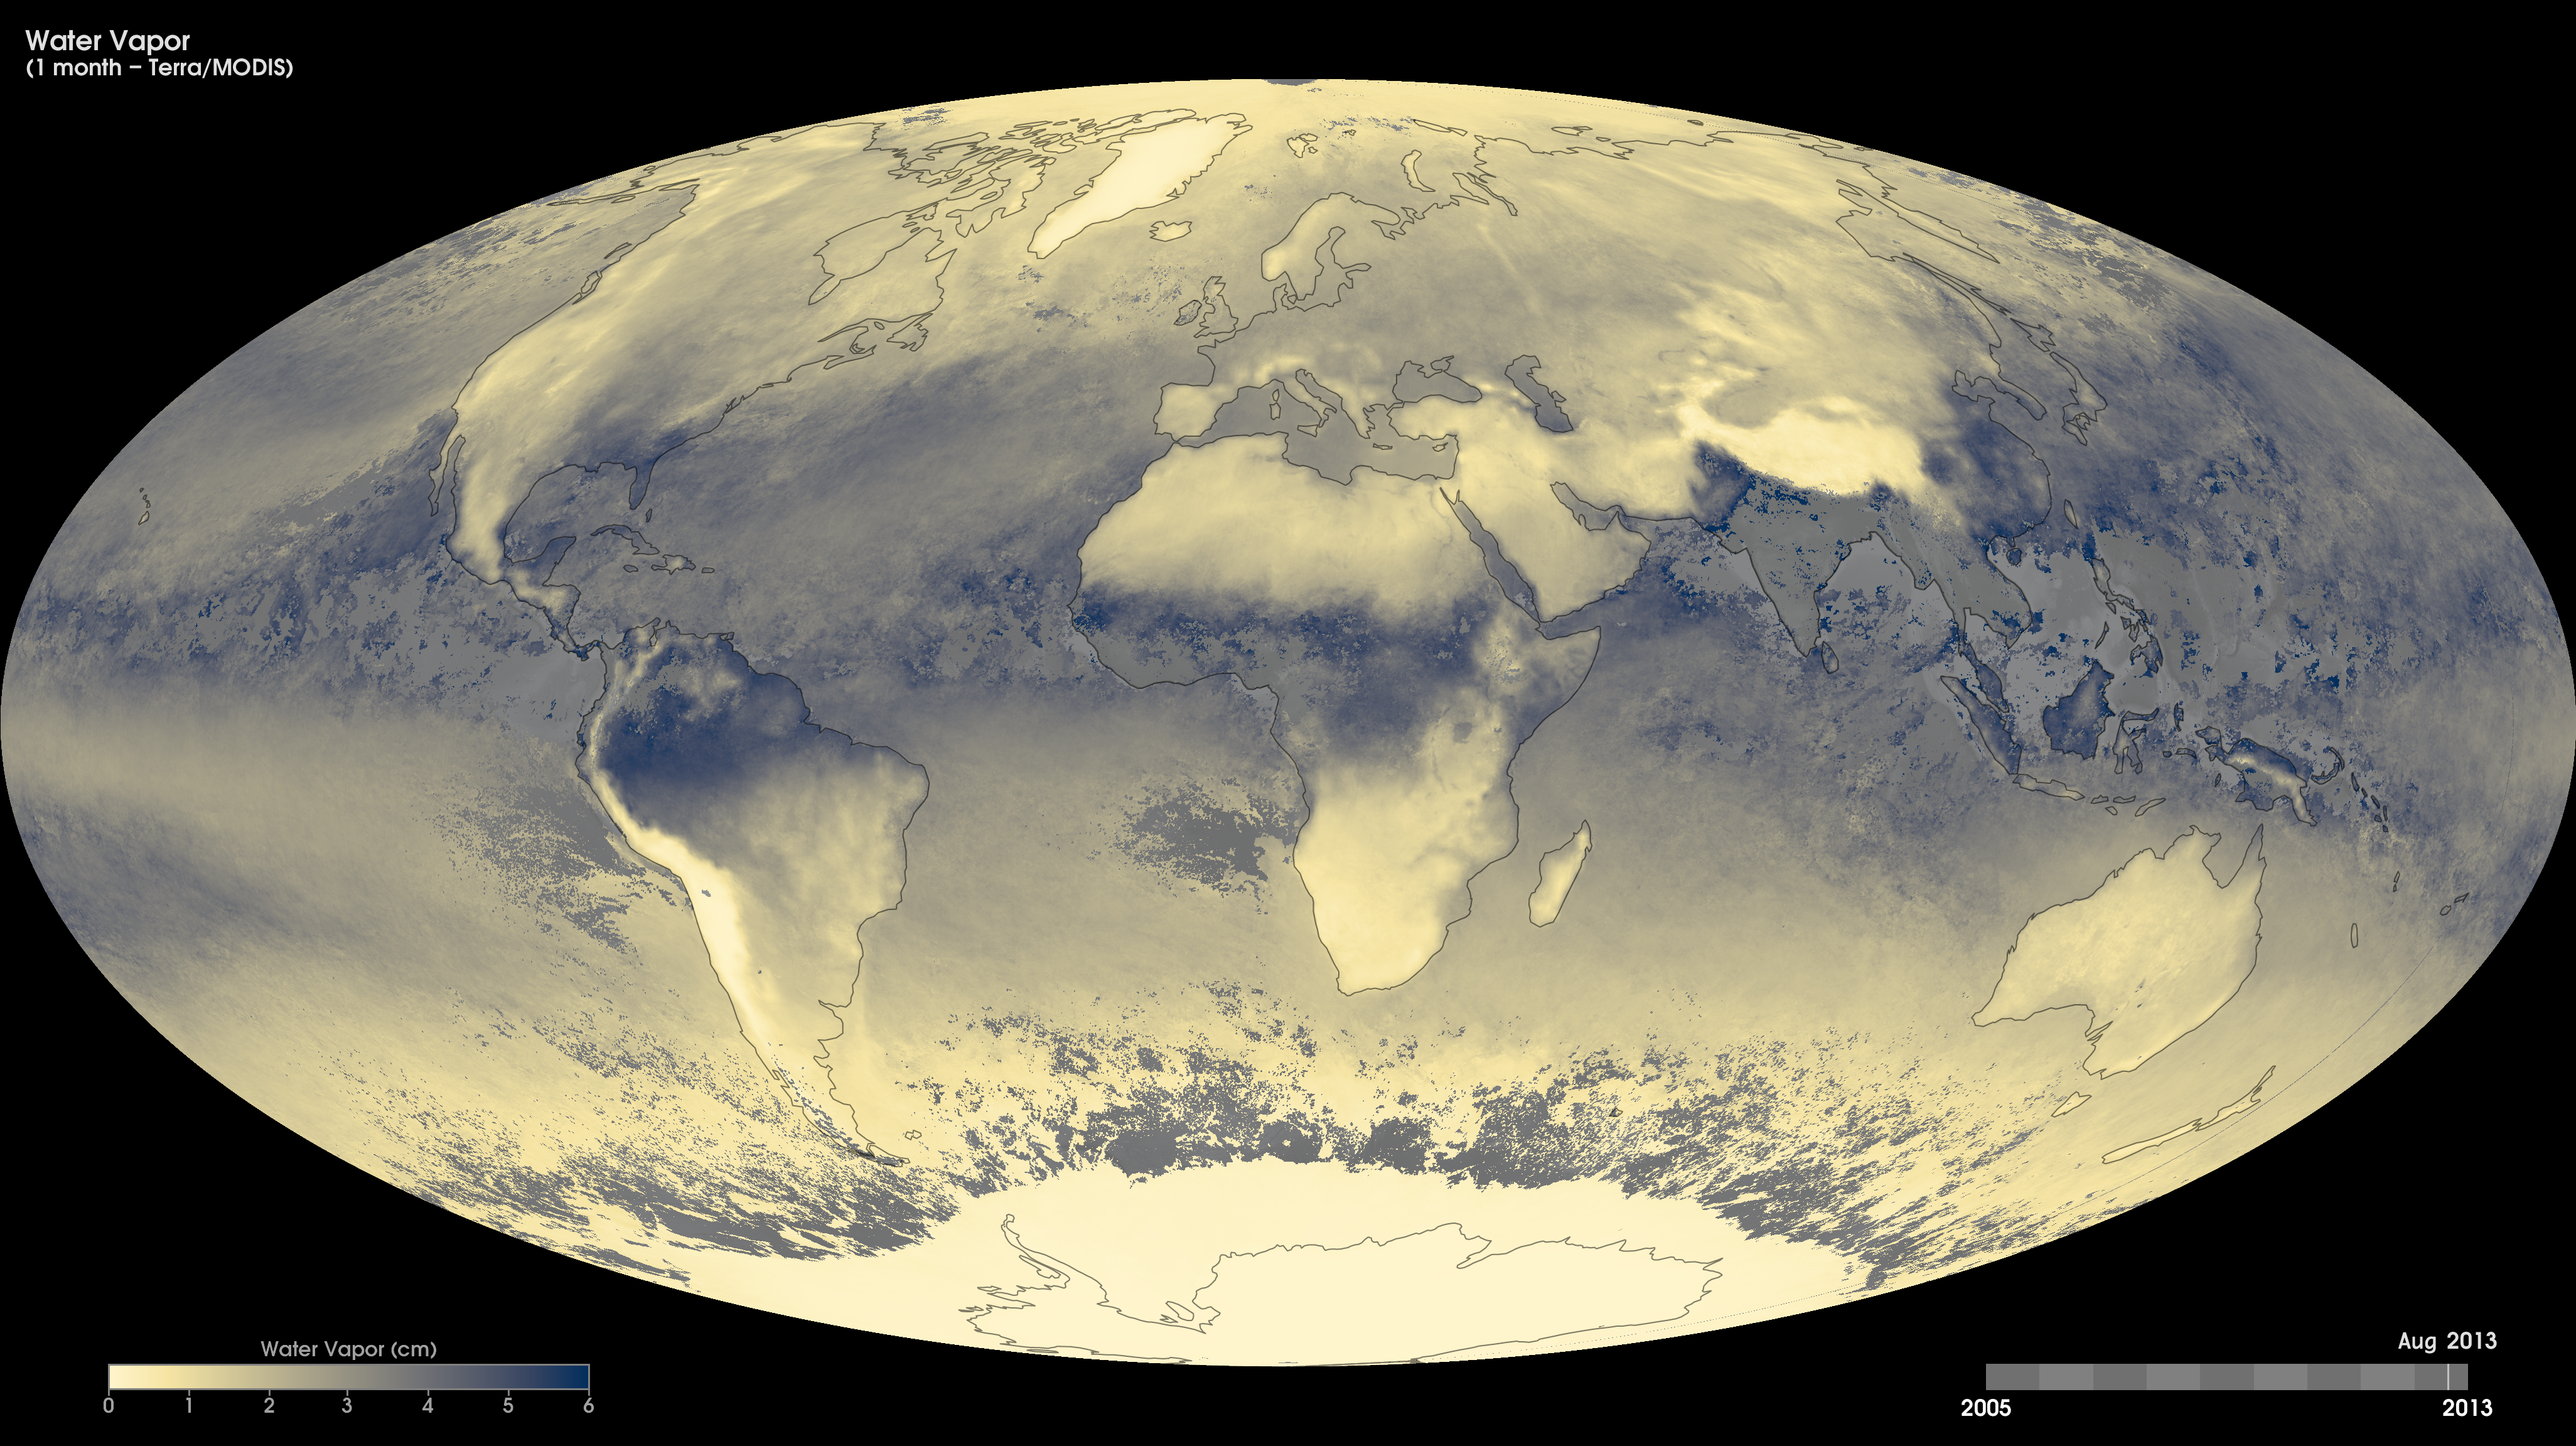
Water vapor is the most abundant greenhouse gas in the atmosphere as it traps heat near the surface of the Earth making our planet warm enough to support life. Scientists monitor water vapor in the atmosphere because it influences Earth's weather patterns, and because it is a very important component of Earth's climate system. These maps show a monthly water vapor product from January 2005 to the present, derived using data from the Moderate Resolution Imaging Spectroradiometer (MODIS) instrument onboard NASA’s Terra satellite. The water vapor product reveals the total amount of water vapor in a 1-kilometer by 1-kilometer column of the atmosphere. Dark blue shades indicate areas with high water vapor content, while light yellow shades indicate areas with little or no water vapor content.
Monthly Water Vapor (Terra/MODIS)
Related
For More Information
Credits
Based on imagery by Reto Stockli, NASA's Earth Observatory, using data provided by the MODIS Atmosphere Science Team, NASA Goddard Space Flight Center.
Short URL to share this page:
https://svs.gsfc.nasa.gov/30388
Mission:
Terra
Data Used:
Note: While we identify the data sets used in these visualizations, we do not store any further details nor the data sets themselves on our site.
This item is part of this series:
NASA Earth Observations
Keywords:
DLESE >> Atmospheric science
SVS >> HDTV
GCMD >> Earth Science >> Atmosphere >> Atmospheric Water Vapor >> Water Vapor
SVS >> Hyperwall
NASA Science >> Earth
SVS >> Presentation
GCMD keywords can be found on the Internet with the following citation: Olsen, L.M., G. Major, K. Shein, J. Scialdone, S. Ritz, T. Stevens, M. Morahan, A. Aleman, R. Vogel, S. Leicester, H. Weir, M. Meaux, S. Grebas, C.Solomon, M. Holland, T. Northcutt, R. A. Restrepo, R. Bilodeau, 2013. NASA/Global Change Master Directory (GCMD) Earth Science Keywords. Version 8.0.0.0.0
https://svs.gsfc.nasa.gov/30388
Mission:
Terra
Data Used:
Terra/MODIS
This item is part of this series:
NASA Earth Observations
Keywords:
DLESE >> Atmospheric science
SVS >> HDTV
GCMD >> Earth Science >> Atmosphere >> Atmospheric Water Vapor >> Water Vapor
SVS >> Hyperwall
NASA Science >> Earth
SVS >> Presentation
GCMD keywords can be found on the Internet with the following citation: Olsen, L.M., G. Major, K. Shein, J. Scialdone, S. Ritz, T. Stevens, M. Morahan, A. Aleman, R. Vogel, S. Leicester, H. Weir, M. Meaux, S. Grebas, C.Solomon, M. Holland, T. Northcutt, R. A. Restrepo, R. Bilodeau, 2013. NASA/Global Change Master Directory (GCMD) Earth Science Keywords. Version 8.0.0.0.0


