Earth
ID: 30375
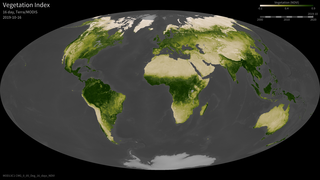
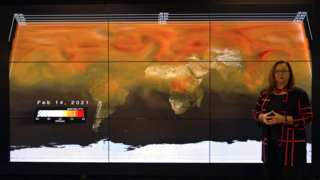
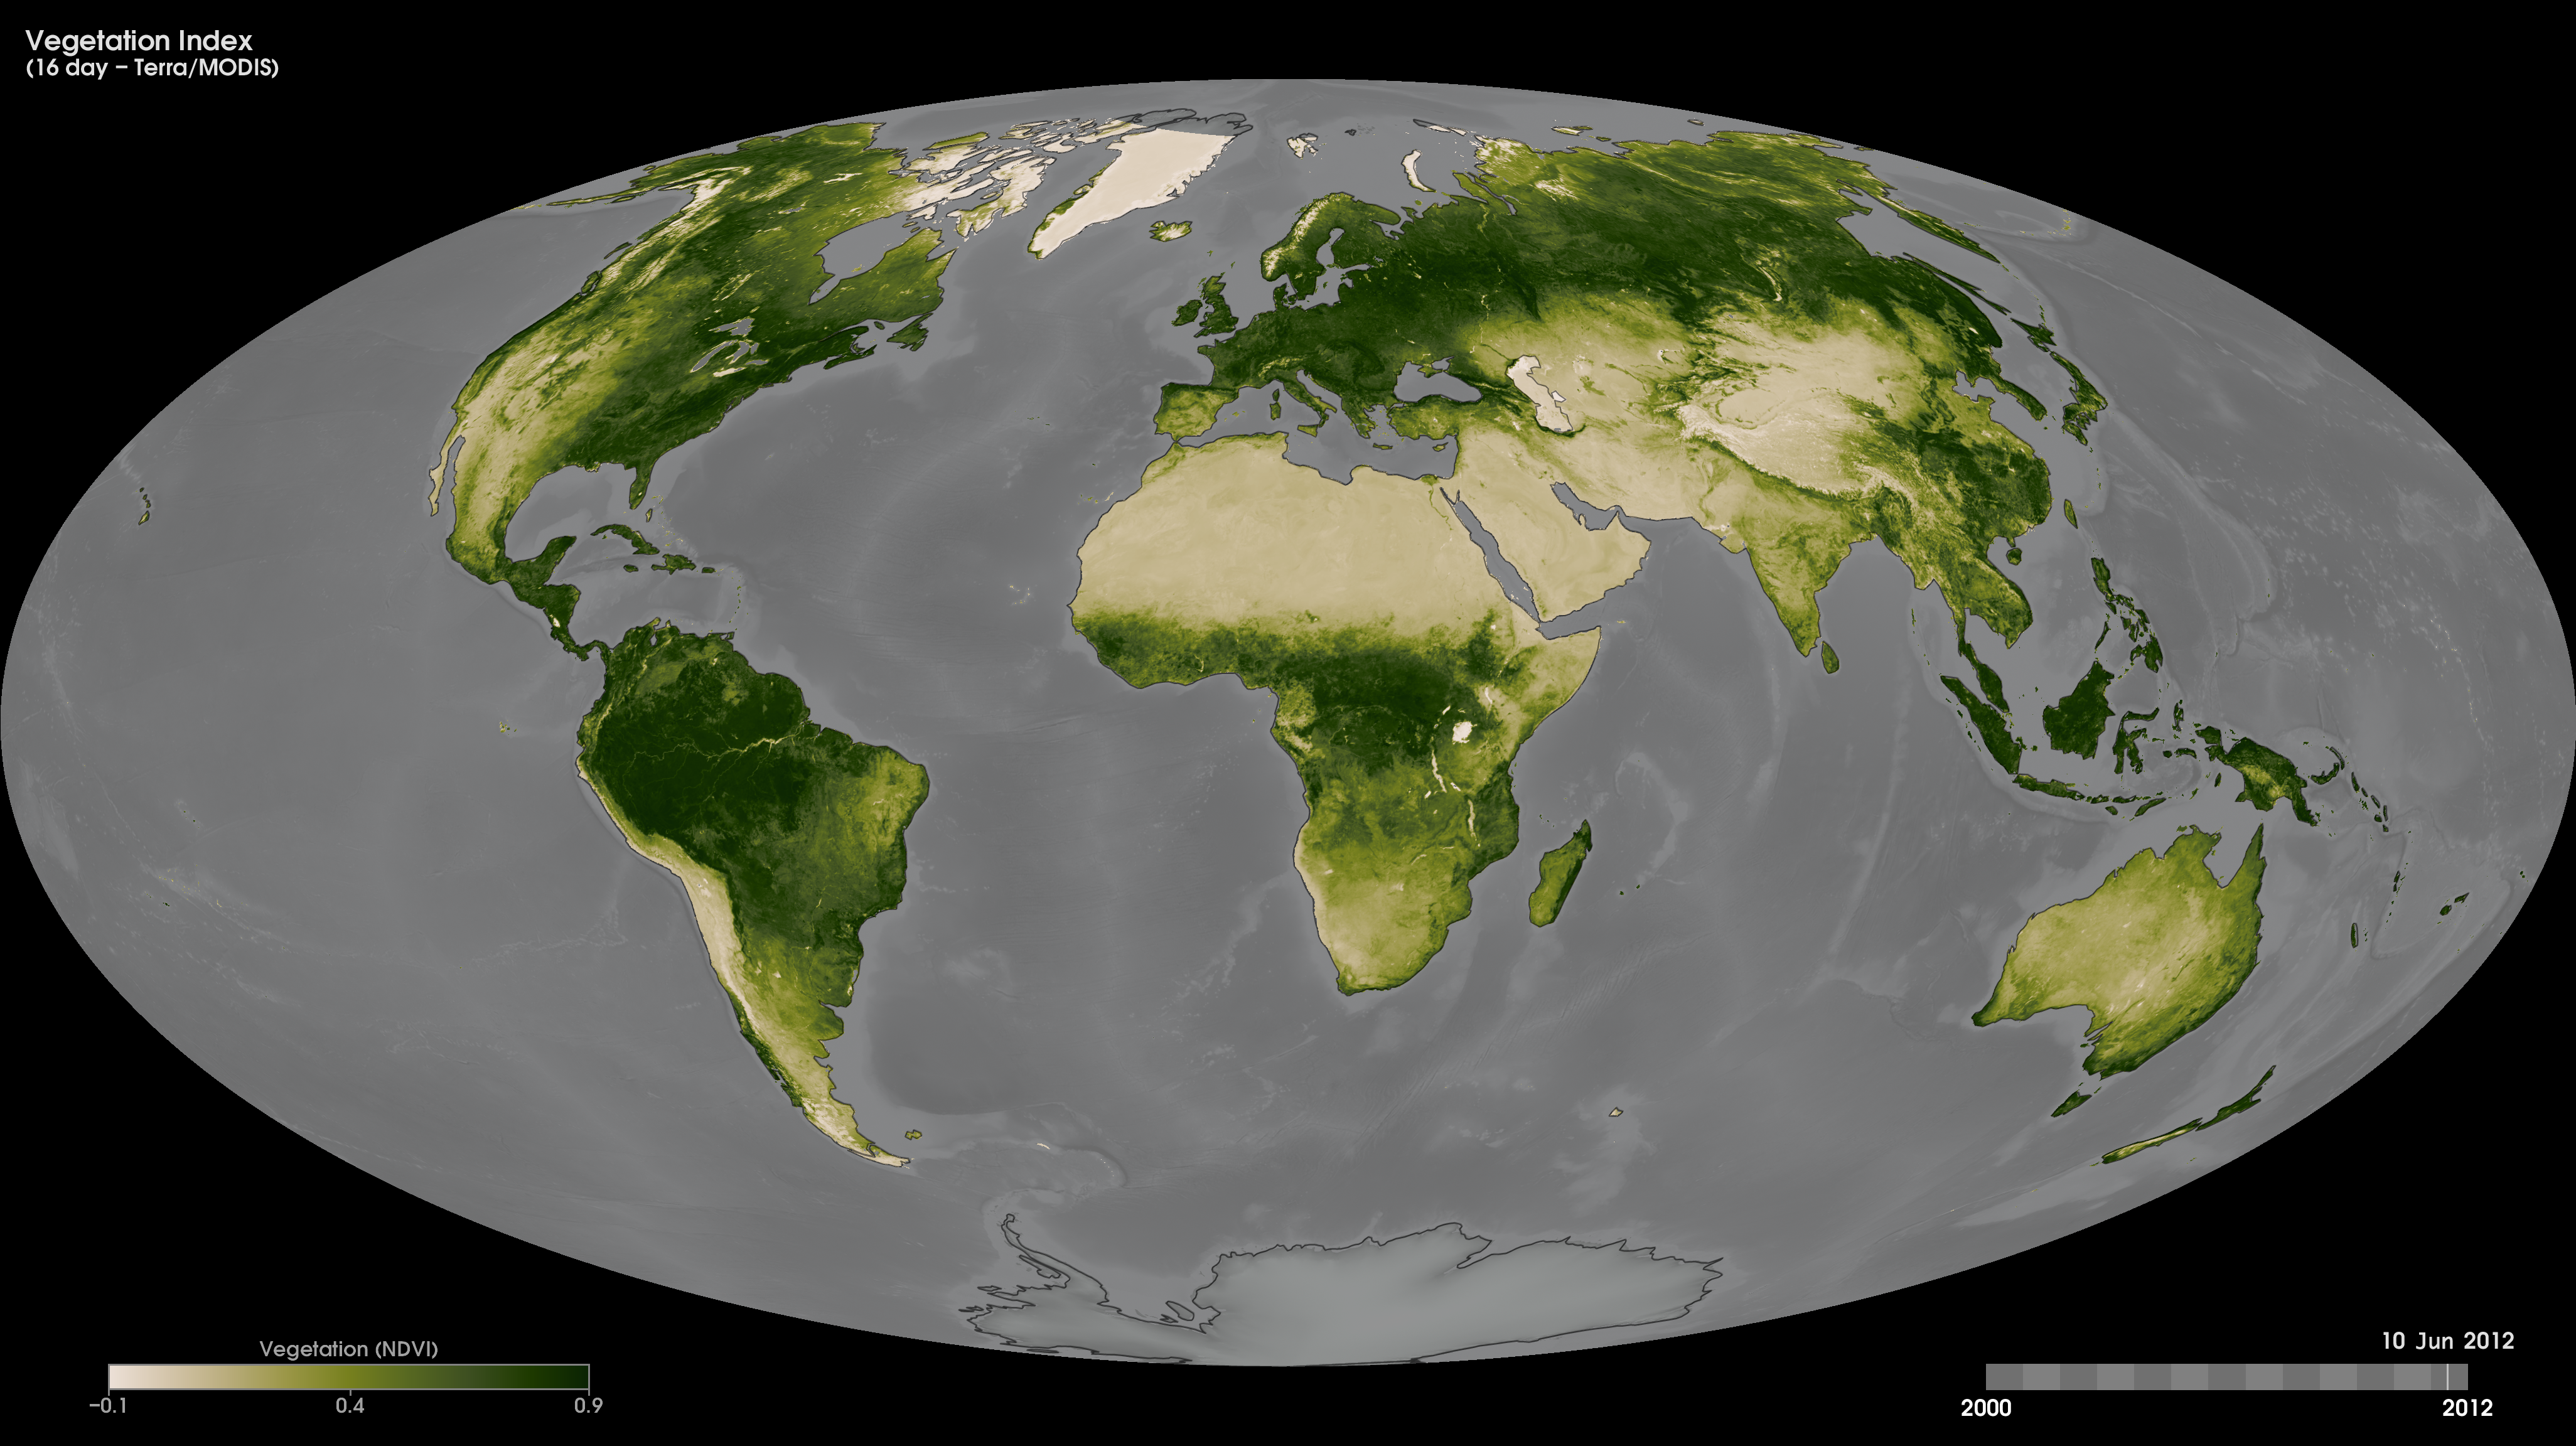
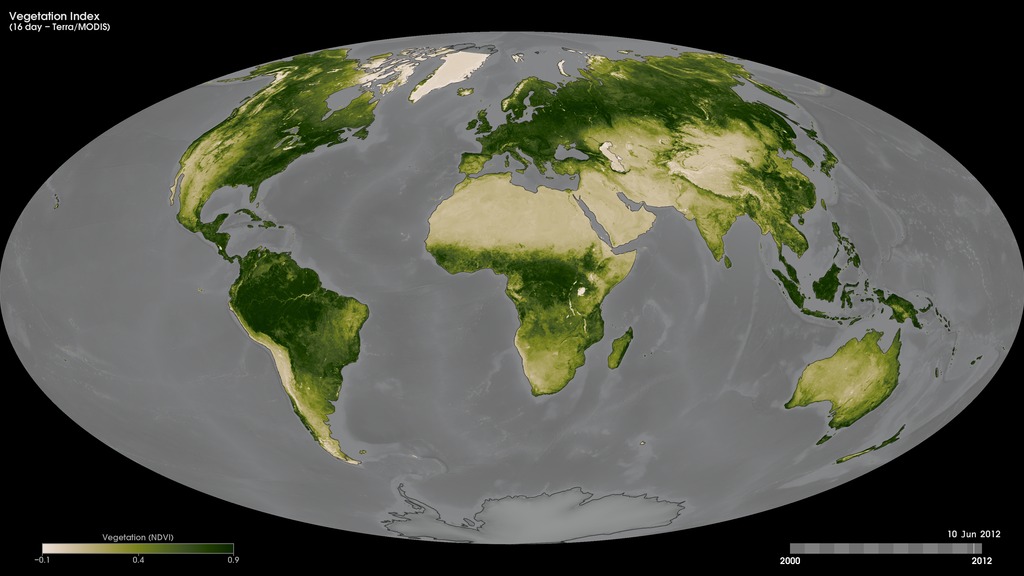
One of the primary interests of NASA's Earth Sciences Program is to study the role of terrestrial vegetation in large-scale processes with the goal of understanding how our world functions as a system. These maps show 16-day Normalized Difference Vegetation Index (NDVI) values—a measure of the "greenness" of Earth's landscapes—from February 18, 2000 to the present. The values, derived using data collected by the Moderate Resolution Imaging Spectroradiometer (MODIS) onboard NASA's Terra satellite, range from -0.1 to 0.9 and have no unit. Rather, they are index values in which higher values (0.4 to 0.9) show lands covered by green, leafy vegetation and lower values (0 to 0.4) show lands where there is little or no vegetation. Dark green areas show where there was a lot of green leaf growth; light greens show where there was some green leaf growth; and tan areas show little or no growth. Black means no data.
16-Day Vegetation Index
There is a newer version of this story located here: https://svs.gsfc.nasa.gov/31053
Newer Version
For More Information
Credits
Based on images by Reto Stockli, NASA's Earth Observatory Group, using data provided by the MODIS Land Science Team.
Short URL to share this page:
https://svs.gsfc.nasa.gov/30375
Mission:
Terra
Data Used:
Note: While we identify the data sets used in these visualizations, we do not store any further details nor the data sets themselves on our site.
This item is part of this series:
NASA Earth Observations
Keywords:
DLESE >> Biology
SVS >> HDTV
GCMD >> Earth Science >> Biosphere >> Vegetation >> Vegetation Index
SVS >> Hyperwall
NASA Science >> Earth
SVS >> Presentation
GCMD keywords can be found on the Internet with the following citation: Olsen, L.M., G. Major, K. Shein, J. Scialdone, S. Ritz, T. Stevens, M. Morahan, A. Aleman, R. Vogel, S. Leicester, H. Weir, M. Meaux, S. Grebas, C.Solomon, M. Holland, T. Northcutt, R. A. Restrepo, R. Bilodeau, 2013. NASA/Global Change Master Directory (GCMD) Earth Science Keywords. Version 8.0.0.0.0
https://svs.gsfc.nasa.gov/30375
Mission:
Terra
Data Used:
Terra/MODIS/NDVI
This item is part of this series:
NASA Earth Observations
Keywords:
DLESE >> Biology
SVS >> HDTV
GCMD >> Earth Science >> Biosphere >> Vegetation >> Vegetation Index
SVS >> Hyperwall
NASA Science >> Earth
SVS >> Presentation
GCMD keywords can be found on the Internet with the following citation: Olsen, L.M., G. Major, K. Shein, J. Scialdone, S. Ritz, T. Stevens, M. Morahan, A. Aleman, R. Vogel, S. Leicester, H. Weir, M. Meaux, S. Grebas, C.Solomon, M. Holland, T. Northcutt, R. A. Restrepo, R. Bilodeau, 2013. NASA/Global Change Master Directory (GCMD) Earth Science Keywords. Version 8.0.0.0.0

