Earth
ID: 11683

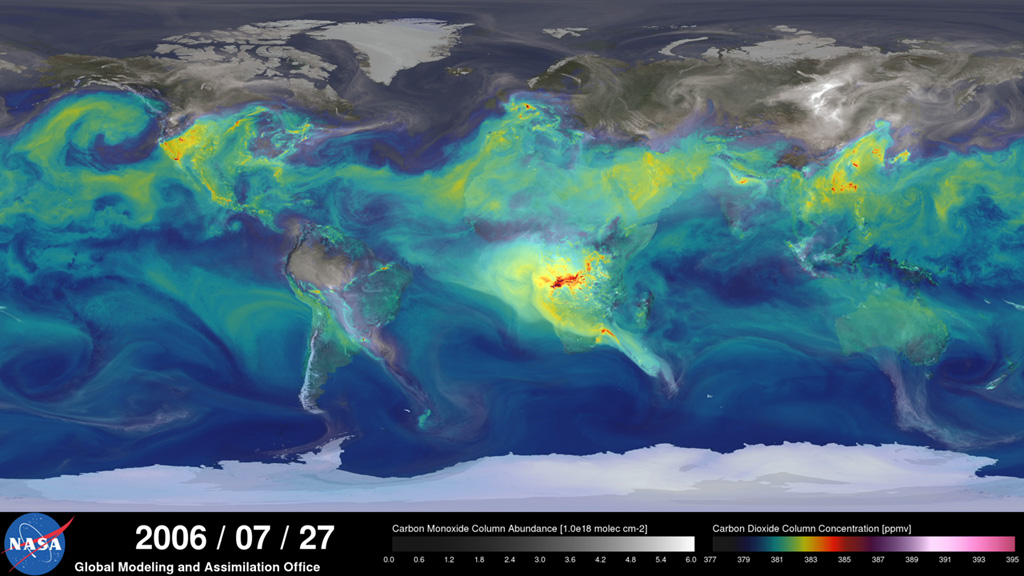
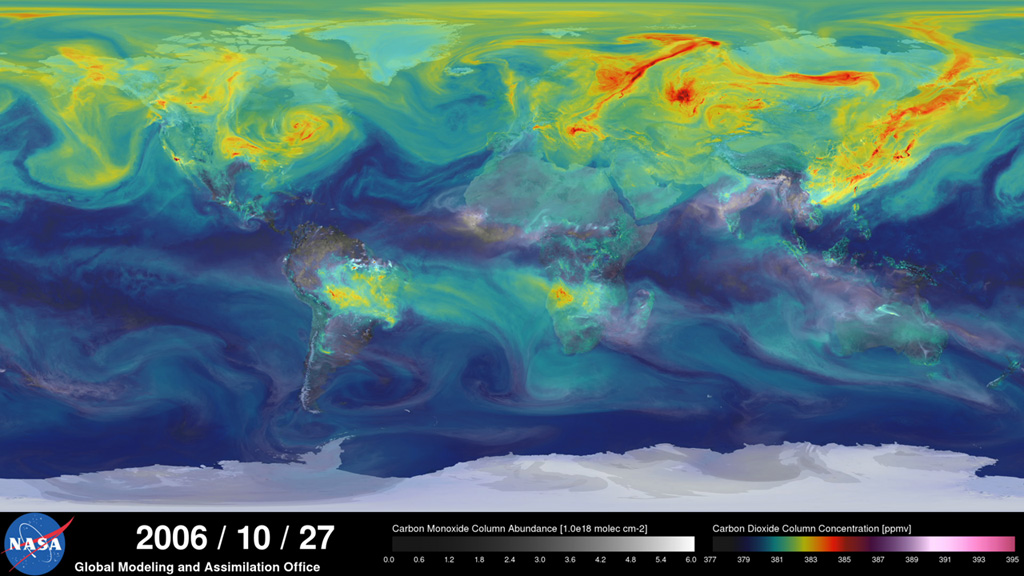
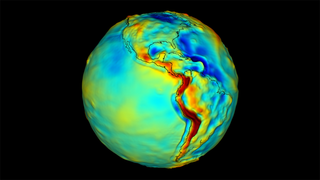
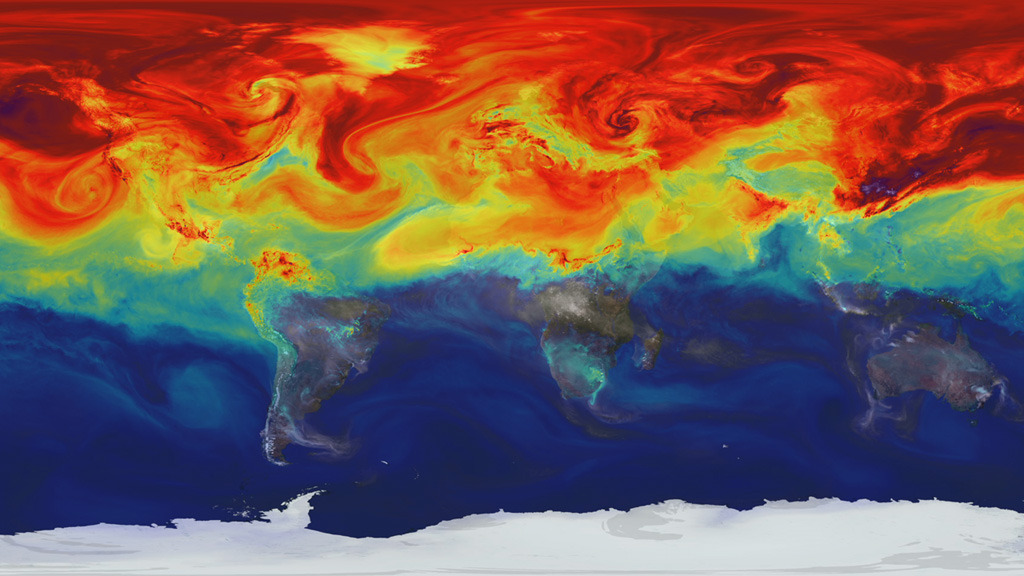
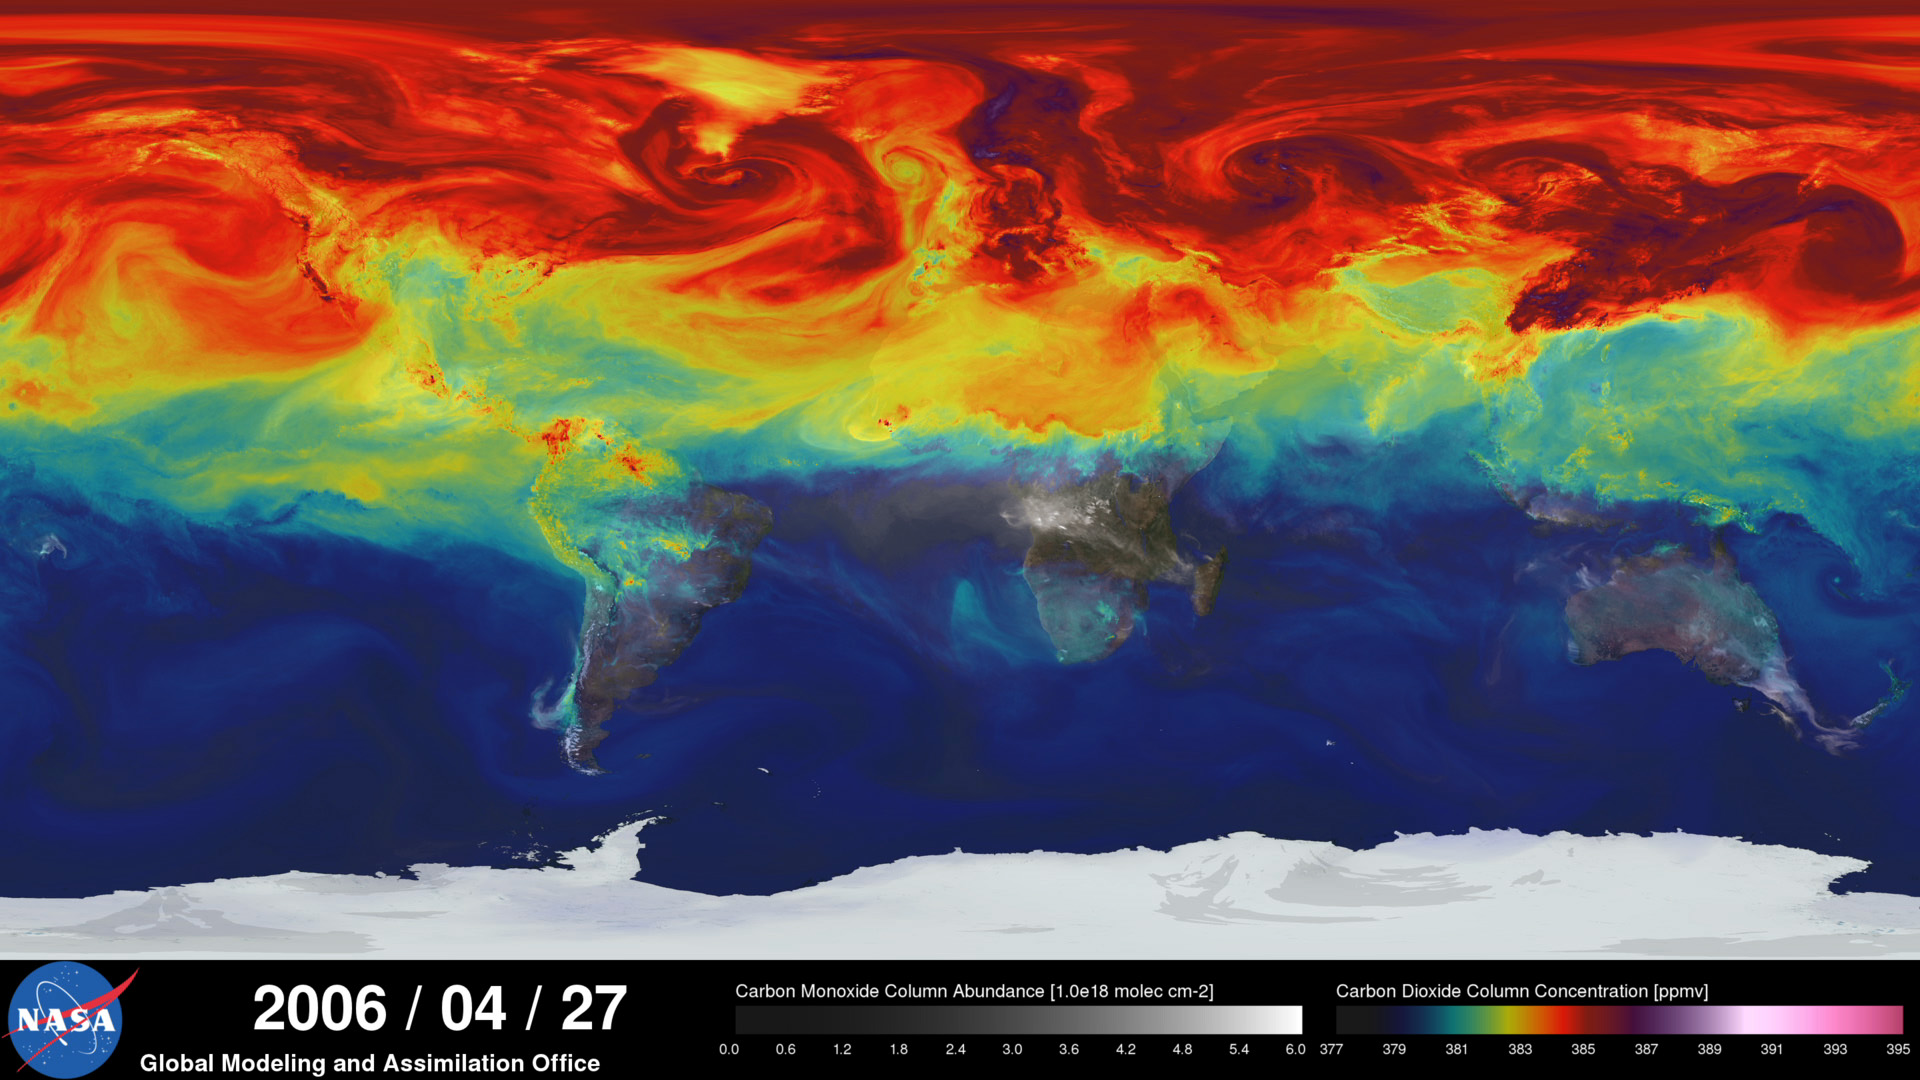
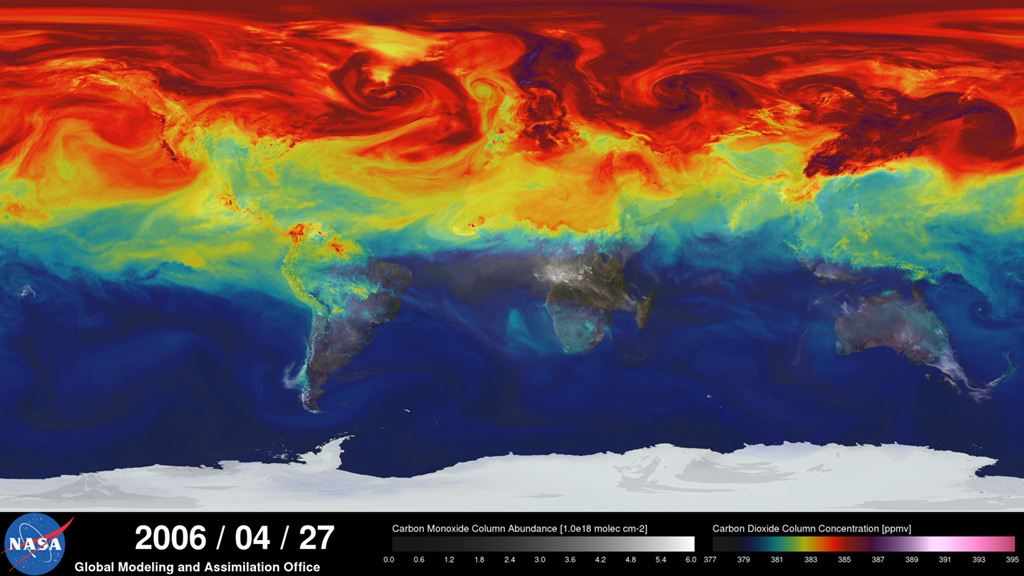
Carbon dioxide is the key driver of global warming, however, despite its significance, much remains unknown about the pathways it takes from emission source to the atmosphere or carbon reservoirs such as oceans and forests. Using a NASA supercomputer model called GEOS-5, scientists created a visualization that simulates how the greenhouse gas travels through Earth’s atmosphere over the course of a year. The model run produced nearly four petabytes (million billion bytes) of data and required 75 days of dedicated computation to complete. In addition to providing a striking look at the movements of the invisible gas as it is transported by winds across the globe, the visualization illustrates differences in carbon dioxide levels in the Northern and Southern Hemispheres and distinct swings in global carbon dioxide concentrations as the growth cycle of plants and trees changes with the seasons. Watch the video for a tour of the visualization.


Simulating Carbon
Related Story
For More Information
Story Credits
Lead Visualizer/Animator:
William Putman (NASA/GSFC)
Video Editor:
Kayvon Sharghi (USRA)
Narration:
William Putman (NASA/GSFC)
Kayvon Sharghi (USRA)
Narrator:
William Putman (NASA/GSFC)
Producer:
Kayvon Sharghi (USRA)
Lead Scientist:
William Putman (NASA/GSFC)
Lead Writer:
Patrick Lynch (Wyle Information Systems)
William Putman (NASA/GSFC)
Video Editor:
Kayvon Sharghi (USRA)
Narration:
William Putman (NASA/GSFC)
Kayvon Sharghi (USRA)
Narrator:
William Putman (NASA/GSFC)
Producer:
Kayvon Sharghi (USRA)
Lead Scientist:
William Putman (NASA/GSFC)
Lead Writer:
Patrick Lynch (Wyle Information Systems)
Please give credit for this item to:
NASA's Goddard Space Flight Center
NASA's Goddard Space Flight Center
Short URL to share this page:
https://svs.gsfc.nasa.gov/11683
Keywords:
SVS >> App
NASA Science >> Earth
https://svs.gsfc.nasa.gov/11683
Keywords:
SVS >> App
NASA Science >> Earth
