Projected U.S. Temperature and Precipitation Changes by 2100
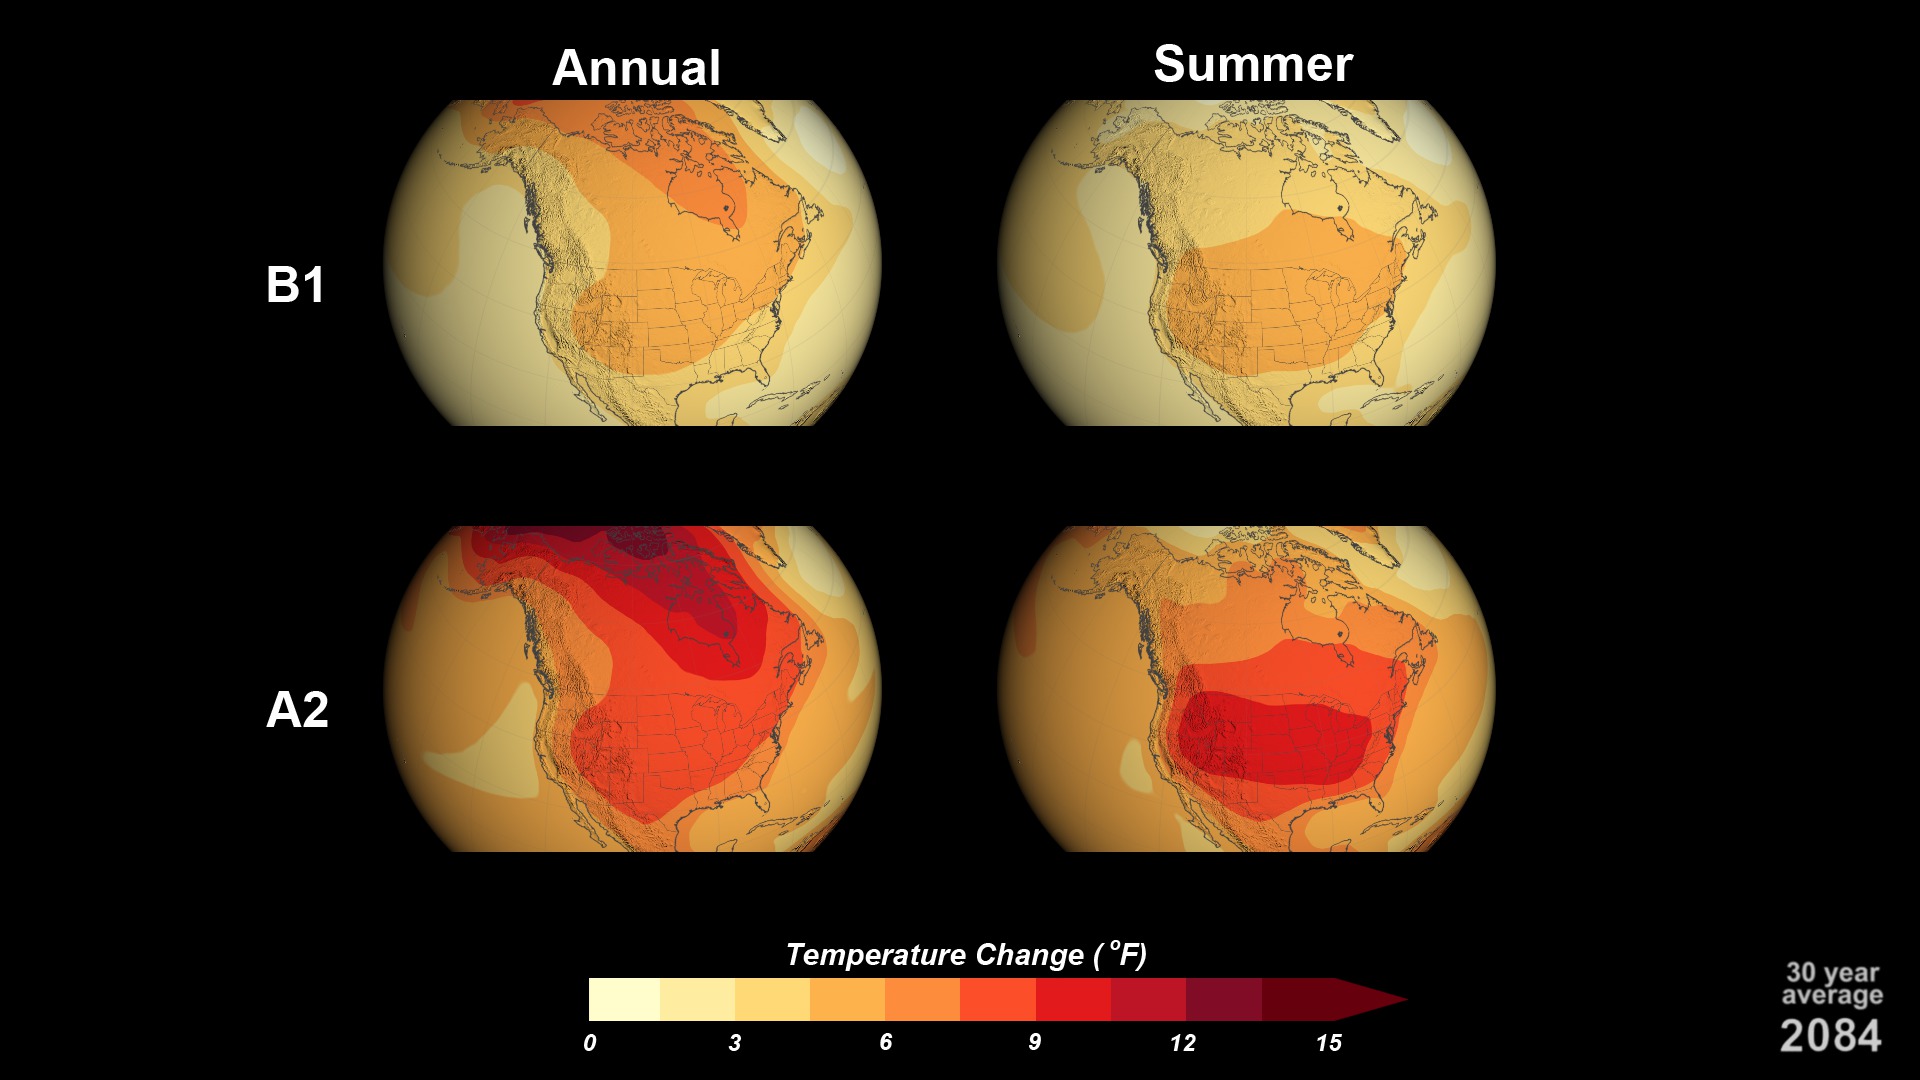
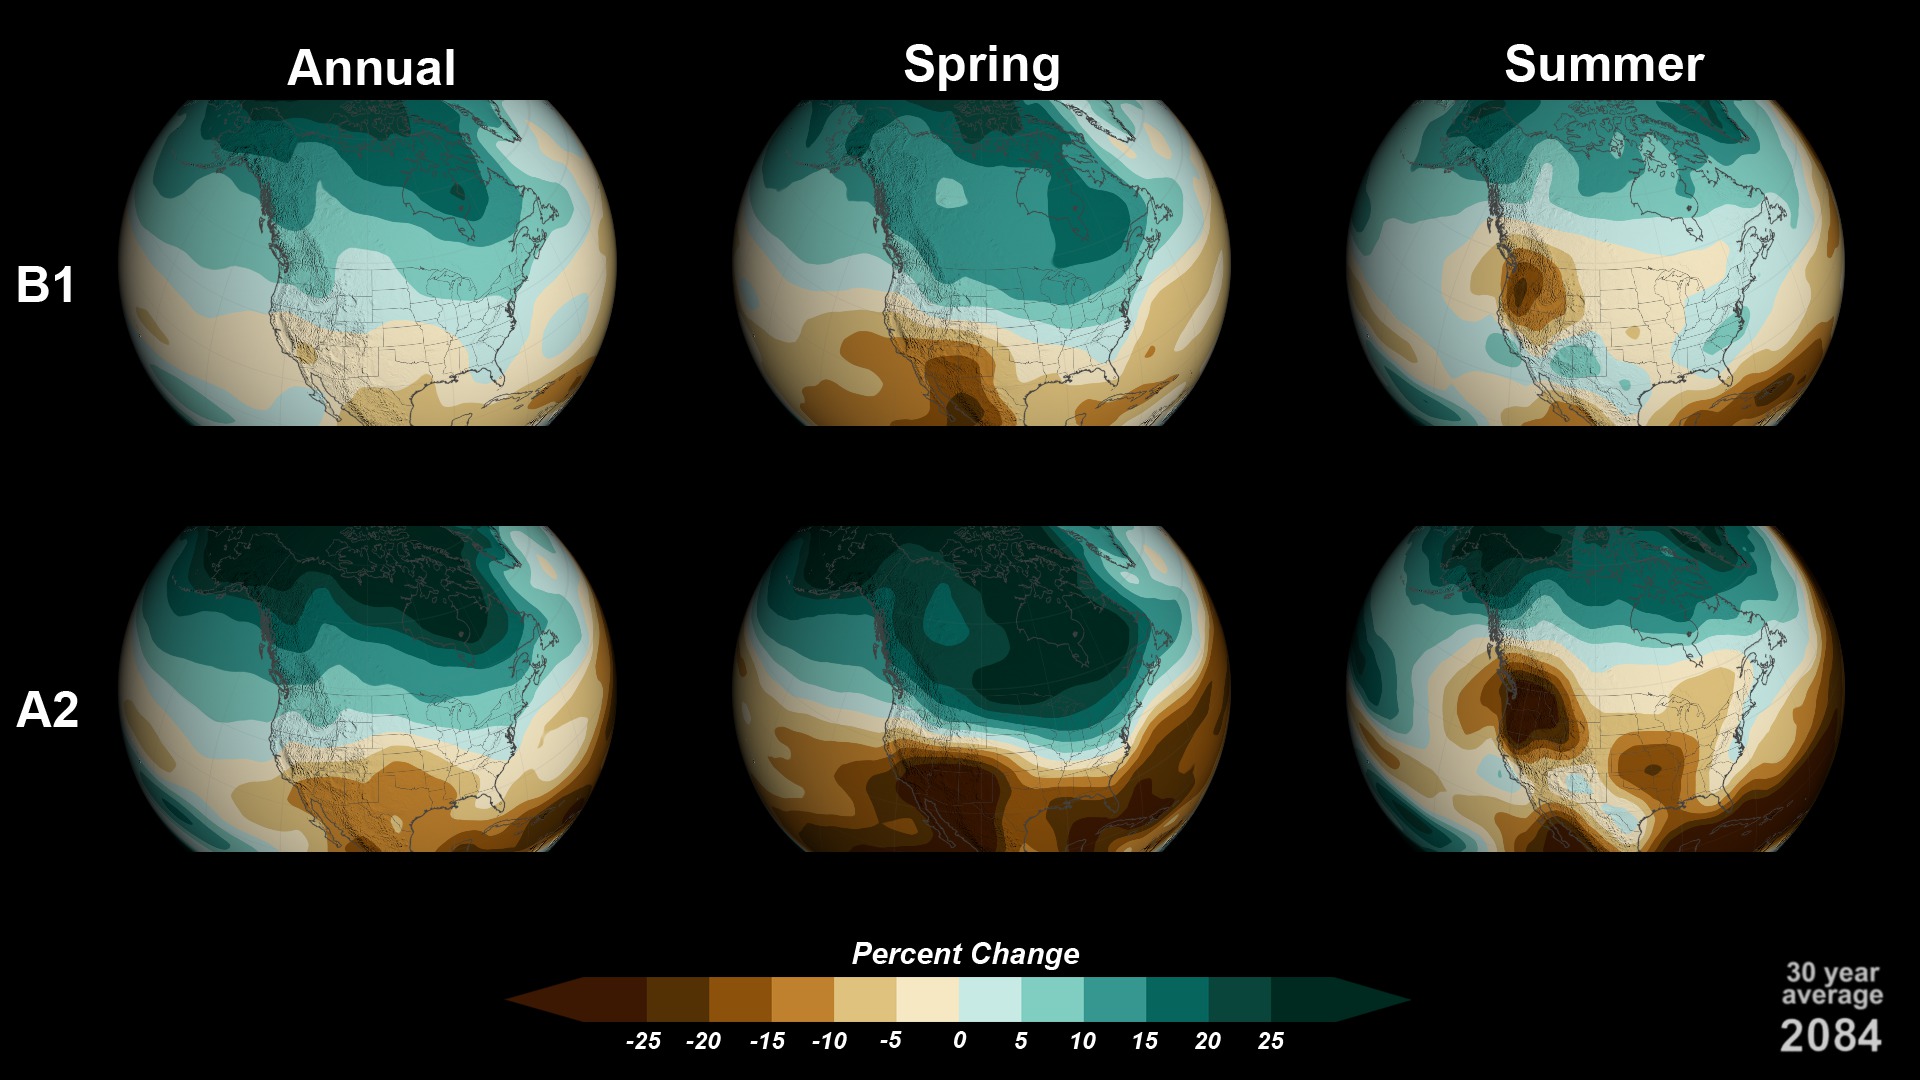
New visualizations of computer model projections show how precipitation patterns and temperatures could change across the U.S. in the coming decades under two different carbon dioxide emissions scenarios. The two climate scenarios, based on "low" and "high" levels of carbon dioxide emissions, highlight results from the draft National Climate Assessment.
The visualizations, which combine the results from 15 global climate models, present projections of precipitation and temperature changes from 2000 to 2100 compared to the historical average from 1970 - 1999. They were produced by the Scientific Visualization Studio at NASA's Goddard Space Flight Center, Greenbelt, Md., in collaboration with NOAA's National Climatic Data Center and the Cooperative Institute for Climate and Satellites, both in Asheville, N.C.
The visualizations show the precipitation and temperature changes as a 30-year running average. The date seen in the bottom-right corner is the mid-point of the 30-year average being shown.
"These visualizations communicate a picture of the impacts of climate change in a way that words do not," says Allison Leidner, Ph.D., a scientist who coordinates NASA's involvement in the National Climate Assessment "When I look at the scenarios for future temperature and precipitation, I really see how dramatically our nation's climate could change."
For More Information
Credits
Please give credit for this item to:
NASA's Goddard Space Flight Center
-
Animator
- Greg Shirah (NASA/GSFC)
-
Video editor
- Kayvon Sharghi (USRA)
-
Producer
- Kayvon Sharghi (USRA)
-
Writer
- Patrick Lynch (Wyle Information Systems)
Release date
This page was originally published on Tuesday, July 23, 2013.
This page was last updated on Wednesday, May 3, 2023 at 1:51 PM EDT.
Series
This visualization can be found in the following series:Related
- ID: 4028
- ID: 4029