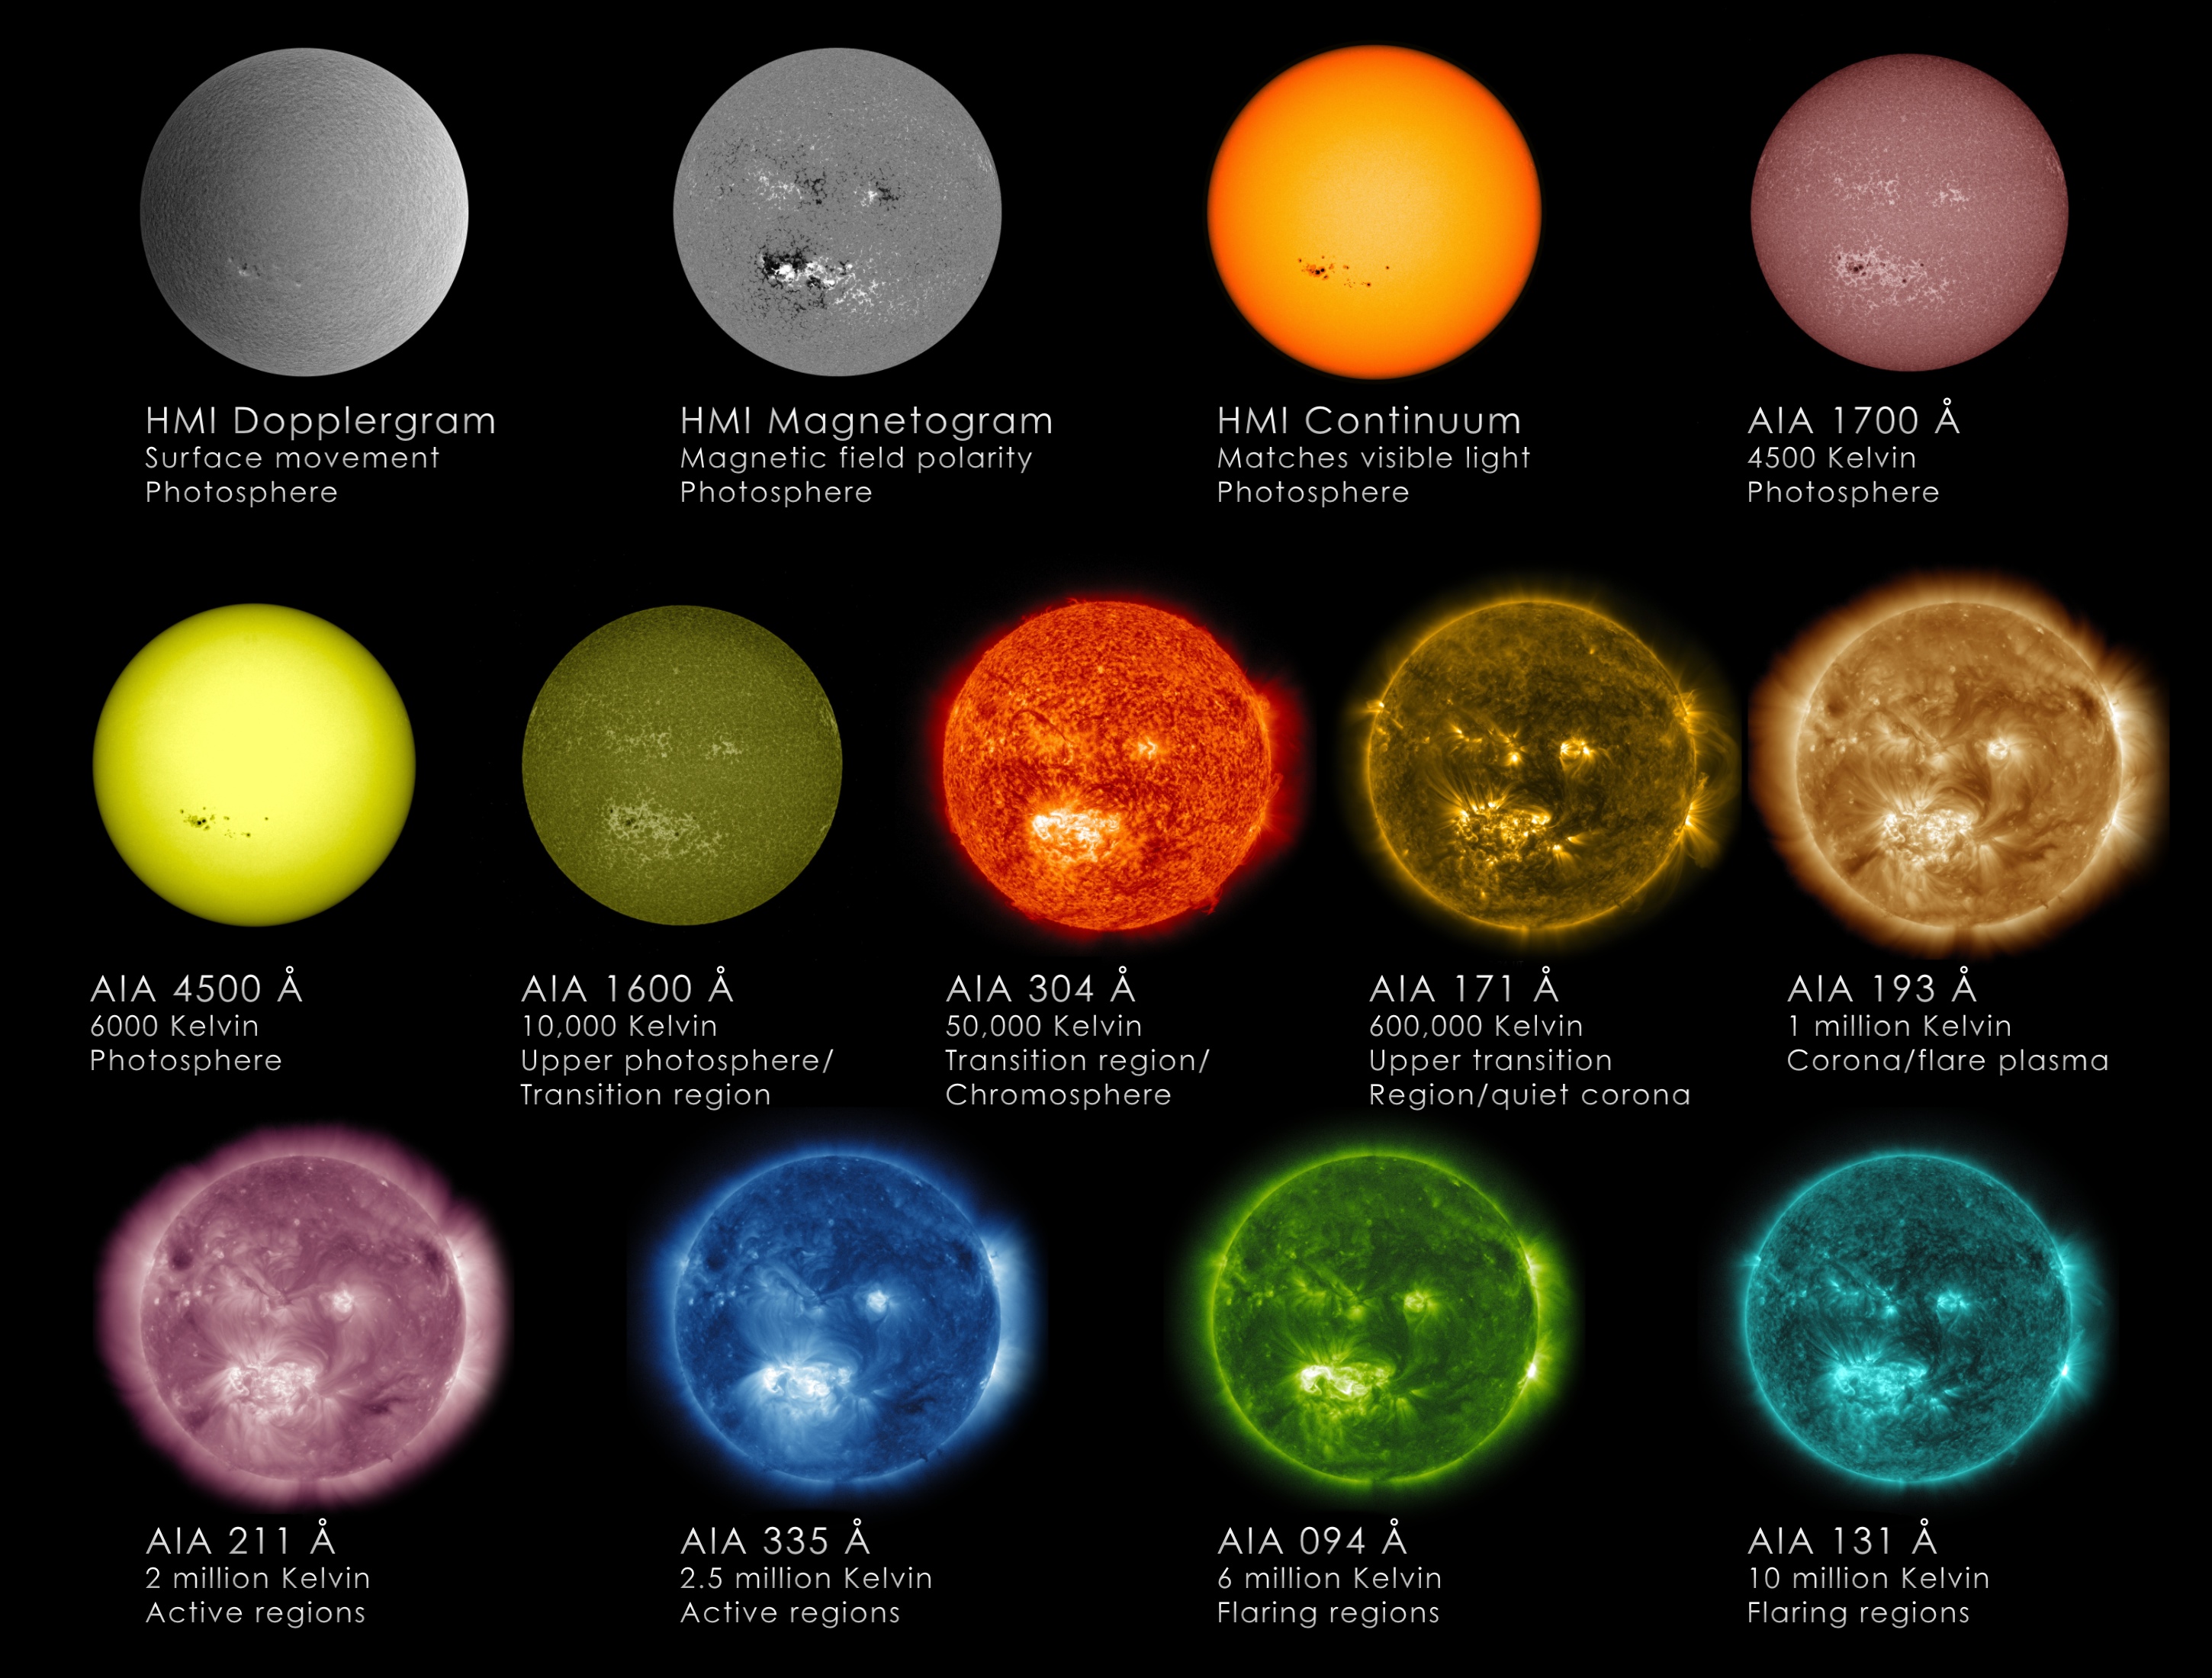
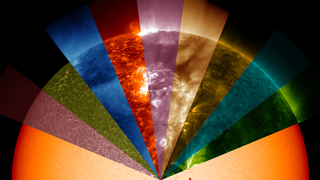
SDO Wavelength Graphics
Yellow light of 5800 angstroms, for example, generally emanates from material of about 10,000 degrees F (5700 degrees C), which represents the surface of the sun. Extreme ultraviolet light of 94 angstroms, on the other hand, comes from atoms that are about 11 million degrees F (6,300,000 degrees C) and is a good wavelength for looking at solar flares, which can reach such high temperatures. By examining pictures of the sun in a variety of wavelengths — as is done through such telescopes as NASA's Solar Dynamics Observatory (SDO), NASA's Solar Terrestrial Relations Observatory (STEREO) and the ESA/NASA Solar and Heliospheric Observatory (SOHO) — scientists can track how particles and heat move through the sun's atmosphere.
We see the visible spectrum of light simply because the sun is made up of a hot gas — heat produces light just as it does in an incandescent light bulb. But when it comes to the shorter wavelengths, the sun sends out extreme ultraviolet light and x-rays because it is filled with many kinds of atoms, each of which give off light of a certain wavelength when they reach a certain temperature. Not only does the sun contain many different atoms — helium, hydrogen, iron, for example — but also different kinds of each atom with different electrical charges, known as ions. Each ion can emit light at specific wavelengths when it reaches a particular temperature. Scientists have cataloged which atoms produce which wavelengths since the early 1900s, and the associations are well documented in lists that can take up hundreds of pages.
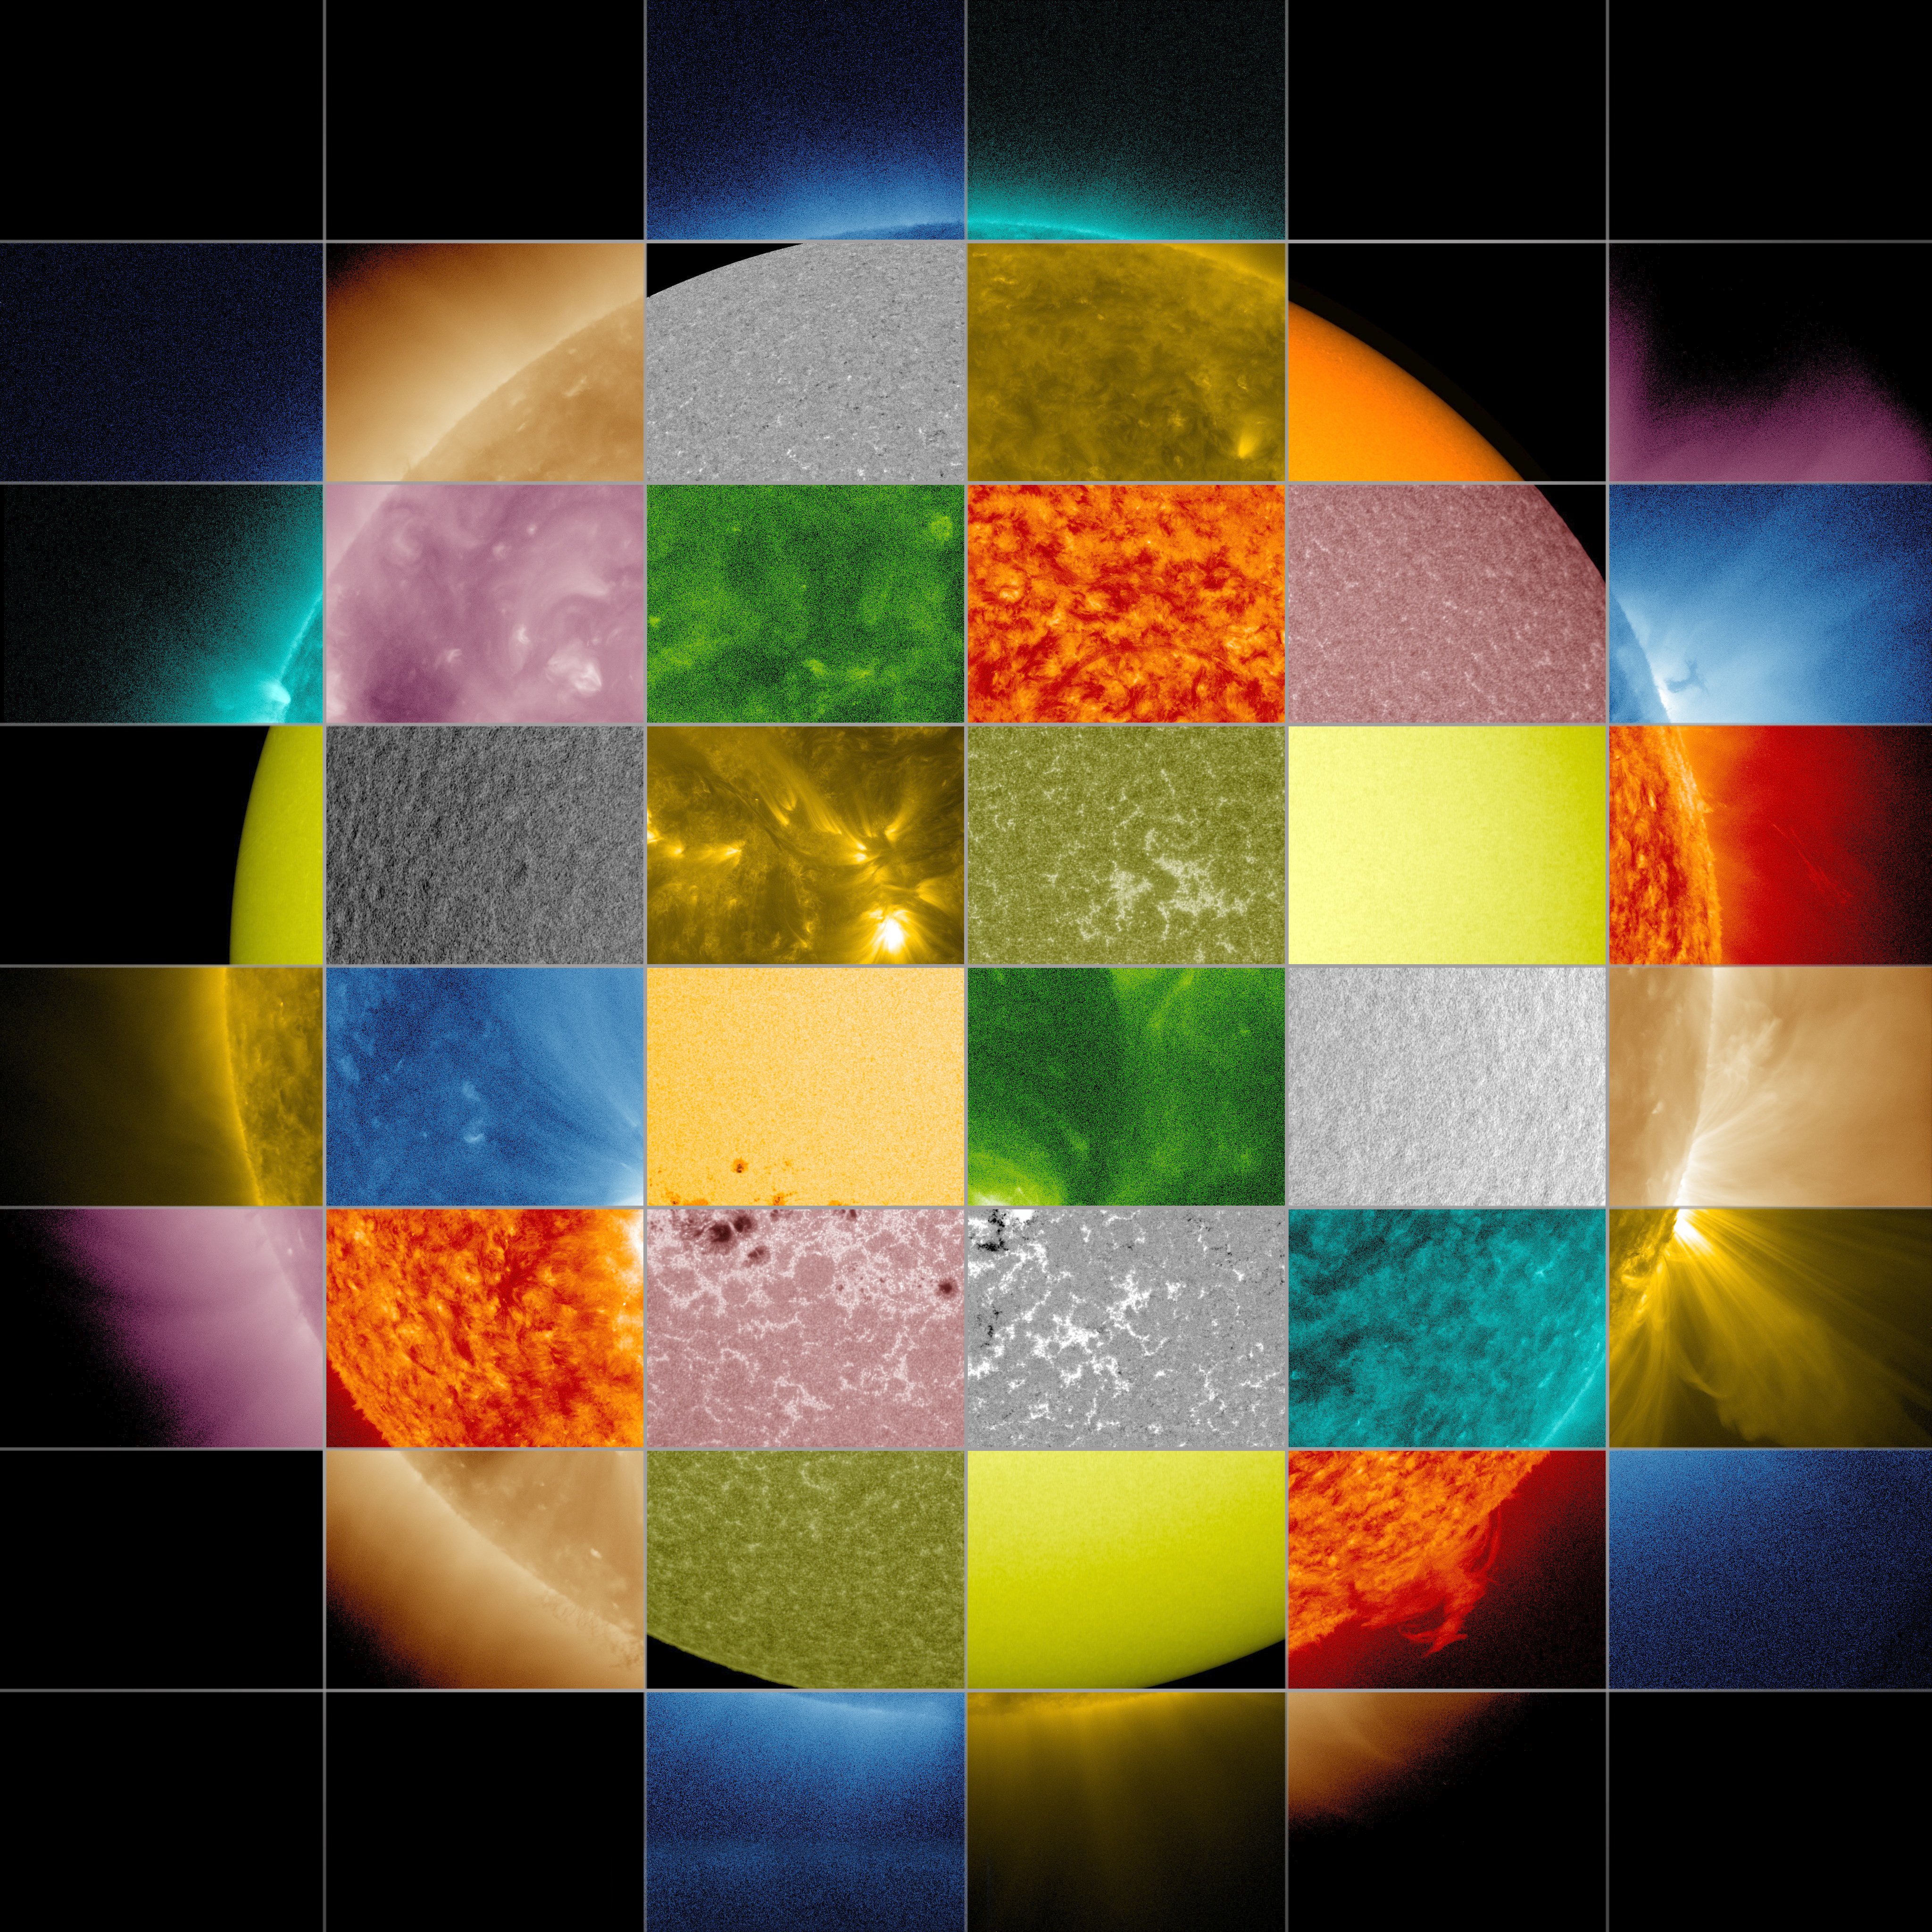
Instruments that produce conventional images of the sun focus exclusively on light around one particular wavelength, sometimes not one that is visible to the naked eye. SDO scientists, for example, chose 10 different wavelengths to observe for its Atmospheric Imaging Assembly (AIA) instrument. Each wavelength is largely based on a single, or perhaps two types of ions — though slightly longer and shorter wavelengths produced by other ions are also invariably part of the picture. Each wavelength was chosen to highlight a particular part of the sun's atmosphere.
From the sun's surface on out, the wavelengths SDO observes, measured in angstroms, are:
4500: Showing the sun's surface or photosphere.
1700: Shows surface of the sun, as well as a layer of the sun's atmosphere called the chromosphere, which lies just above the photosphere and is where the temperature begins rising.
1600: Shows a mixture between the upper photosphere and what's called the transition region, a region between the chromosphere and the upper most layer of the sun's atmosphere called the corona. The transition region is where the temperature rapidly rises.
304: This light is emitted from the chromosphere and transition region.
171: This wavelength shows the sun's atmosphere, or corona, when it's quiet. It also shows giant magnetic arcs known as coronal loops.
193: Shows a slightly hotter region of the corona, and also the much hotter material of a solar flare.
211: This wavelength shows hotter, magnetically active regions in the sun's corona.
335: This wavelength also shows hotter, magnetically active regions in the corona.
94: This highlights regions of the corona during a solar flare.
131: The hottest material in a flare.


Related
For More Information
Credits
NASA/SDO/Goddard Space Flight Center
https://svs.gsfc.nasa.gov/11071
Mission:
SDO
Data Used: Note: While we identify the data sets used in these visualizations, we do not store any further details nor the data sets themselves on our site.
This item is part of this series:
Solar Snapshots
Keywords:
GCMD >> Earth Science >> Sun-earth Interactions
GCMD >> Earth Science >> Sun-earth Interactions >> Solar Activity >> Solar Ultraviolet
SVS >> Space Weather
SVS >> SDO
SVS >> Solar Dynamics Observatory
SVS >> Heliophysics
SVS >> Corona
NASA Science >> Sun
GCMD keywords can be found on the Internet with the following citation: Olsen, L.M., G. Major, K. Shein, J. Scialdone, S. Ritz, T. Stevens, M. Morahan, A. Aleman, R. Vogel, S. Leicester, H. Weir, M. Meaux, S. Grebas, C.Solomon, M. Holland, T. Northcutt, R. A. Restrepo, R. Bilodeau, 2013. NASA/Global Change Master Directory (GCMD) Earth Science Keywords. Version 8.0.0.0.0


