Hyperwall Stories
Overview
Visualizations that are ready to use on NASA's hyperwall. Curated collections on various topics are available below, but you can also search all visualizations for hyperwall-ready items.
New
- ID: 30699 Hyperwall Visual
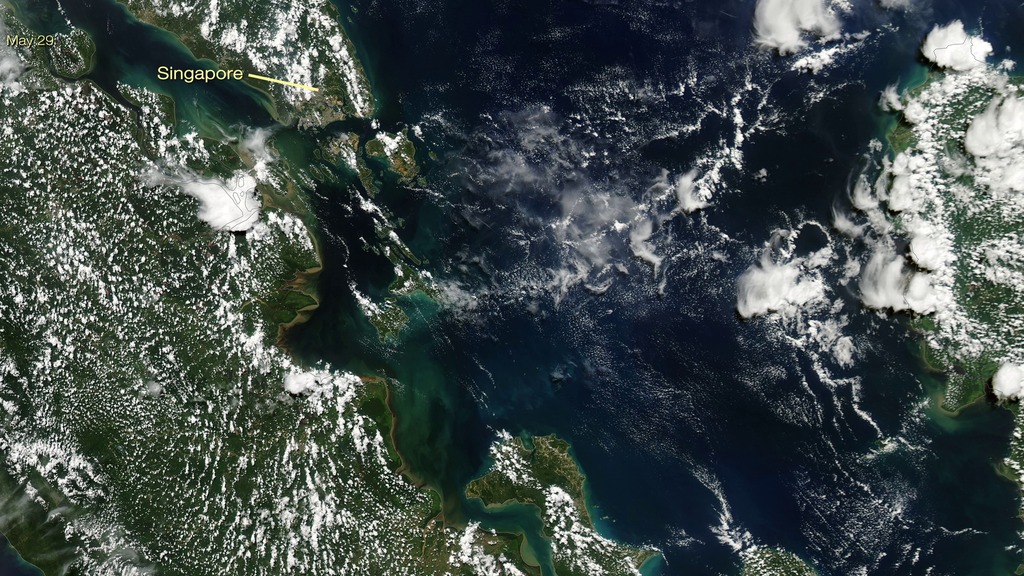
Hazardous Air Quality Conditions in Singapore
Go to this pageSingapore region on September 24 and May 25, 2015, MODIS data only || singapore_smog_24_1080p_print.jpg (1024x576) [279.3 KB] || singapore_smog_24_1080p_searchweb.png (180x320) [129.9 KB] || singapore_smog_24_1080p_thm.png (80x40) [8.0 KB] || singapore_smog_24_1080p.mp4 (1920x1080) [7.0 MB] || singapore_smog_24_720p.mp4 (1280x720) [3.8 MB] || singapore_smog_24_720p.webm (1280x720) [4.6 MB] || singapore_modis_only_24_2304p.mp4 (4096x2304) [20.4 MB] || singapore_smog_24_360p.mp4 (640x360) [1.2 MB] || singapore_smog_ver2a.key [8.5 MB] || singapore_smog_ver2a.pptx [5.8 MB] ||
- Section

- ID: 4357 Visualization
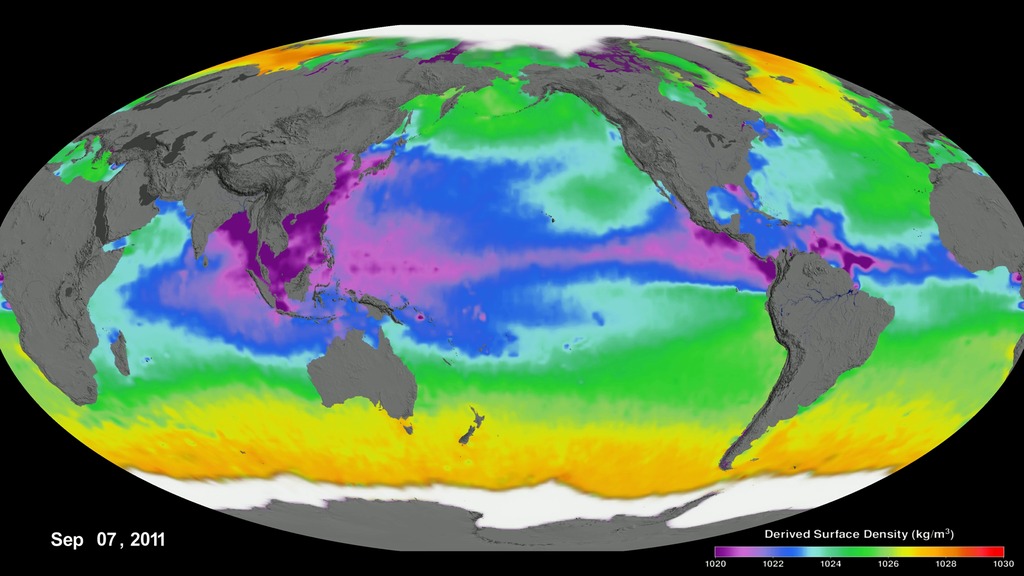
Aquarius Sea Surface Density
Go to this pageSea surrface density is derived from Aquarius science products and generated by the NASA Goddard Space Flight Center's Aquarius Data Processing System. It is very important because sea surface density drives formation of ocean water masses and three-dimensional ocean circulation. As water parcels sink and move through the ocean, their densities will be modified by mixing with other parcels of seawater. However, if the density signatures of all the end member water masses are known, this mixing can be "unraveled" to determine the proportions of their various source waters. This animation shows the changes of sea surface density from September 7, 2011 to May 20, 2015. ||
- ID: 4332 Visualization

Aquarius Sea Surface Temperature 2011 - 2015
Go to this pageAquarius is an international effort to measure sea surface salinity and learn about the interaction between ocean circulation, the water cycle and climate. Besides salinity, Aquarius also measures sea surface temperature because salinity and temperature determines seawater density and buoyancy. Sea-surface density drives formation of ocean water masses and three-dimensional ocean circulation. Thus better understanding of ocean salinity and temperature improves understanding of the ocean's capacity to store and transport heat. The animation shows the changes of sea surface temporature from September 7, 2011 to May 20, 2015. ||
- ID: 4398 Visualization
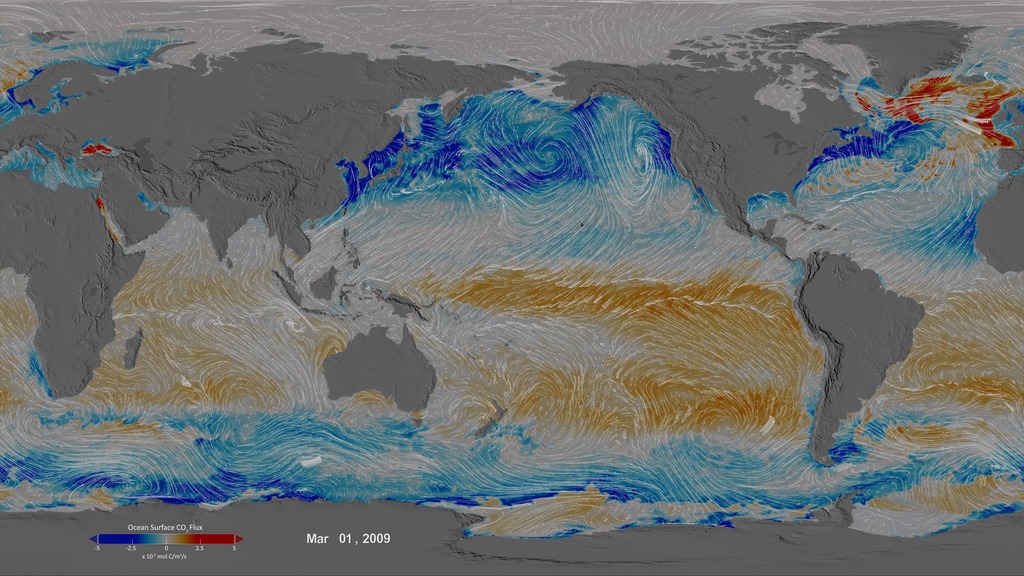
Ocean Surface CO2 Flux with Wind Stress
Go to this pageThis animation shows the ocean surface CO2 flux between 1/1/2009 and 12/31/2010. Blue colors indicate uptake and orange-red colors indicate outgassing of ocean carbon. The pathlines indicate surface wind stress. || CO2flux_windStress.00480_print.jpg (1024x576) [213.6 KB] || CO2flux_windStress.00480_searchweb.png (180x320) [97.8 KB] || CO2flux_windStress.00480_thm.png (80x40) [7.2 KB] || CO2flux_windStress_1080p30.webm (1920x1080) [23.4 MB] || 3840x2160_16x9_30p (3840x2160) [512.0 KB] || 5760x3240_16x9_30p (5760x3240) [512.0 KB] || CO2flux_windStress_1080p30.mp4 (1920x1080) [673.7 MB] || CO2flux_windStress_2160p30.mp4 (3840x2160) [1.7 GB] || CO2flux_windStress_4398.key [679.6 MB] || CO2flux_windStress_4398.pptx [677.0 MB] || CO2flux_windStress_1080p30.mp4.hwshow [201 bytes] ||
- Section
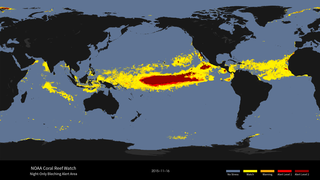
NOAA Coral Reef Watch 2015
Go to this sectionThe NOAA Coral Reef Watch (CRW) daily 5-km satellite Bleaching Alert Area product presented here outlines the areas where coral bleaching thermal stress currently reaches various bleaching stress levels, based on our satellite sea surface temperature (SST) monitoring.
- Section
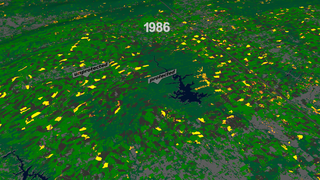
A Quarter Century US Forest Disturbance History from Landsat – the NAFD-NEX Products
Go to this sectionVisualization showing forest change in various locations from 1986 to 2010
- Section
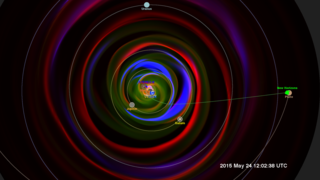
Space Weather to the Edge of the Solar System
Go to this sectionCropped view of the Enlil model from early 2015 to just after the New Horizons flyby of Pluto.
Science Missions
- ID: 40243 Gallery

Hyperwall Earth
Go to this pageHyperwall stories in the Earth Category
Return to Main Hyperwall Gallery. - ID: 40245 Gallery

Hyperwall Sun
Go to this pageHeliophysics related hyperwall ready visualizations
Return to Main Hyperwall Gallery. - ID: 40246 Gallery

Hyperwall Planets
Go to this pageHyperwall-ready visualizations featuring planets, moon, and small bodies
Return to Main Hyperwall Gallery. - ID: 40244 Gallery

Hyperwall Universe
Go to this pagehyperwall-ready visualizations about astrophysics
Return to Main Hyperwall Gallery. - ID: 40264 Gallery

Hyperwall ISS
Go to this pageThe presence of the space station in low-Earth orbit provides a unique vantage point for collecting Earth and space science data. From an average altitude of about 400 km, details in such features as glaciers, agricultural fields, cities, and coral reefs taken from the ISS can be layered with other sources of data, such as orbiting satellites, to compile the most comprehensive information available. Return to Main Hyperwall Gallery.
Events
content assmbled for specific events
- ID: 40238 Gallery
Hyperwall Stories for specific event
Go to this pageThe hyperwall gallery features visualizations that have been selected for use at NASA's hyperwall at event
Return to Main Hyperwall Gallery.
Mailing list archive
Lists of content that have been used for the hyperwall Mailing list
- ID: 40263 Gallery
Hyperwall 10 Sep 2015
Go to this pageContent from the September 10, 2015 Hyperwall Content News mailing list
- ID: 40277 Gallery

Hyperwall 20 Nov 2015
Go to this pageContent from the November 20, 2015 Hyperwall Content News mailing list