Conference Videos
IEEE Visualization
- ID: 10 Visualization

Restorer: A Visualization Technique for Handling Missing Data
Go to this pageRestorer is a visualization technique for indicating the location of missing data in a scientific visualization. Rather than filling missing data regions with interpolated data colored with the same scale as real data or simply leaving such regions empty, the restorer technique fills the regions with interpolated data colored with a color table with only luminance values. This technique allows missing data to be indicated clearly without distracting from the content of the real data. ||
SIGGRAPH
- ID: 40002 Gallery
- ID: 40003 Gallery
- ID: 40004 Gallery
- ID: 2175 Visualization
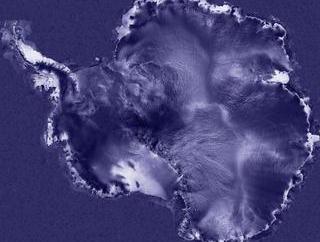
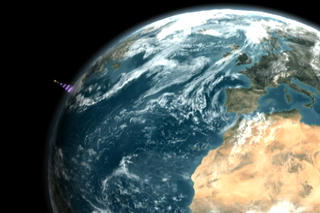
Antarctica: A Flying Tour of the Frozen Continent
Go to this pageNarrated tour of Antarctica through the eyes of RADARSAT. Completed and accepted for the SIGGRAPH 2001 Computer Animation Festival. ||
- ID: 2133 Visualization
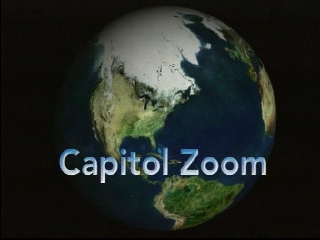
Capitol Zoom - SIGGRAPH 2001 Final Submission
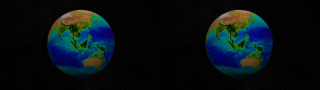
Go to this pageCapital Zoom is a seamless, cloudless zoom-in from a global view down to the nation's Capitol building that is composed entirely of satellite data. This data includes IKONOS 1 meter data, Landsat-7 15/30 meter data, Terra/MODIS 250 meter data, and Terra/MODIS 8 kilometer data. The visualization first zoomsin seamlessly, then zooms out/in showing where the different data set layers reside.This visualization has been accepted to SIGGRAPH 2001. It includes narration. This visualization was created using Maya for motion control, Renderman forrendering, IDL for pre-processing of the data, Imagine for image registration, and Photoshop for color matching. ||
- ID: 287 Visualization

Visualizing El Niño
Go to this pageA narrated tape on the 1997 El Niño, showing the effects of El Niño through animations. ||
- ID: 3180 Visualization
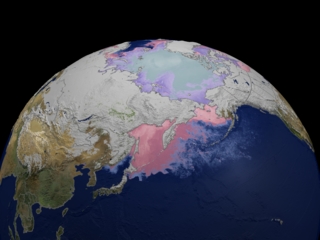
MODIS Daily Global Snow Cover and Sea Ice Surface Temperature as seen in the SIGGRAPH 2005 Electronic Theater
Go to this pageThis animation showing snow cover and sea ice surface temperature in the Northern Hemisphere portrays data collected from daily MODIS satellite images acquired during the winter of 2002-2003. Darkness increases with the onset of autumn, reaching a maximum at the Winter Solstice on December 21st. Thereafter, the circle of darkness shrinks as the period of daylight increases. Daily changes in sea ice are shown as ice surface temperature, which is related to the air temperature and the concentration of the sea ice. Sea ice surface temperatures range from about -40 to -2 degrees Celsius. Here, ice surface temperatures are depicted by colors, described by a color bar shown below. The snow tracks of several winter storms across the United States can be clearly seen. With an albedo of up to 80 percent or more, snow-covered terrain reflects most of the incoming solar radiation back into space, cooling the lower atmosphere. When snow cover melts, the albedo drops suddenly to less than about 30 percent, allowing the ground to absorb more solar radiation, heating the Earth's surface and lower atmosphere. Rapid changes in albedo, resultingfrom snowfall and snow melt, cause significant changes in the regional energy balance. This animation was accepted into the prestigious 2005 SIGGRAPH Electronic Theater, where it was shown during the annual conference from July 31 through August 4, 2005 in Los Angeles, CA. For more information on the data sets used in this visualization, visit NASA's EOS DAAC website. ||
SuperComputing
- ID: 2641 Visualization
The SC2002 Conference Opening Video
Go to this pageThis video introduced the latest in high-performance computing and communications and the best of host city Baltimore to keynote address attendees at the SuperComputing 2002 (SC2002) conference on Tuesday, November 19, 2002. || a002641.00010_print.png (720x480) [597.0 KB] || a002641_pre.jpg (320x262) [15.2 KB] || SVS2002-0034_The_SC2002_Conference_Opening_Video.webmhd.webm (960x540) [106.4 MB] || SVS2002-0034_The_SC2002_Conference_Opening_Video.mov (720x480) [1.6 GB] || a002641.dv (720x480) [1.4 GB] || a002641.mp4 (640x480) [82.9 MB] || a002641.mpg (320x240) [72.2 MB] ||
- ID: 737 Visualization

Images of Earth and Space: SC99 Edition
Go to this pageFrom our home planet to distant neutron stars, this narrated video tape presents recent scientific visualizations of observation and simulation data. We begin with a dramatic journey over SC99 host city Portland and its surroundings. Later explorations accompany the X-33 aerospace plane on its first test flight, witness Mississippi River flooding, and follow global life over 22 months. New views of Mars reveal a basin that could swallow Mount Everest, while a simulation tests how rovers would navigate the red planet's terrain. We conclude with the first-ever supercomputer model producing a black hole from two merging neutron stars. ||
- ID: 329 Visualization
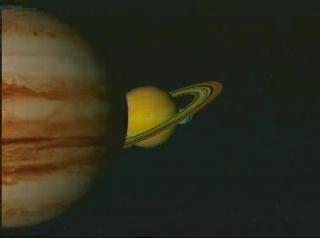
Images of Earth and Space II
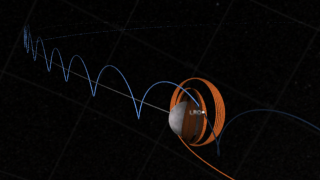
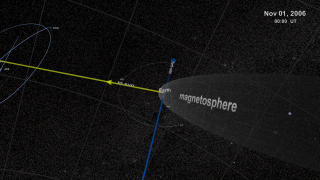
Go to this pageThis videotape tours the Solar System and outer space using scientific visualizations from Goddard Space Flight Center, Jet Propulsion Laboratory, and the HPCC Earth and Space Sciences Project. At the Sun, simulations investigate processes that create magnetic field and release energetic particles. Earth science begins with the Pacific Ocean, studying the 1997-98 El Niño and Cyclone Susan. Crossing the globe, visualizations trace North America's East Coast and ocean currents in the North Atlantic Ocean. The lights of the world's cities then show human impact. Next, two models probe nearby-space phenomena, fluid behavior in microgravity conditions and an asteroid collision. A jaunt to Mars explores the mountains and trenches of its dry, rocky exterior. The video concludes at a binary neutron star system, where two city-sized objects with the Sun's mass merge in a titanic explosion. ||
- ID: 251 Visualization
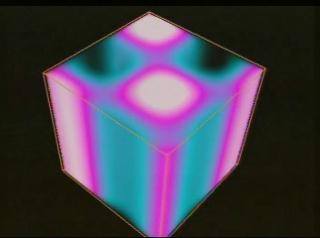
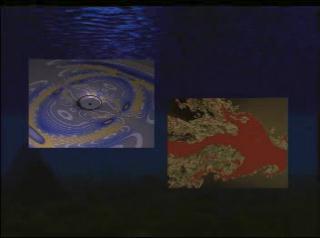
Images of Earth and Space: SC97 Edition
Go to this pageThe entire narrated Images video made for Supercomputing 97 || a000251_pre.jpg (320x238) [8.0 KB] || a000251_thm.png (80x40) [3.8 KB] || a000251_pre_searchweb.jpg (320x180) [45.9 KB] || preview_made_from_dv.00450_print.png (352x240) [104.0 KB] || a000251.webmhd.webm (960x540) [63.8 MB] || a000251.mpg (352x240) [156.0 MB] ||
- ID: 110 Visualization
Images of Earth and Space: Supercomputing 96
Go to this pageThis animation includes seven visualizations from Goddard Space Flight Center, Jet Propulsion Laboratory, and NASA HPCC Earth and Space Sciences Project investigators. In order of appearance, they are stellar turbulence, 3D colliding black holes, star formation, solar surge, Hurricane Florence, Southern California fly-over, and a running skeleton. Classical music accompanies the visuals. ||
- ID: 97 Visualization
Images of Earth and Space: The Role of Visualization in NASA Science
Go to this pageThis compilation video contains visualizations of Earth and Space Sciences resulting from supercomputer models. The excerpted visualizations include: Ocean Planet, El Niño, Ozone 1991, Clouds, Changes in Glacier Bay, Alaska, Biosphere, Lunar Topography from the Clementine Mission, Musculoskeletal Modeling Dynamic Simulations, Simulations of the Breakup and Dynamical Evolution of Comet Shoemaker-Levy 9, Convective Penetration in Stellar Interiors, Topological Features of a Compressible Plasma Vortex Sheet: A Model for the Outer Heliospheric Solar Wind, R-Aquarii Jet, The Evolution of Distorted Black Holes, Rayleigh-Taylor Instability in a Supernova, Galaxy Harassment, N-Body Simulation of the Cold Dark Matter Cosmology. ||