Global Ocean Color from PACE: Apparent Visible Wavelength (AVW) – Updated Daily
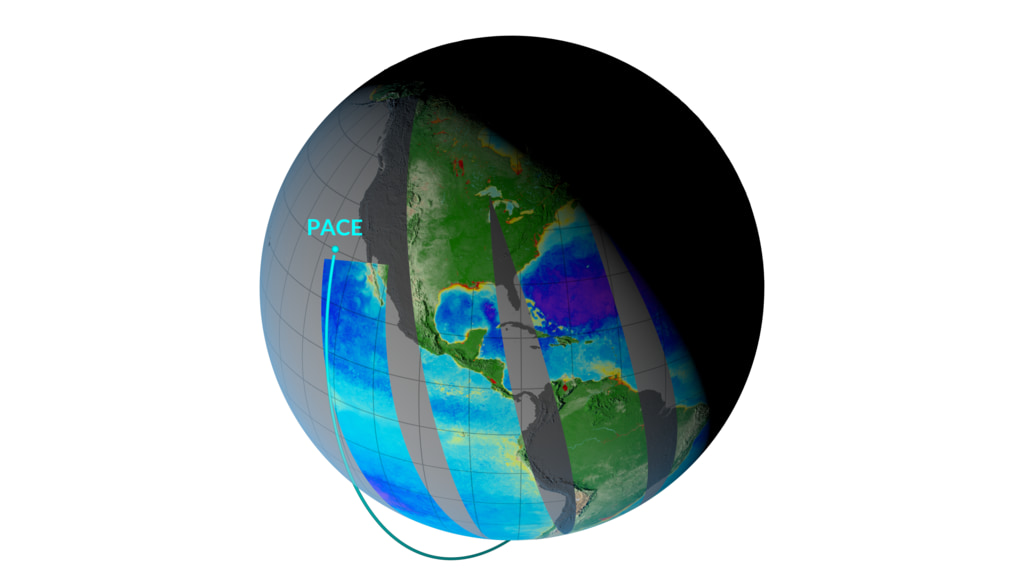
NASA’s Plankton, Aerosol, Cloud, ocean Ecosystem (PACE) mission, launched in 2024, provides new insights into ocean color and its changes over time. The Ocean Color Instrument aboard PACE observes the ocean in hyperspectral color, across several hundred wavelengths of visible, near-infrared, and ultraviolet light, allowing scientists to monitor phytoplankton and other changes in ocean color. Using PACE data, researchers calculate the average color of the ocean by simplifying the measured spectrum of light into a single value known as apparent visible wavelength (AVW).
The visualizations on this page use a running 30-day average of PACE AVW data. They are updated daily as new data becomes available.
This visualization shows global apparent visible wavelength (AVW) from NASA's PACE mission in an Atlantic-centered rectangular projection. Bluer ocean colors generally indicate lower phytoplankton concentrations, while greener and yellower colors suggest higher concentrations. Daily sea ice is shown in light gray. The animation is automatically updated as new data becomes available.

This image shows the most recent available apparent visible wavelength (AVW) data from NASA's PACE mission in an Atlantic-centered rectangular projection. Bluer ocean colors generally indicate lower phytoplankton concentrations, while greener and yellower colors suggest higher concentrations. Daily sea ice is shown in light gray. The image is automatically updated as new data becomes available.
This visualization shows global apparent visible wavelength (AVW) from NASA's PACE mission in a Pacific-centered rectangular projection. Bluer ocean colors generally indicate lower phytoplankton concentrations, while greener and yellower colors suggest higher concentrations. Daily sea ice is shown in light gray. The animation is automatically updated as new data becomes available.
This image shows the most recent available apparent visible wavelength (AVW) data from NASA's PACE mission in a Pacific-centered rectangular projection. Bluer ocean colors generally indicate lower phytoplankton concentrations, while greener and yellower colors suggest higher concentrations. Daily sea ice is shown in light gray. The image is automatically updated as new data becomes available.
This visualization shows global apparent visible wavelength (AVW) from NASA's PACE mission using a Robinson map projection centered on the Atlantic Ocean. Bluer ocean colors generally indicate lower phytoplankton concentrations, while greener and yellower colors suggest higher concentrations. Daily sea ice is shown in light gray. The animation is automatically updated as new data becomes available.
This image shows the most recent available apparent visible wavelength (AVW) data from NASA's PACE mission in an Atlantic-centered Robinson map projection. Bluer ocean colors generally indicate lower phytoplankton concentrations, while greener and yellower colors suggest higher concentrations. Daily sea ice is shown in light gray. The image is automatically updated as new data becomes available.
This visualization shows global apparent visible wavelength (AVW) from NASA's PACE mission using a Pacific-centered Robinson map projection. Bluer ocean colors generally indicate lower phytoplankton concentrations, while greener and yellower colors suggest higher concentrations. Daily sea ice is shown in light gray. The animation is automatically updated as new data becomes available.
This image shows the most recent available apparent visible wavelength (AVW) data from NASA's PACE mission in a Pacific-centered Robinson map projection. Bluer ocean colors generally indicate lower phytoplankton concentrations, while greener and yellower colors suggest higher concentrations. Daily sea ice is shown in light gray. The image is automatically updated as new data becomes available.
This visualization shows global apparent visible wavelength (AVW) from NASA's PACE mission in an Atlantic-centered rectangular projection. Bluer ocean colors generally indicate lower phytoplankton concentrations, while greener and yellower colors suggest higher concentrations. Daily sea ice is shown in light gray. This version omits the on-screen date labels and color legend.
This visualization shows global apparent visible wavelength (AVW) from NASA's PACE mission in a Pacific-centered rectangular projection. Bluer ocean colors generally indicate lower phytoplankton concentrations, while greener and yellower colors suggest higher concentrations. Daily sea ice is shown in light gray. This version omits the on-screen date labels and color legend.
Credits
-
Data visualizer
- Kel Elkins (Science and Technology Corporation)
-
Scientists
- Morgaine McKibben (SSAI)
- Matthew Kehrli (GSFC)
Missions
This page is related to the following missions:Datasets used
-
AVW (Apparent Visible Wavelength (AVW)) [PACE: OCI]
ID: 1296
Note: While we identify the data sets used on this page, we do not store any further details, nor the data sets themselves on our site.
Related
- ID: 5683
 Visualization
- ID: 5432
 Visualization
- ID: 5259
 Visualization
- ID: 5185
 Visualization
Release date
This page was originally published on Tuesday, November 10, 2026.
This page was last updated on Tuesday, November 10, 2026 at 10:06 AM EST.