Science On A Sphere: Aerosols in the Air
Science On a Sphere Content
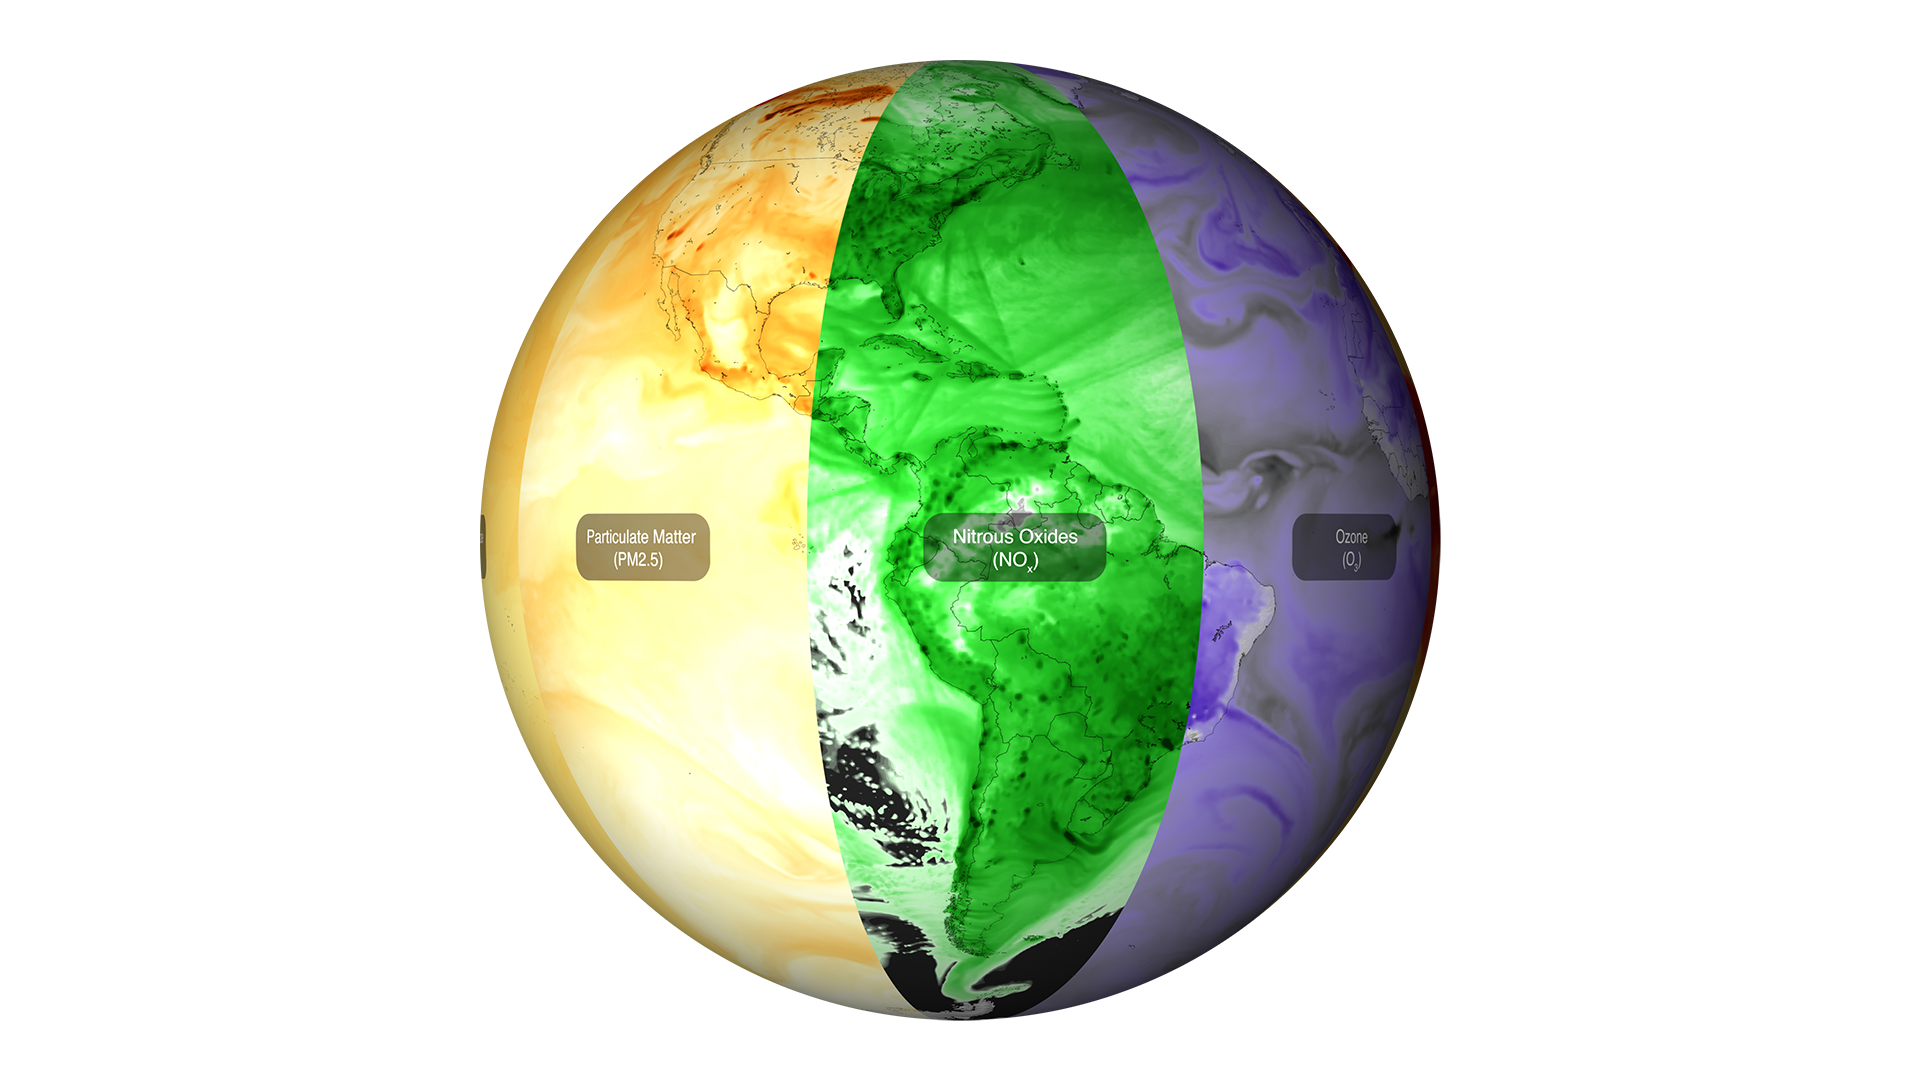
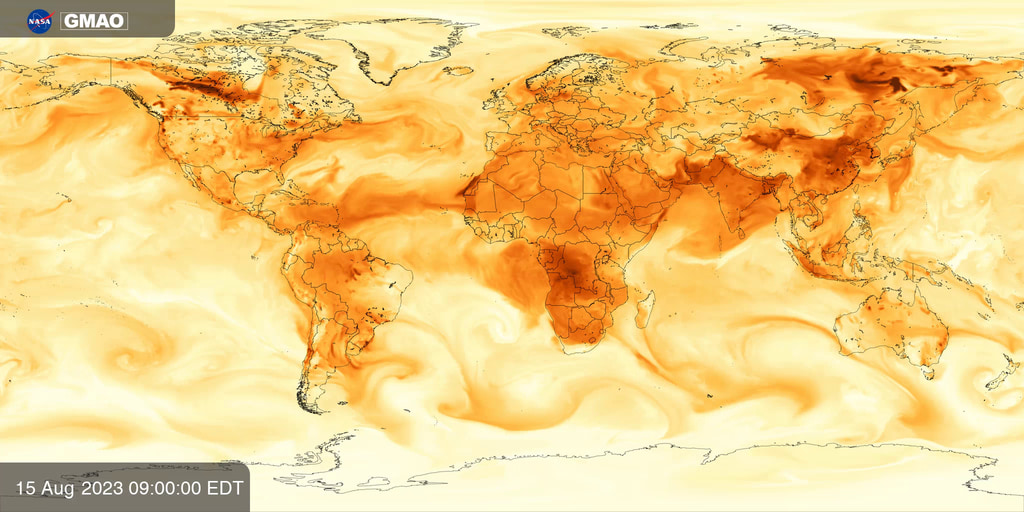
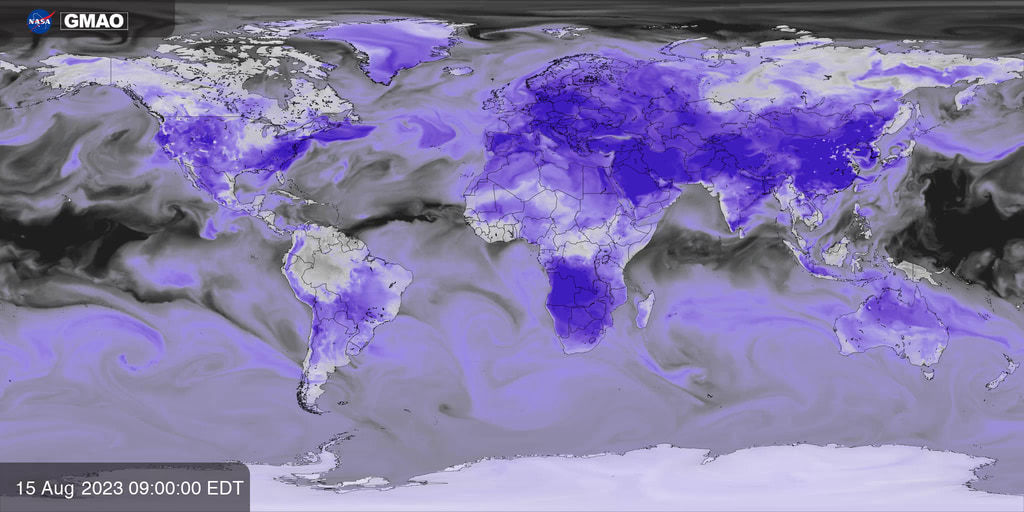
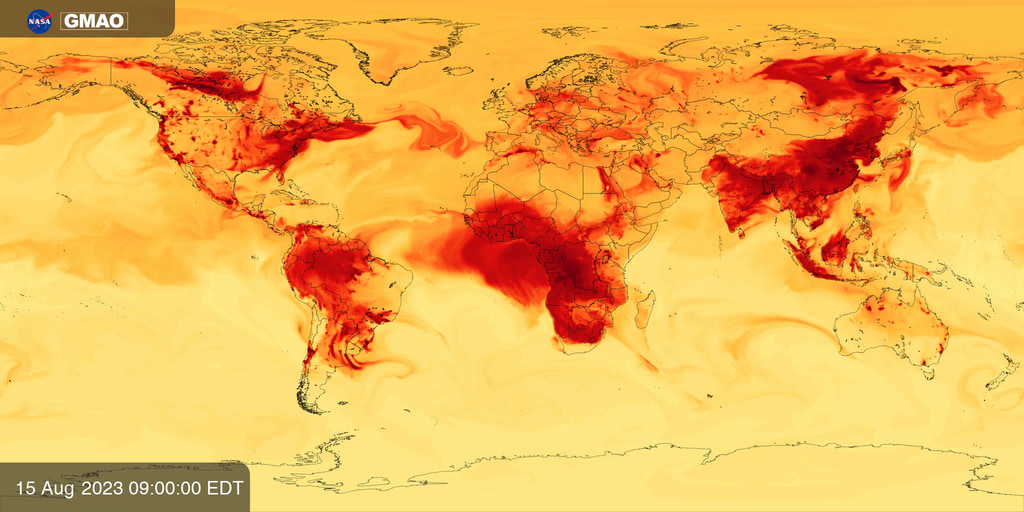
NASA merges satellite and ground-based observations, advanced models, and computing power to study aerosols in the atmosphere. Aerosols are tiny solid or liquid particles that float in the atmosphere and can travel long distances, affecting air quality and visibility far from their sources. These particles come from natural and human sources and include sea salt (cyan), dust (magenta), black carbon (orange/red), and sulfates (green). For instance, in South America you can see black carbon from fires burning in the Amazon rainforest, and over the Atlantic you can see Saharan dust wafting from North Africa towards the Americas. This visualization covers the period from August 1 to September 14, 2024, and is based on NASA's Goddard Earth Observing System (GEOS) model, which delivers realistic, high-resolution weather and aerosol data that enable customized environmental prediction and advances in AI research.
NASA uses satellites, ground measurements, and powerful computer models to track tiny particles floating in our air called aerosols. These small solid or liquid particles can travel thousands of miles, affecting the air we breathe and how far we can see, even far from where they originated.
This visualization shows how these particles moved through Earth's atmosphere from August 1-September 14, 2024. Different colors represent different types of aerosols: sea salt (blue), dust (pink/magenta), smoke from fires (orange/red), and sulfates from pollution and volcanoes (green).
The visualization highlights several atmopsheric phenomena:
Hurricanes and Typhoons: Hurricane Ernesto in the Atlantic Ocean pulls in dust from Africa, while Typhoon Ampil near Japan draws pollution from mainland Asia. The storms' powerful winds churn up ocean water, creating sea salt particles visible as blue spirals.
Saharan Dust Journey: Desert dust from the Sahara travels all the way across the Atlantic Ocean, creating hazy skies in the Caribbean and affecting air quality as far away as Texas and Florida during summer 2024.
Volcanic Plumes: Hawaii's Kilauea Volcano released a narrow stream of sulfate particles moving westward.
Wildfire Smoke:
In southern Africa, seasonal agricultural burning created smoke that drifted over the Atlantic Ocean
South America faced record-breaking wildfires in 2024, creating a river-like flow of smoke particles that affected major Brazilian cities
Canada experienced its second-worst wildfire season on record, with smoke traveling as far as northern Europe
The swirling blue patterns over oceans show sea salt kicked up by strong winds.
This visualization helps us understand how our atmosphere connects distant parts of the world. What happens in one region—whether natural events or human activities—can affect weather patterns and air quality thousands of miles away. By tracking these movements, NASA helps communities prepare for changes in air quality and visibility while advancing our understanding of Earth's complex atmospheric system.
The visualization was developed using NASA’s Goddard Earth Observing System (GEOS), a complex modeling and data assimilation system that creates global analyses of the Earth System. GEOS integrates satellite observations, in situ measurements, and approximately one million weather observations collected hourly to inform its models. Through the GEOS Forward Processing (FP) product, the system generates both analyses and forecasts in near real-time. Images for this visualization were created by NASA’s Global Modeling and Assimilation Office (GMAO).
 model.")
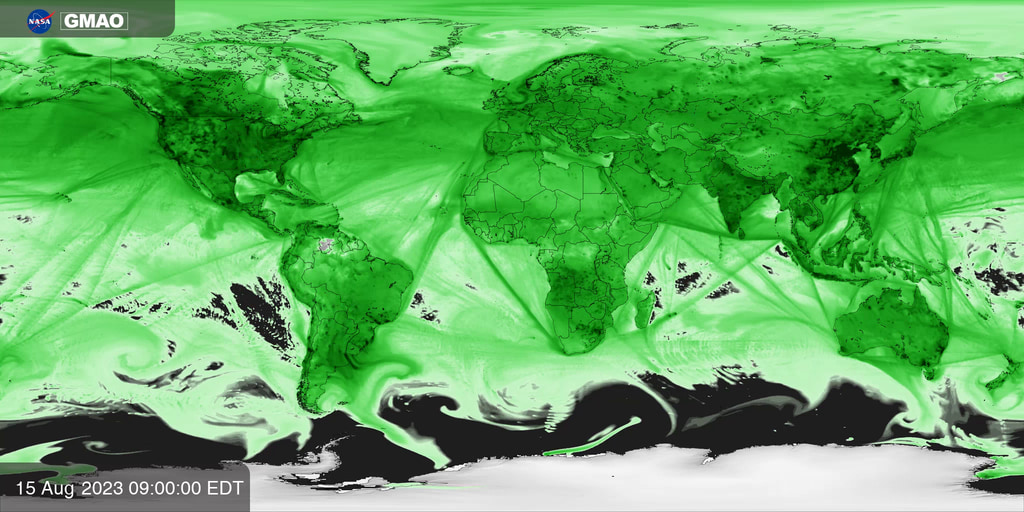
Representative still image of the aerosols visualization.
Aerosols in the Air (Equirectangular Projection)
Visualization showcasing aerosols by NASA's Goddard Earth Observing (GEOS) model. Labels have been skewed to ensure proper display when wrapped on a sphere.
Visualization showcasing aerosols by NASA's Goddard Earth Observing (GEOS) model. This version does not include labels.
This frame set provides labels with transparency that can be overlaid for compositing purposes. Labels have been skewed to ensure proper display when wrapped on a sphere.

Colorbar of the aerosols visualizaton. This still image is provided with transparency for compositing purposes.

Vertical colorbar of the aerosols visualization. This still image is provided with transparency for compositing purposes.
Credits
NASA’s Global Modeling and Assimilation Office and NASA's Scientific Visualization Studio.
-
Visualizers
- Joseph V. Ardizzone (NASA/GSFC)
-
Helen-Nicole Kostis
(USRA)

-
Scientist
-
Lesley Ott
(NASA/GSFC)
-
Lesley Ott
(NASA/GSFC)
-
Technical support
- Laurence Schuler (ADNET Systems, Inc.)
- Ian Jones (ADNET Systems, Inc.)
- Ella Kaplan (Global Science and Technology, Inc.)
Datasets used
-
GEOS-FP
ID: 1196Documentation: Lucchesi, R., 2018: File Specification for GEOS FP. GMAO Office Note No. 4 (Version 1.2), 61 pp, available from https://gmao.gsfc.nasa.gov/pubs/docs/Lucchesi1203.pdf
This dataset can be found at: https://fluid.nccs.nasa.gov/weather/
See all pages that use this dataset
Note: While we identify the data sets used on this page, we do not store any further details, nor the data sets themselves on our site.
Citing this page
Related
- ID: 5533
 Visualization
 - ID: 5518
 Visualization
 - ID: 5151
 Visualization
 - ID: 5152
 Visualization
 - ID: 5153
 Visualization
 - ID: 5154
 Visualization
Alternate Versions
- ID: 5572
 Visualization
Release date
This page was originally published on Monday, June 23, 2025.
This page was last updated on Friday, August 8, 2025 at 11:56 AM EDT.