Change in Night Lights between 2012 and 2023
This global, flat map view of night lights data begins with a time series depicting annual averages from 2012 to 2023. The lights then fade away to reveal night lights change between 2012 and 2023, with regions of more light depicted in purple and regions with less light depicted in orange. The sequence then repeats with two pop-out, zoomed-in views of India and Ukraine.
Discover the pivotal role of NASA's Black Marble in bridging scientific discovery and actionable environmental stewardship. By capturing Earth's night lights, Black Marble reveals both the planet's beauty and the profound impact of human activities. This webpage showcases newly developed nighttime light maps comparing changes observed from 2012 to 2023, offering a decade-long perspective on urban growth, infrastructure development, and the socioeconomic dynamics of communities worldwide. This data empowers users to foster informed, sustainable practices that enhance community resilience and mitigate the adverse effects of climate change. By illuminating the intricate interplay between human activity and the environment, Black Marble underpins a human-centered approach to environmental change, promoting a future where scientific innovation leads to tangible, positive impacts on global sustainability.
2023 annual average night lights data presented on a 3D, spinning Earth. This video can be looped.
Night lights change between 2012 and 2023, with regions of more light depicted in purple and regions with less light depicted in orange. Presented on a 3D, spinning Earth. This video can be looped.
Time series view (2012-2023) of night lights on a flat map.


Image comparison showing 2012 and 2023 night lights on a flat map.
 still image - Global flat map view of night light changes between 2012 and 2023. Areas with more light are purple and areas with less light are orange. Color bar included in image.")
8k resolution (7680 × 4320) still image - Global flat map view of night light changes between 2012 and 2023. Areas with more light are purple and areas with less light are orange. Color bar included in image.
 still image - Global flat map view of night light changes between 2012 and 2023. Areas with more light are purple and areas with less light are orange.")
8k resolution (7680 × 4320) still image - Global flat map view of night light changes between 2012 and 2023. Areas with more light are purple and areas with less light are orange.
 still image - Global flat map view of night light changes between 2012 and 2023. Areas with more light are purple and areas with less light are orange. This view includes two pop-out views of Ukraine and India. Color bar included in image.")
8k resolution (7680 × 4320) still image - Global flat map view of night light changes between 2012 and 2023. Areas with more light are purple and areas with less light are orange. This view includes two pop-out views of Ukraine and India. Color bar included in image.

Color bar legend for night lights change. Purples represent more light. Oranges represent less light. White represents no change in lights.
Time series view (2012-2023) of night lights on a black background.
 still image - Global flat map view of night light changes between 2012 and 2023. Areas with more light are purple and areas with less light are orange. This version on a black background.")
8k resolution (7680 × 4320) still image - Global flat map view of night light changes between 2012 and 2023. Areas with more light are purple and areas with less light are orange. This version on a black background.
Time series view (2012-2023) of night lights on a flat map. View is centered on India.
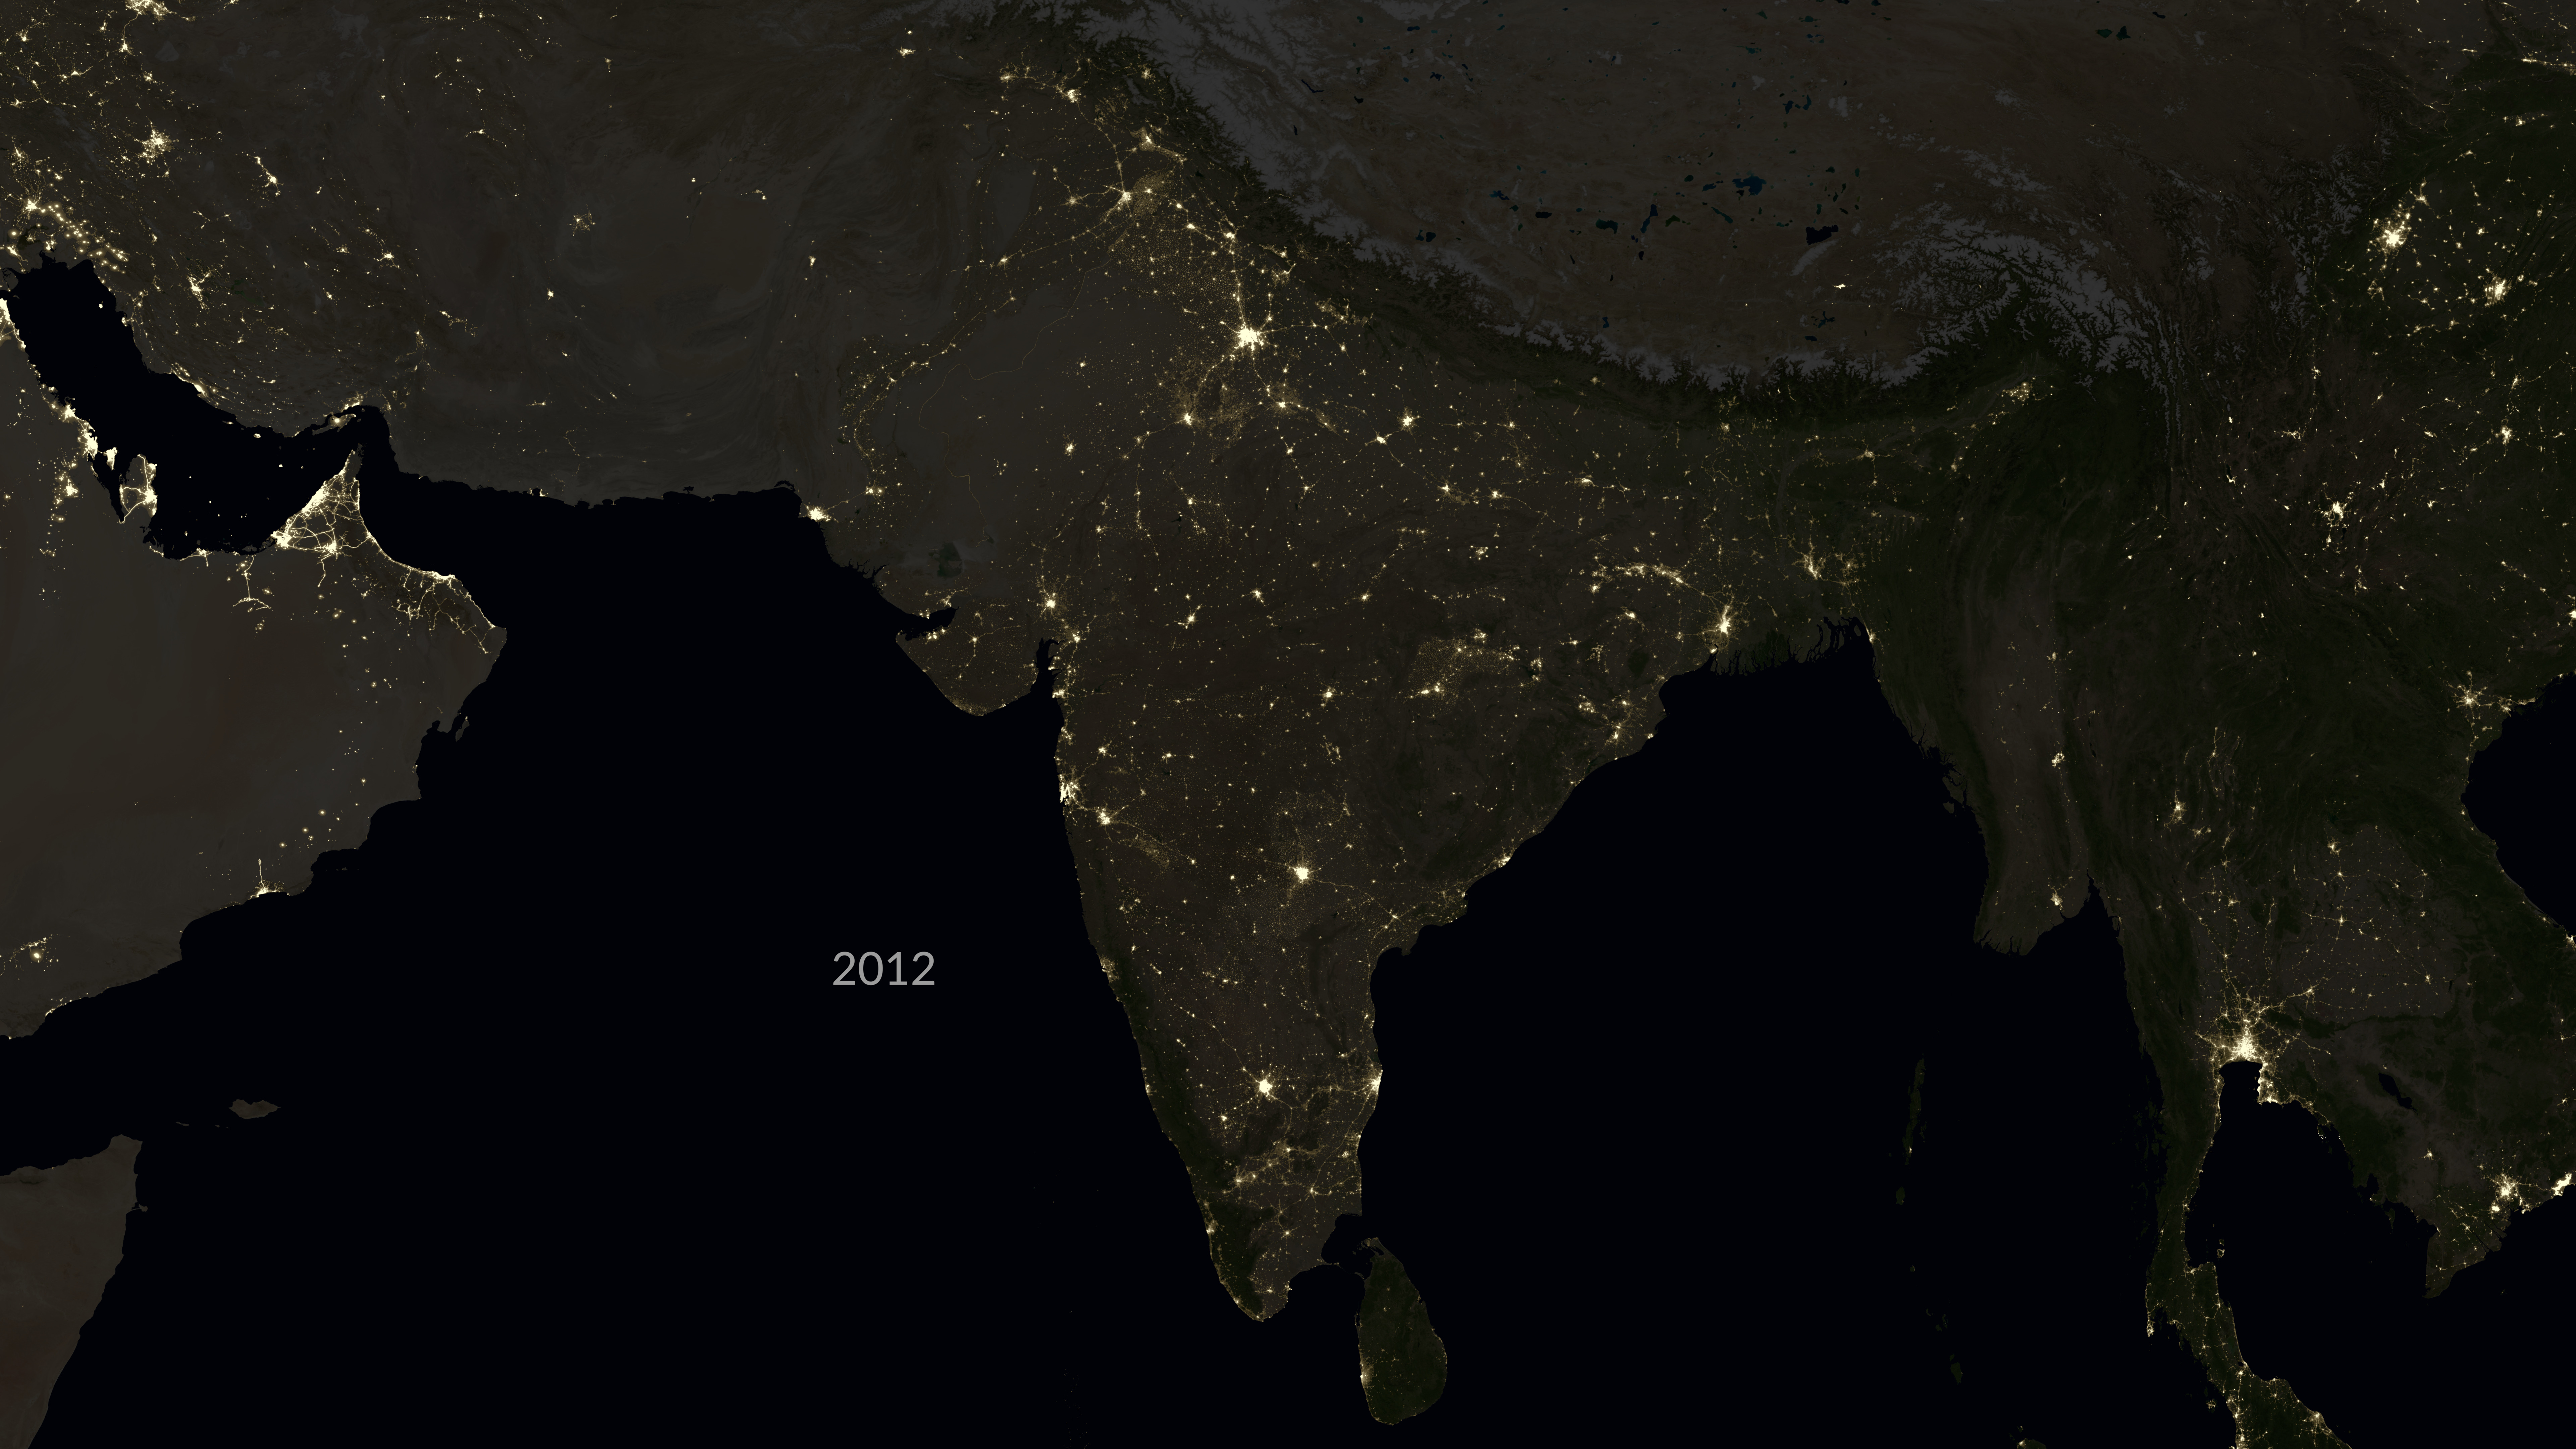
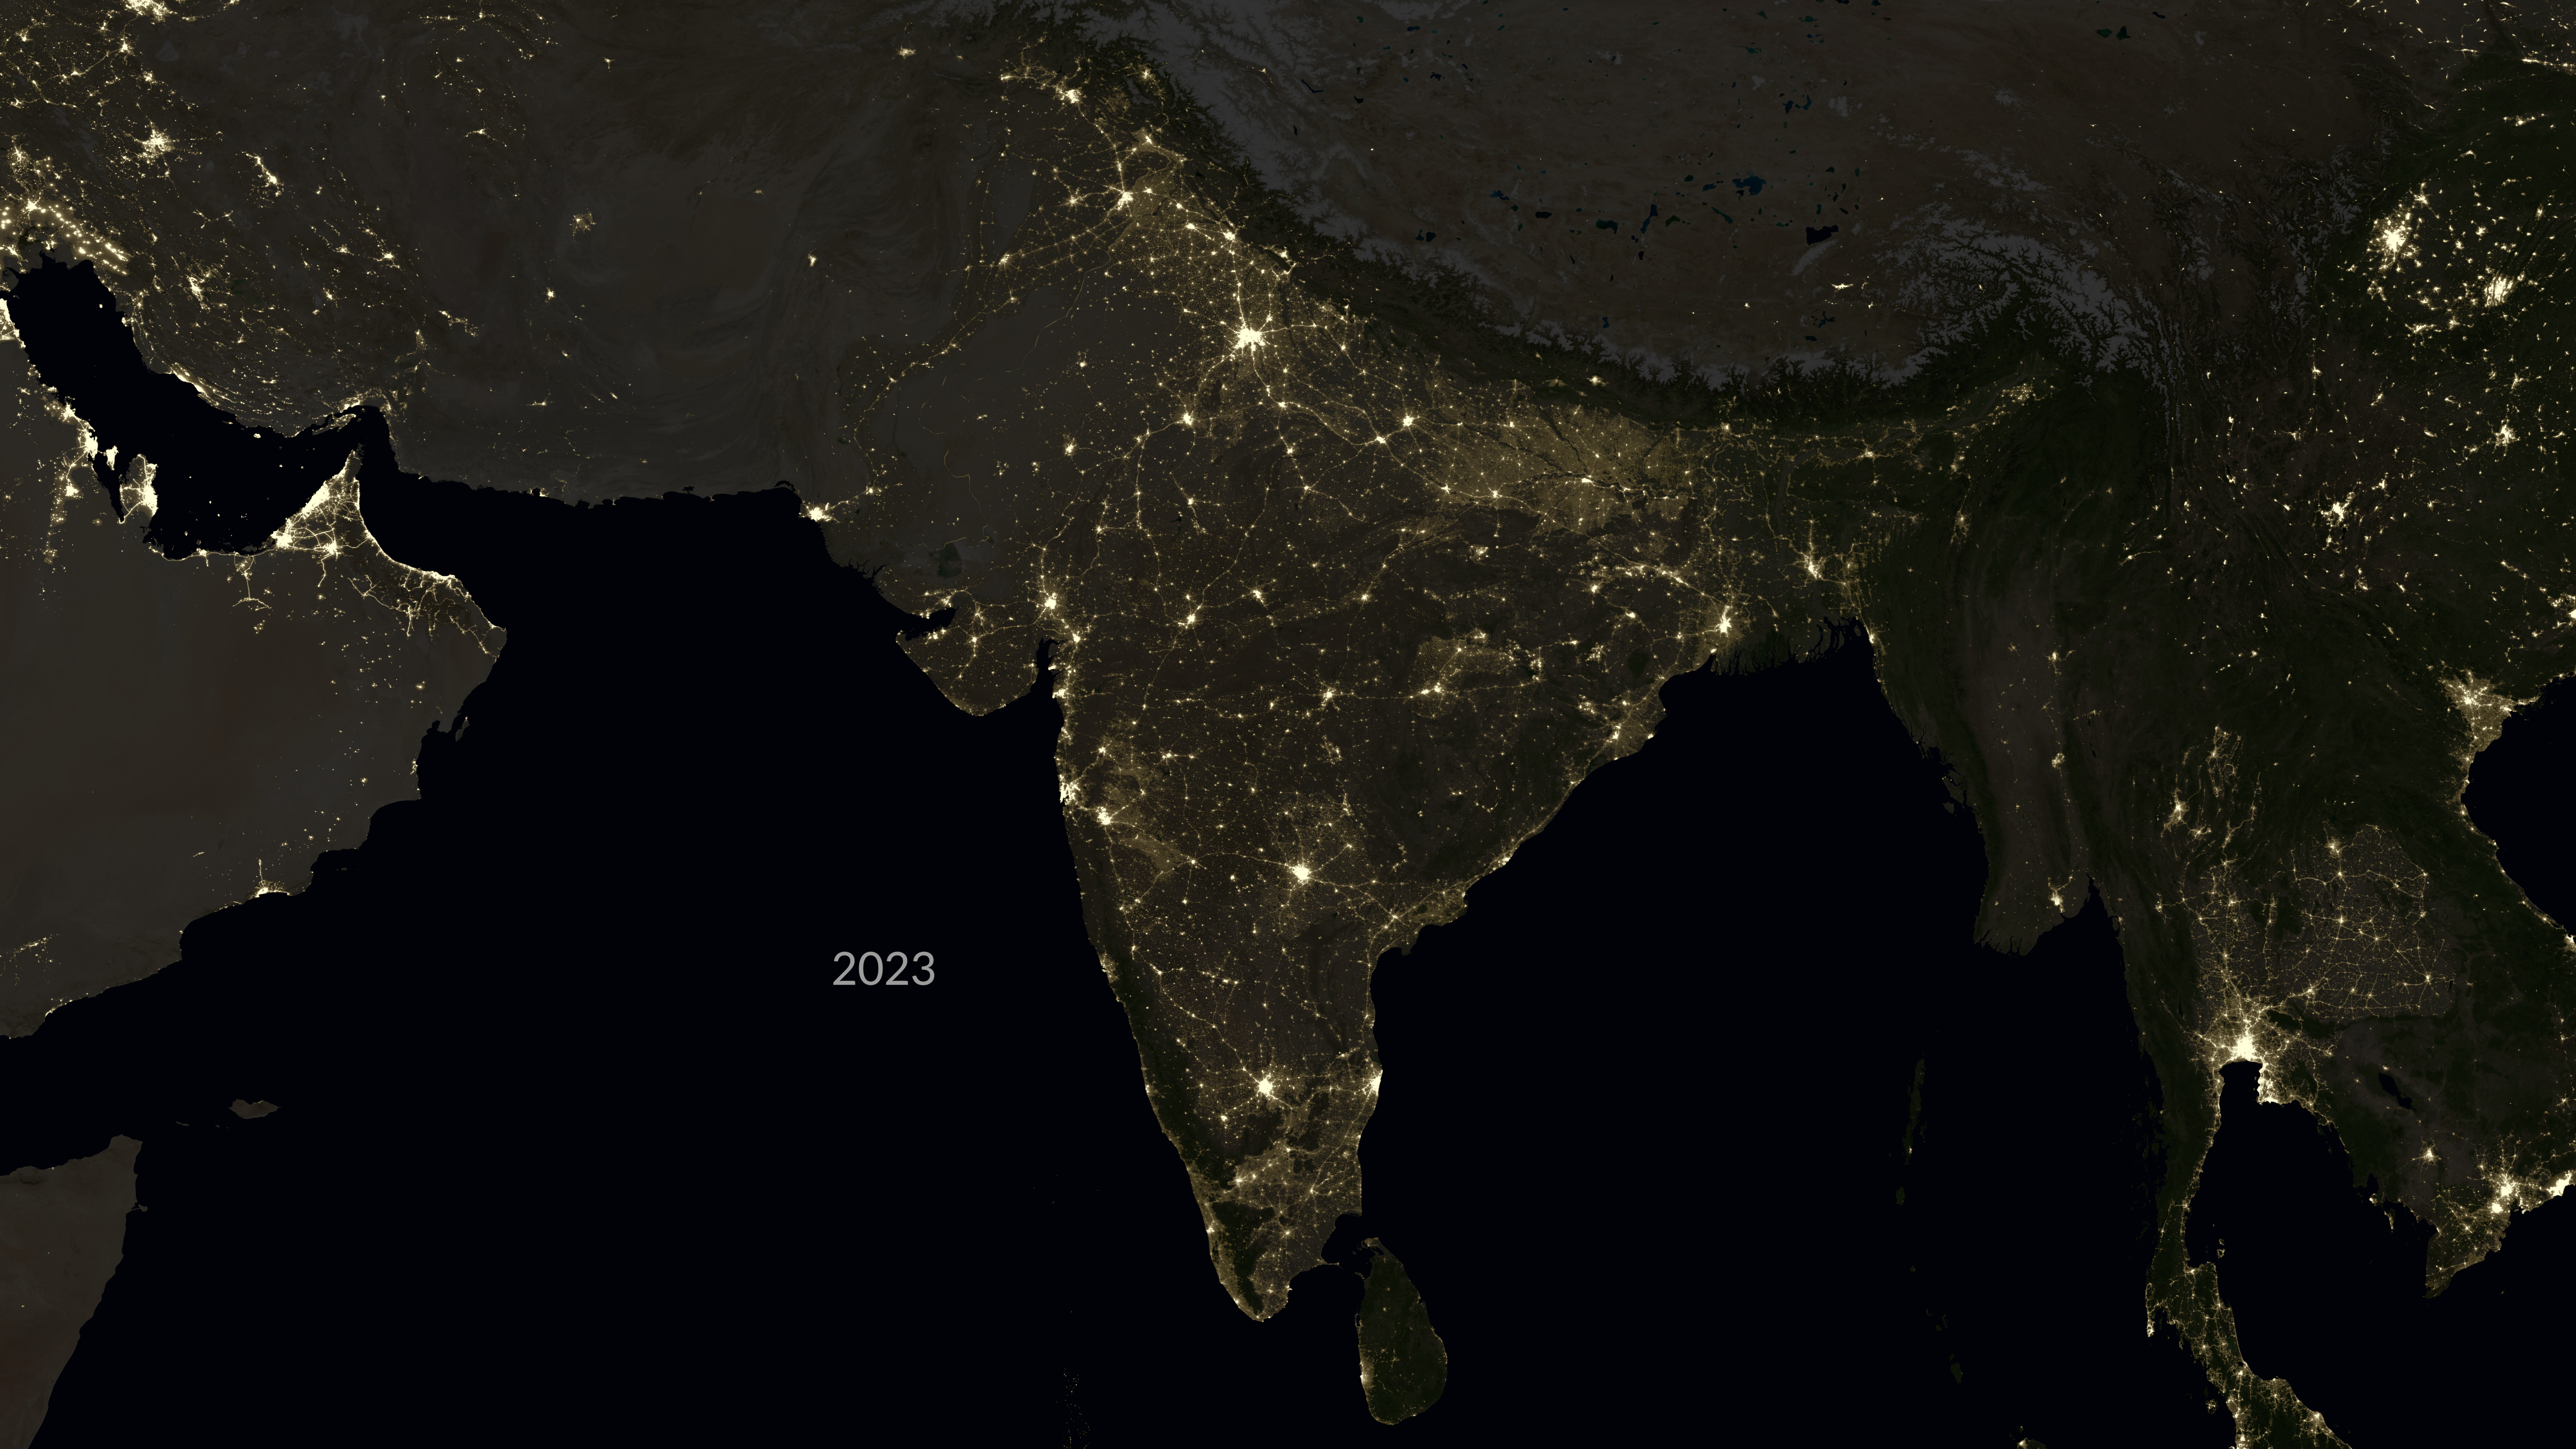
Image comparison showing 2012 and 2023 night lights on a flat map. View is centered on India.
 still image - A view of night light changes between 2012 and 2023. Areas with more light are purple and areas with less light are orange. View is centered on India.")
8k resolution (7680 × 4320) still image - A view of night light changes between 2012 and 2023. Areas with more light are purple and areas with less light are orange. View is centered on India.
Time series view (2012-2023) of night lights on a flat map. View is centered on Ukraine.

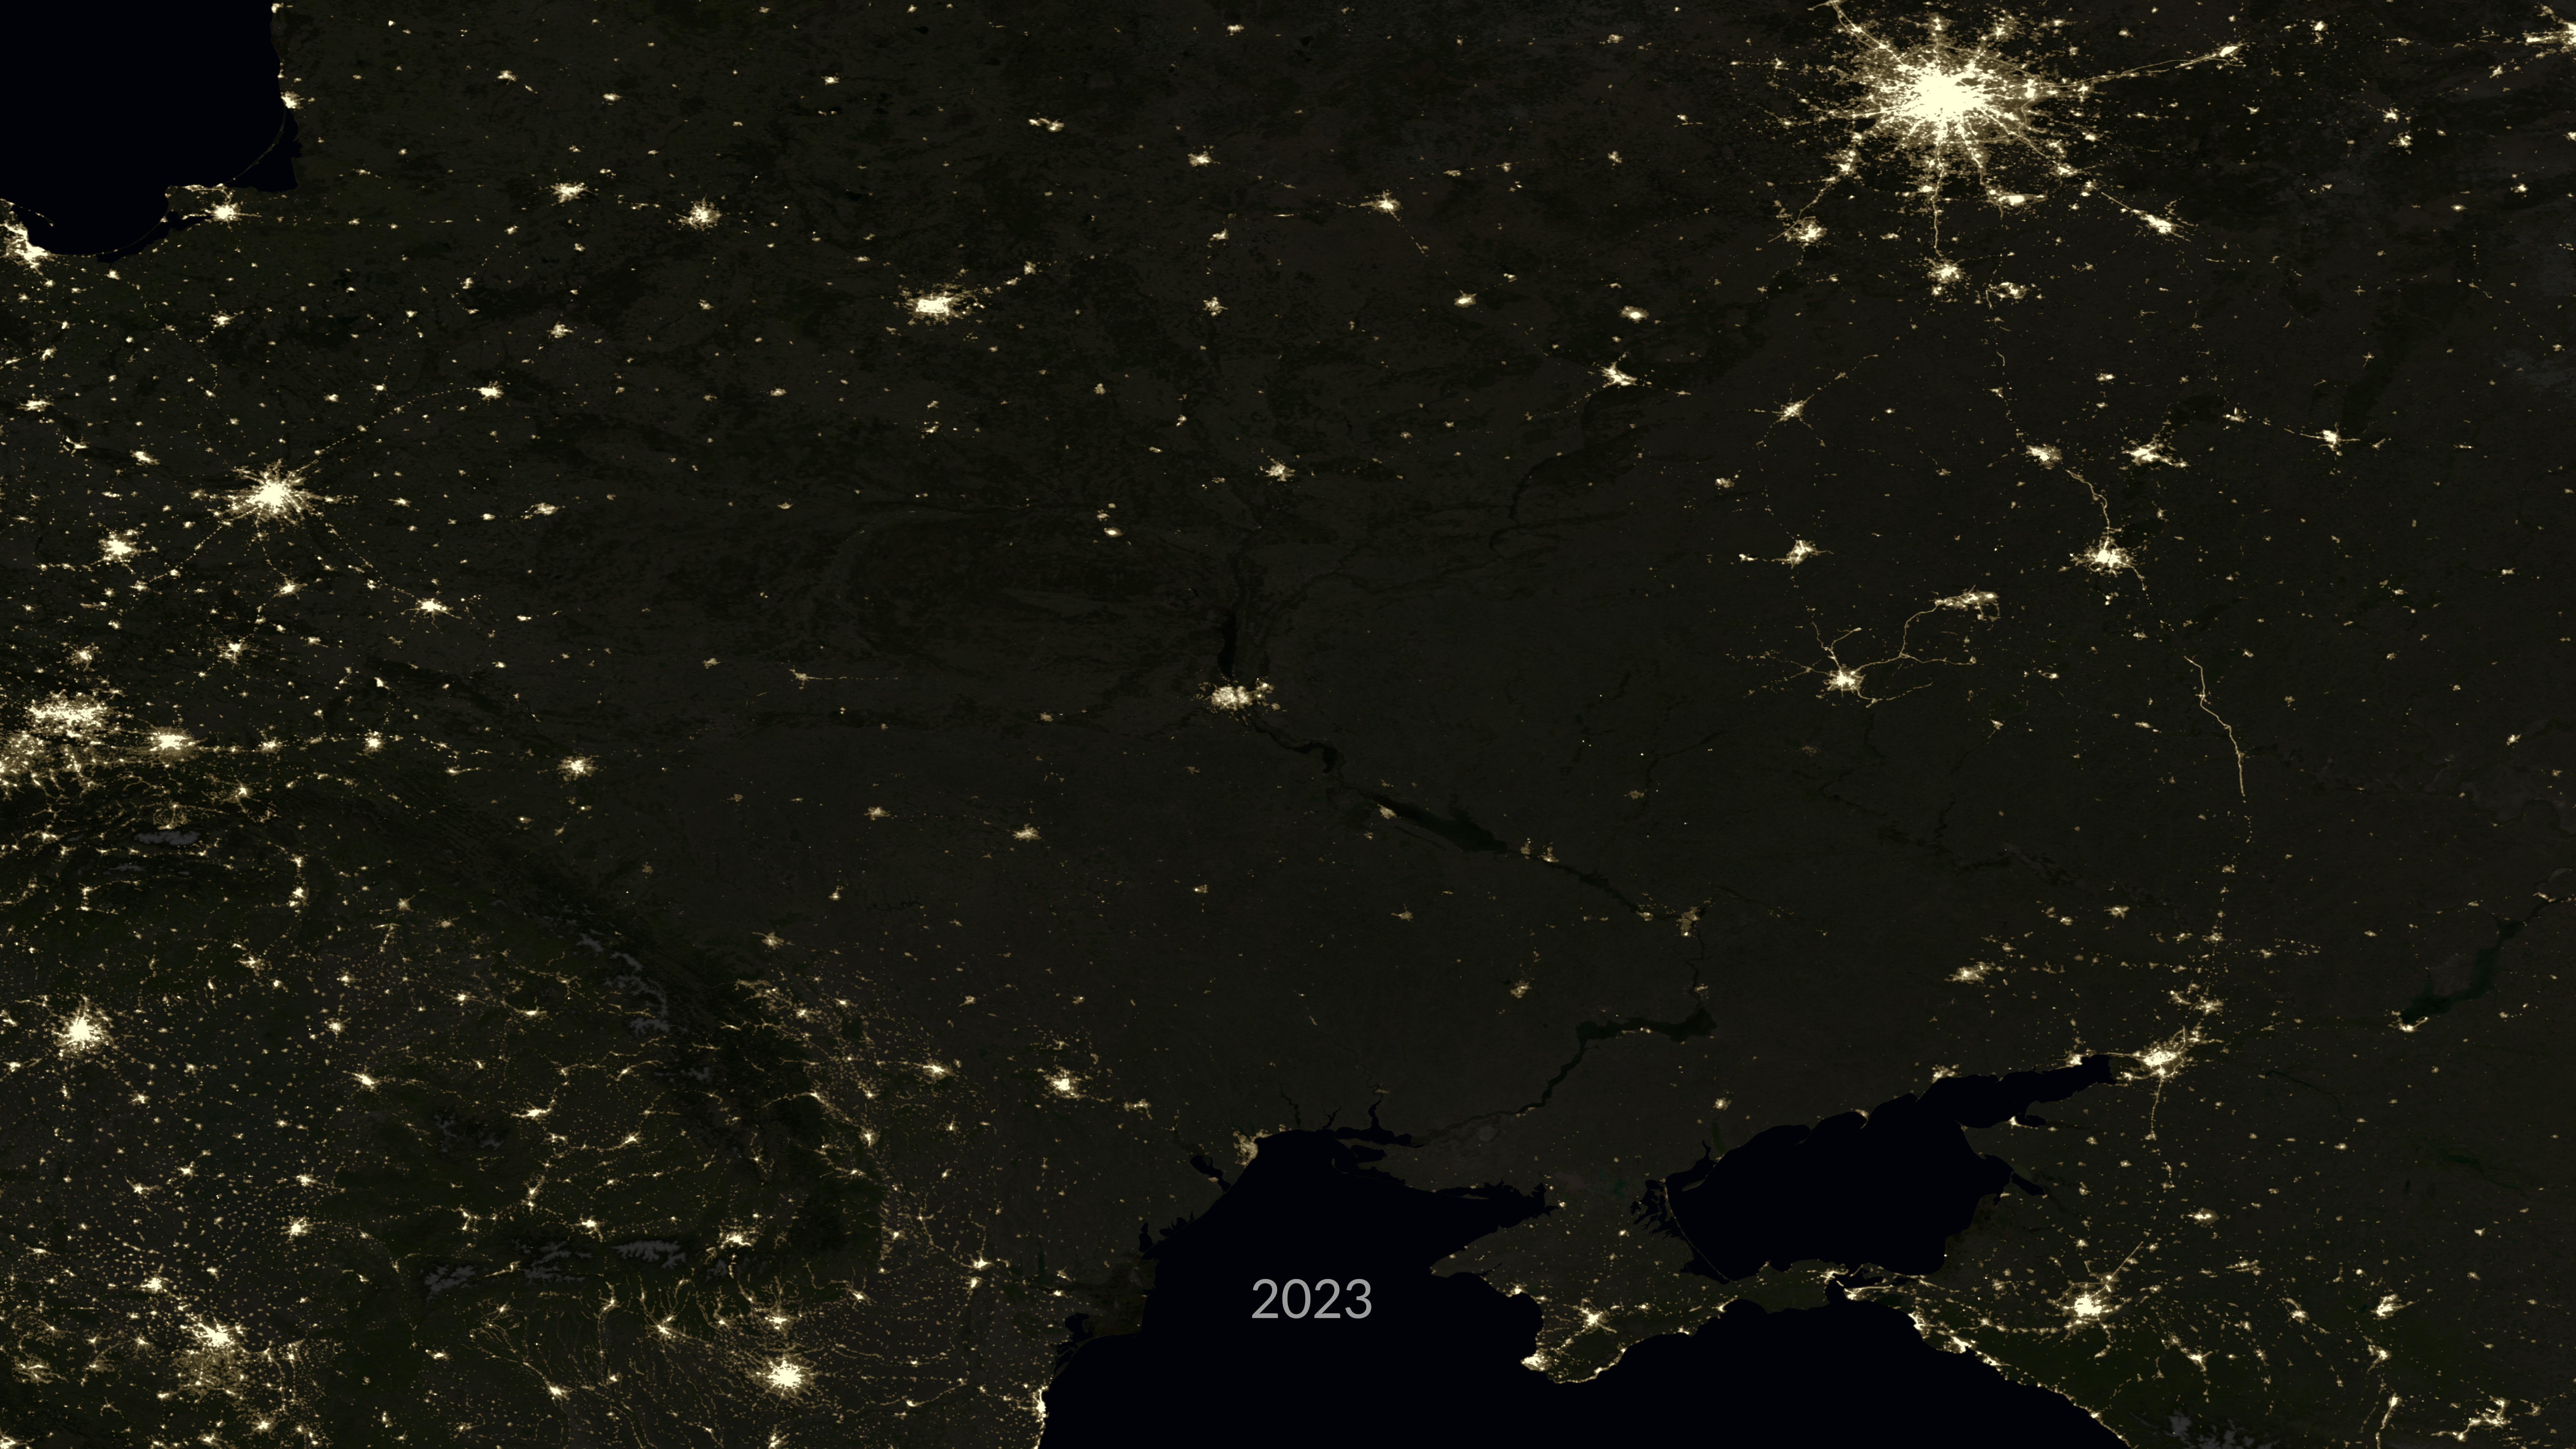
Image comparison showing 2012 and 2023 night lights on a flat map. View is centered on Ukraine.
 still image - A view of night light changes between 2012 and 2023. Areas with more light are purple and areas with less light are orange. View is centered on Ukraine.")
8k resolution (7680 × 4320) still image - A view of night light changes between 2012 and 2023. Areas with more light are purple and areas with less light are orange. View is centered on Ukraine.
Credits
Please give credit for this item to:
NASA's Scientific Visualization Studio
-
Visualizer
-
Kel Elkins
(USRA)

-
Kel Elkins
(USRA)
-
Scientists
- Zhuosen Wang (University of Maryland)
- Miguel Román (Leidos)
- Ranjay Shrestha (SSAI)
- Srija Chakraborty (USRA)
- Virginia Kalb (NASA)
Datasets used
-
Black Marble (Black Marble: Next Generation) [Suomi NPP: VIIRS]
ID: 1176Earth at night imagery
Credit: NASA Earth Observatory images by Joshua Stevens, using Suomi NPP VIIRS data from Miguel Román, NASA GSFC.
This dataset can be found at: https://visibleearth.nasa.gov/images/144898/earth-at-night-black-marble-2016-color-maps/144947l
See all pages that use this dataset
Note: While we identify the data sets used on this page, we do not store any further details, nor the data sets themselves on our site.
Citing this page
Related
- ID: 5634
 Visualization
Alternate Versions
- ID: 5313

Release date
This page was originally published on Monday, May 27, 2024.
This page was last updated on Monday, June 23, 2025 at 1:11 PM EDT.