Atmospheric Carbon Dioxide Tagged by Source for Science-on-a-Sphere
Carbon dioxide (CO2) is the most prevalent greenhouse gas driving global climate change. However, its increase in the atmosphere would be even more rapid without land and ocean carbon sinks, which collectively absorb about half of human emissions every year. Advanced computer modeling techniques in NASA's Global Modeling and Assimilation Office allow us to disentangle the influences of sources and sinks and to better understand where carbon is coming from and going to.
This is equirectangular imagery intended for projection on NOAA Science-on-a-Sphere globe.
Tagged Carbon Dioxide Science On a Sphere Content
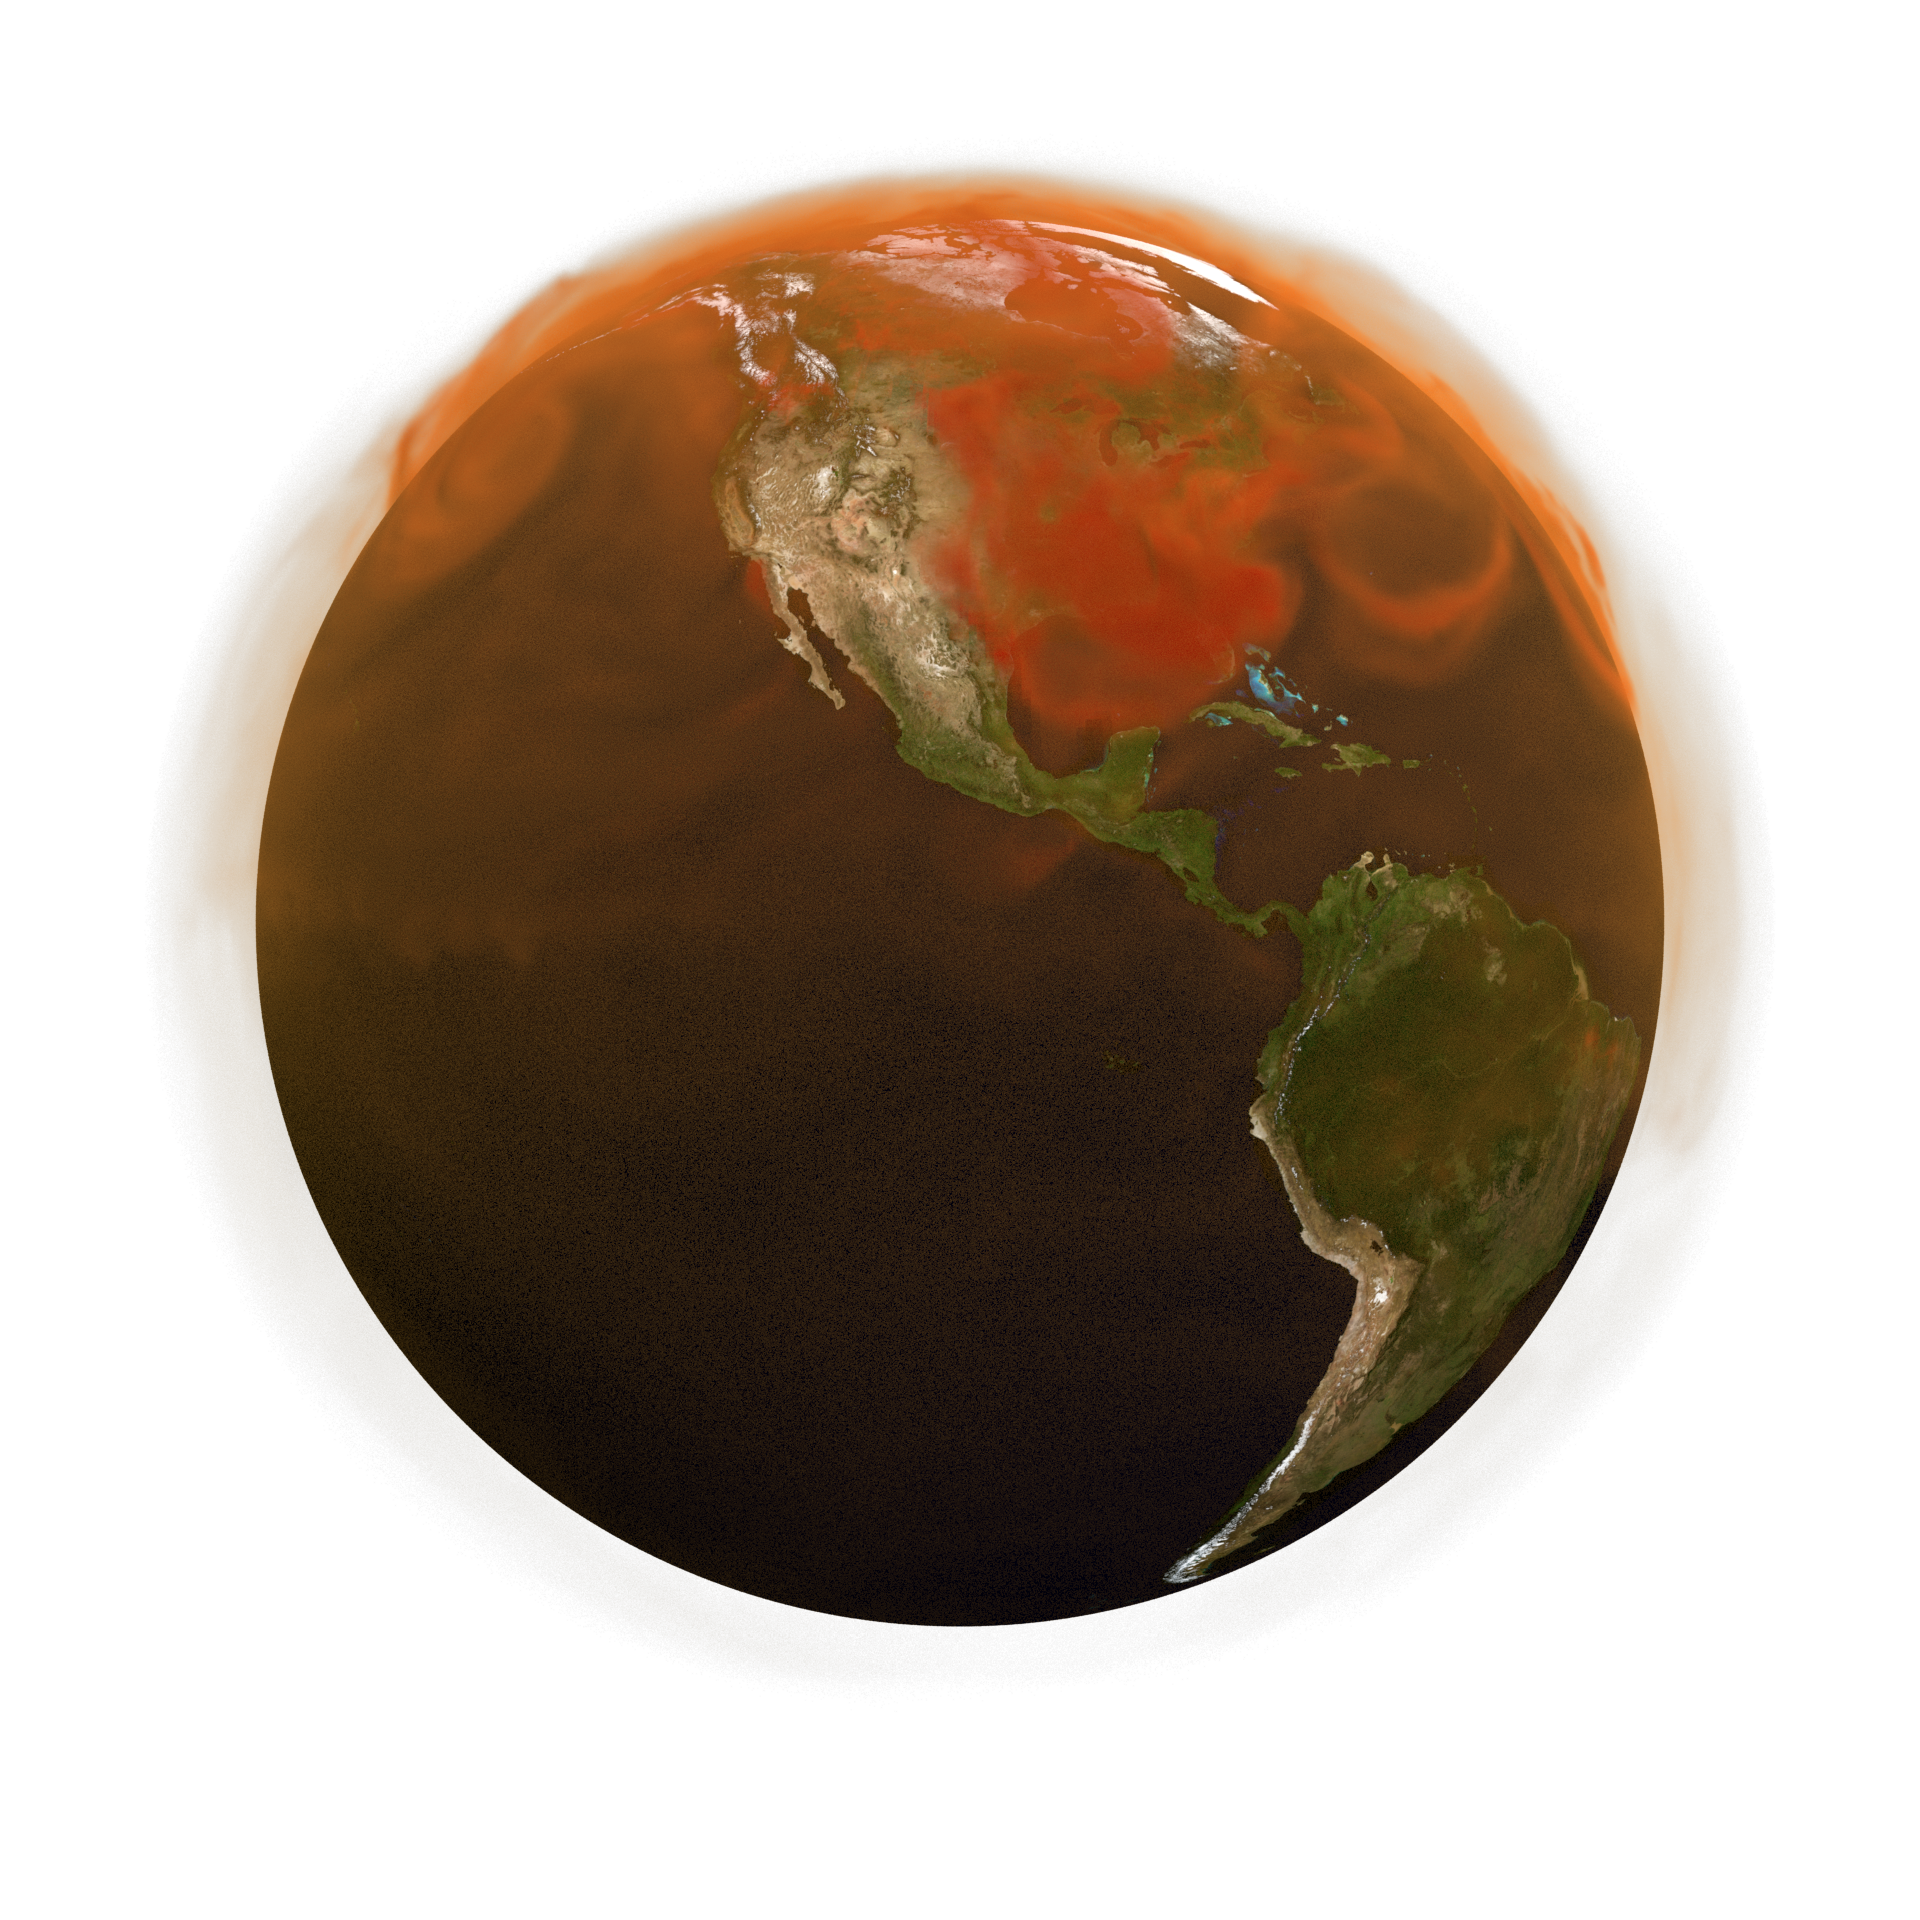
This data visualization shows the accumulation of carbon dioxide (CO2) in Earth's atmosphere over the course of one year (2021). Fossil fuel burning (orange) and the burning of forests and farmlands (red) make up the majority of emissions. Plants (green) and the ocean (blue) sometimes emit carbon dioxide and sometimes absorb it (shown as dots). The land and ocean collectively absorb (sink) about half of human-caused emissions every year. Advanced computer modeling techniques at NASA's Global Modeling and Assimilation Office allow us to view the distribution of CO2 sources and sinks to better understand how carbon moves through Earth’s systems.
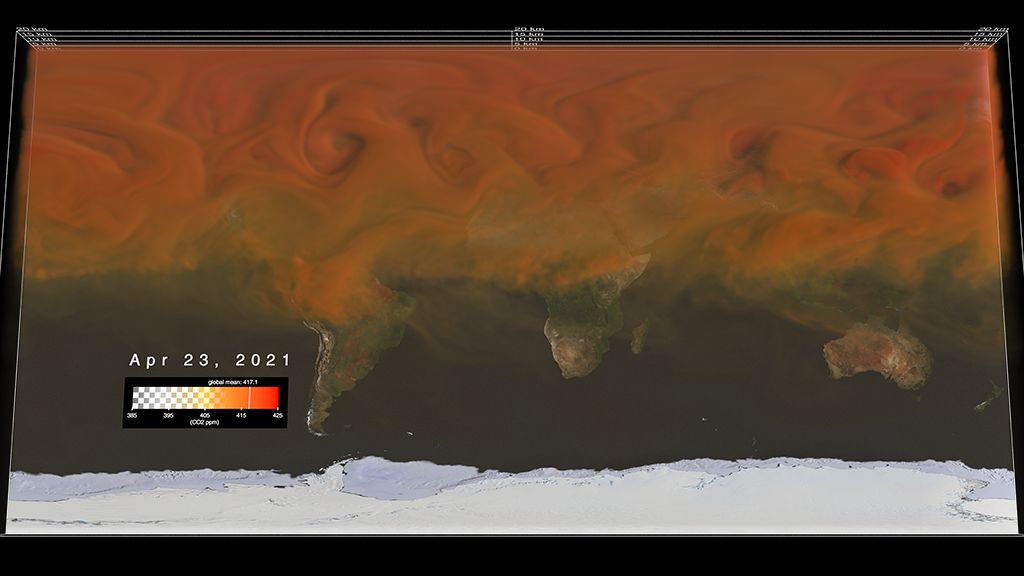
This visualization shows the CO2 being added to Earth's atmosphere over the course of the year 2021, split into four major contributors: fossil fuels in orange, burning biomass in red, land ecosystems in green, and the ocean in blue. The dots on the surface also show how atmospheric carbon dioxide is also being absorbed by land ecosystems in green and the ocean in blue. Though the land and oceans are each carbon sinks in a global sense, individual locations can be sources at different times.
Individual Tagged Sources
This visualization only shows the fossil fuel component of CO2 being added to Earth's atmosphere over the course of the year 2021.
This visualization only shows the burning biomass component of CO2 being added to Earth's atmosphere over the course of the year 2021.
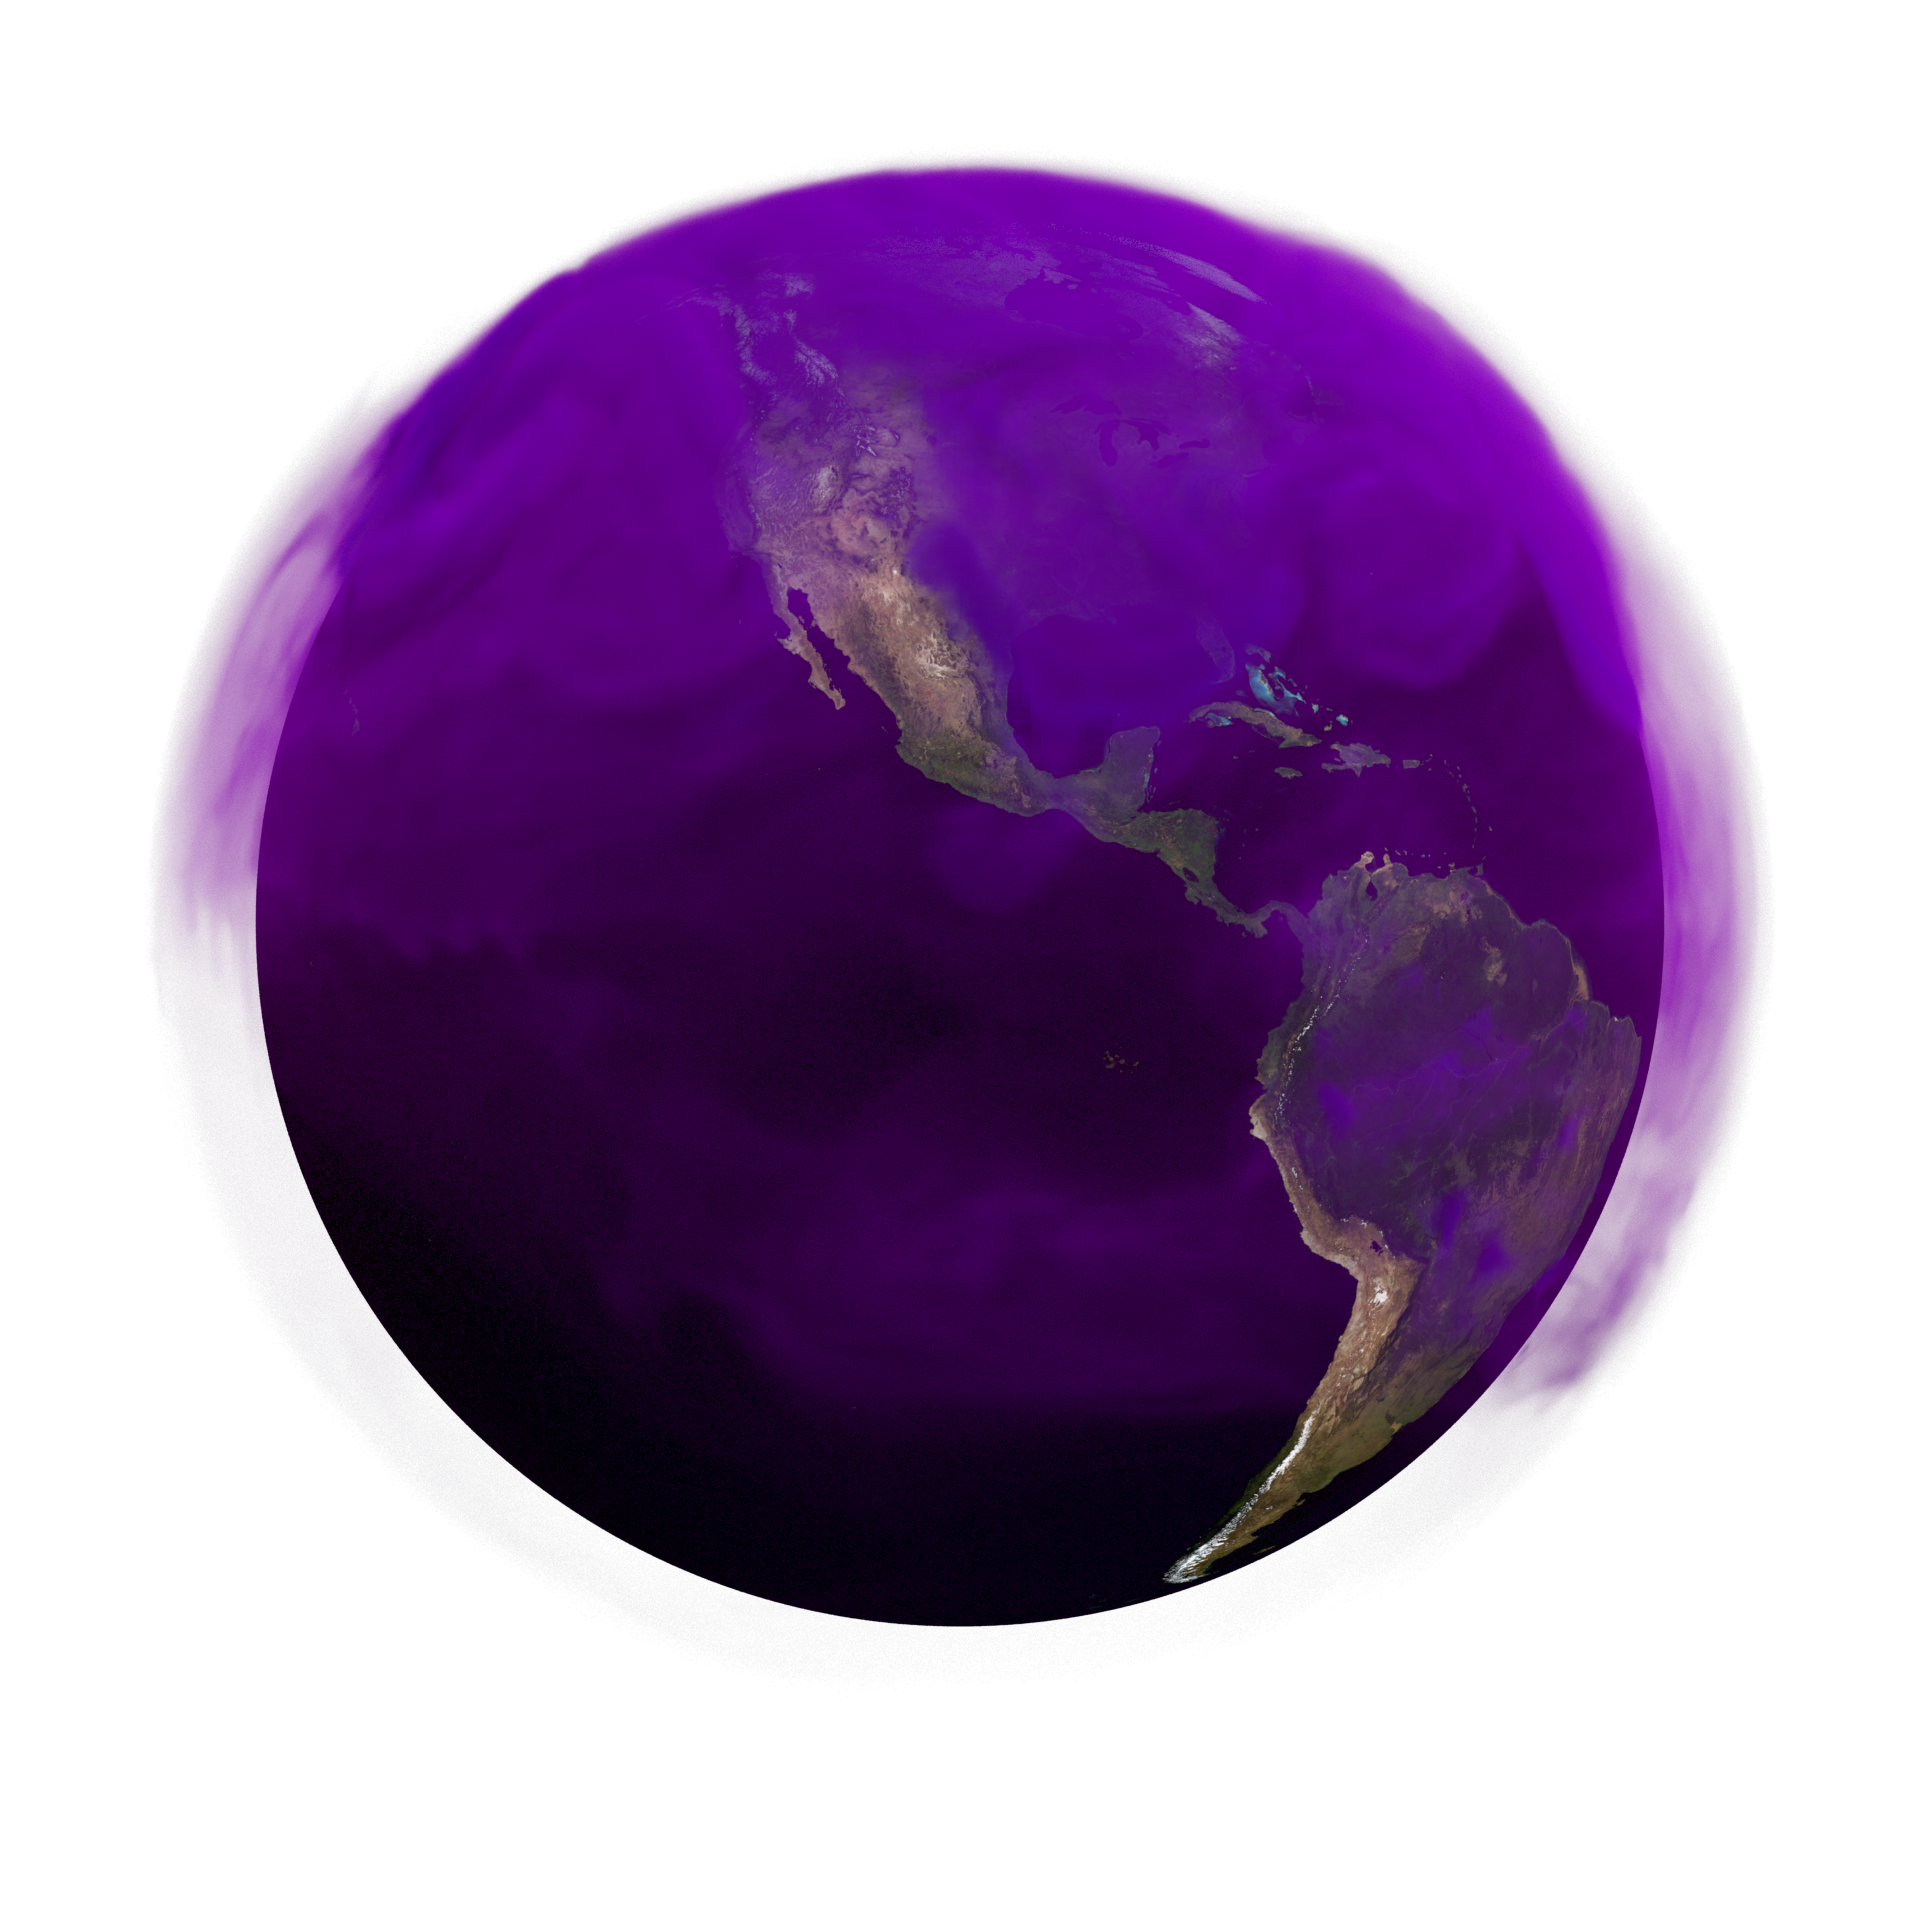
This visualization only shows the land ecosystems component of CO2 being added to Earth's atmosphere over the course of the year 2021.
This visualization shows the land component of CO2 being added to Earth's atmosphere over the course of the year 2021, in addition to showing the land surface absorption from the same time period.
This visualization only shows the ocean component of CO2 being added to Earth's atmosphere over the course of the year 2021.
This visualization shows the ocean component of CO2 being added to Earth's atmosphere over the course of the year 2021, in addition to showing the ocean surface absorption from the same time period.
This visualization only shows the land and ocean surface absorption of CO2 from Earth's atmosphere over the course of the year 2021.

This image provides the global land borders used in the animations above. Some video producers may prefer to overlay this on top of the other animations to highlight geographic points of interest.
Sample color bar for the Science-on-a-Sphere legend system.
Credits
Please give credit for this item to:
NASA's Scientific Visualization Studio
-
Visualizers
-
AJ Christensen
(SSAI)

-
Mark SubbaRao
(NASA/GSFC)
-
Helen-Nicole Kostis
(USRA)
- Brenda Lopez-Silva (SSAI)
-
Anansa B. Keaton-Ashanti
(NASA/GSFC)
-
Greg Shirah
(NASA/GSFC)
-
AJ Christensen
(SSAI)
-
Technical support
- Laurence Schuler (ADNET Systems, Inc.)
- Ian Jones (ADNET Systems, Inc.)
-
Scientist
-
Lesley Ott
(NASA/GSFC)
-
Lesley Ott
(NASA/GSFC)
Related papers
Weir, B., Ott, L. E., Collatz, G. J., Kawa, S. R., Poulter, B., Chatterjee, A., Oda, T., and Pawson, S.: Bias-correcting carbon fluxes derived from land-surface satellite data for retrospective and near-real-time assimilation systems, Atmos. Chem. Phys., 21, 9609–9628, https://doi.org/10.5194/acp-21-9609-2021, 2021.
Datasets used
-
GEOS Carbon Dioxide
ID: 962
Note: While we identify the data sets used on this page, we do not store any further details, nor the data sets themselves on our site.
Related
- ID: 5194
- ID: 5118
 Visualization
 - ID: 5119
- ID: 5117
 Visualization
 - ID: 5116
 Visualization
 - ID: 5115
 Visualization
 - ID: 4949
 Visualization
Used as a Source In
- ID: 14568
Release date
This page was originally published on Monday, April 22, 2024.
This page was last updated on Wednesday, July 9, 2025 at 5:25 PM EDT.