A newer version of this visualization is available.
TEMPO - Nitrogen Dioxide Air Pollution Over North America
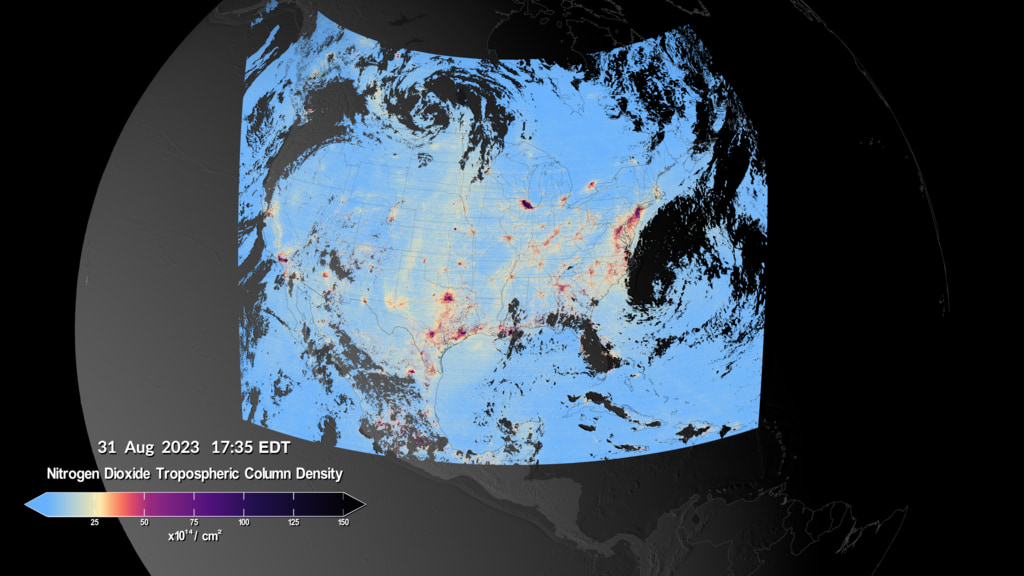
In this visualization, high levels of nitrogen dioxide can be seen over multiple urban areas across the U.S., Canada, Mexico and the Caribbean. Detailed views of three regions show high levels of nitrogen dioxide over cities in the morning, and enhanced levels of nitrogen dioxide over major highways. As the day progresses, the morning pollution often dissipates. Later in the afternoon, it will rise again as the cities enter their second rush hour of the day. Because TEMPO uses visible sunlight to make measurements, it cannot see pollution below clouds. Cloudy areas appear as missing data in the visualization.
The Tropospheric Emissions: Monitoring of Pollution (TEMPO) instrument collected its “first light” measurements of nitrogen dioxide air pollution over North America on August 2, 2023. Beginning at 11:15 AM Eastern Daylight Time (8:15 AM Pacific Time), the instrument scanned the continent every hour for six consecutive hours.
TEMPO measures sunlight reflected and scattered off the Earth’s surface, clouds and the atmosphere. Gases in the atmosphere absorb the sunlight, and the resulting spectra are then used to determine the amounts of several gases in the Earth’s atmosphere, including nitrogen dioxide. The amount of nitrogen dioxide is provided as a “column density”, defined as the total number of nitrogen dioxide molecules in a column of air above a square centimeter on the Earth’s surface. The tropospheric column density is the amount of nitrogen dioxide in the lower part of the atmosphere, from the surface to about 10 km in altitude. In polluted regions, most of that nitrogen dioxide is located near the ground.
In North America, nitrogen dioxide is primarily produced from burning fossil fuels for transportation, power generation and industrial activity, as well as from wildfires. Nitrogen dioxide plays an important role in the formation of ground-level ozone and particulate matter pollution, and is itself a toxic gas. These pollutants are harmful to both human and ecosystem health.
TEMPO makes measurements of the atmosphere with unprecedented resolution in both time and space. Previous satellite instruments have measured air pollution from low-Earth orbit, passing over a given location on the ground once per day. Because TEMPO is in a geostationary orbit, the instrument can continuously observe North American pollution during daylight hours. This allows TEMPO to capture changes in emissions, chemistry and transport over the day, enabling better knowledge of pollution sources and population exposure to poor air quality.
TEMPO is a collaboration between the Smithsonian Astrophysical Observatory at the Center for Astrophysics | Harvard & Smithsonian, and the NASA Langley Research Center. More information about the TEMPO mission can be found at: https://tempo.si.edu.
A clip from the full visualization at the top of this page. This visualization shows nitrogen dioxide over North America.
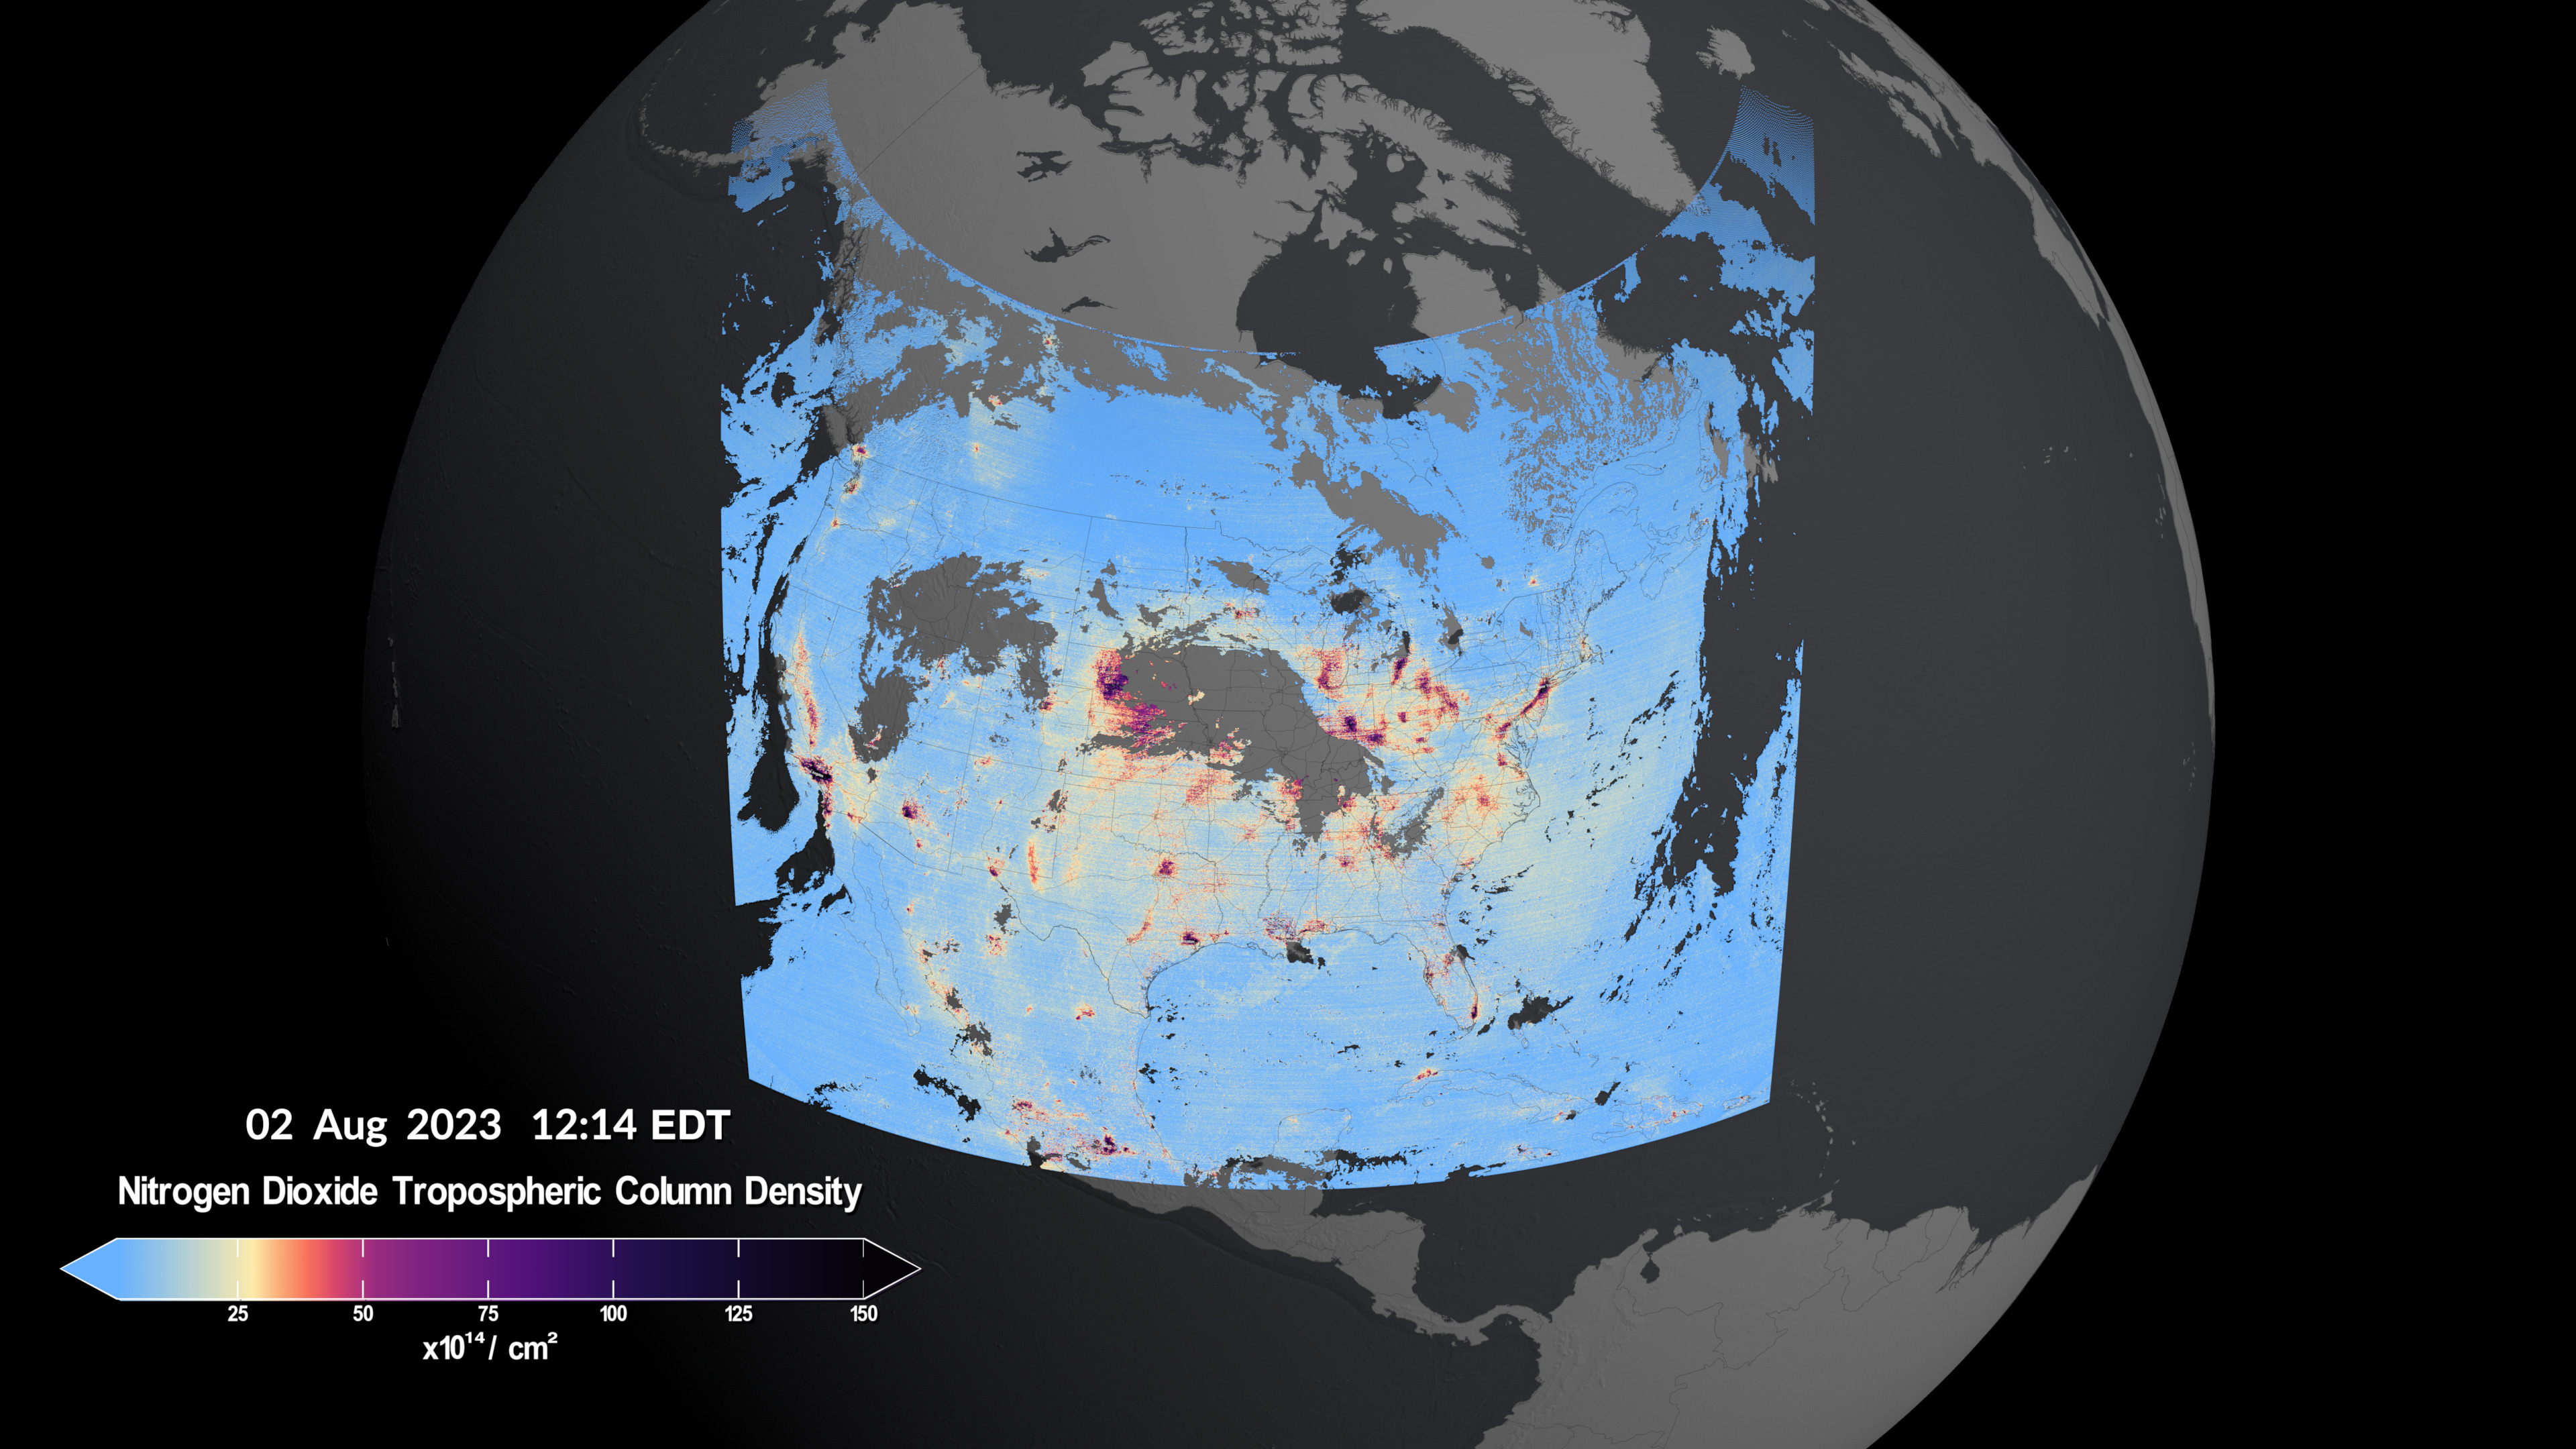
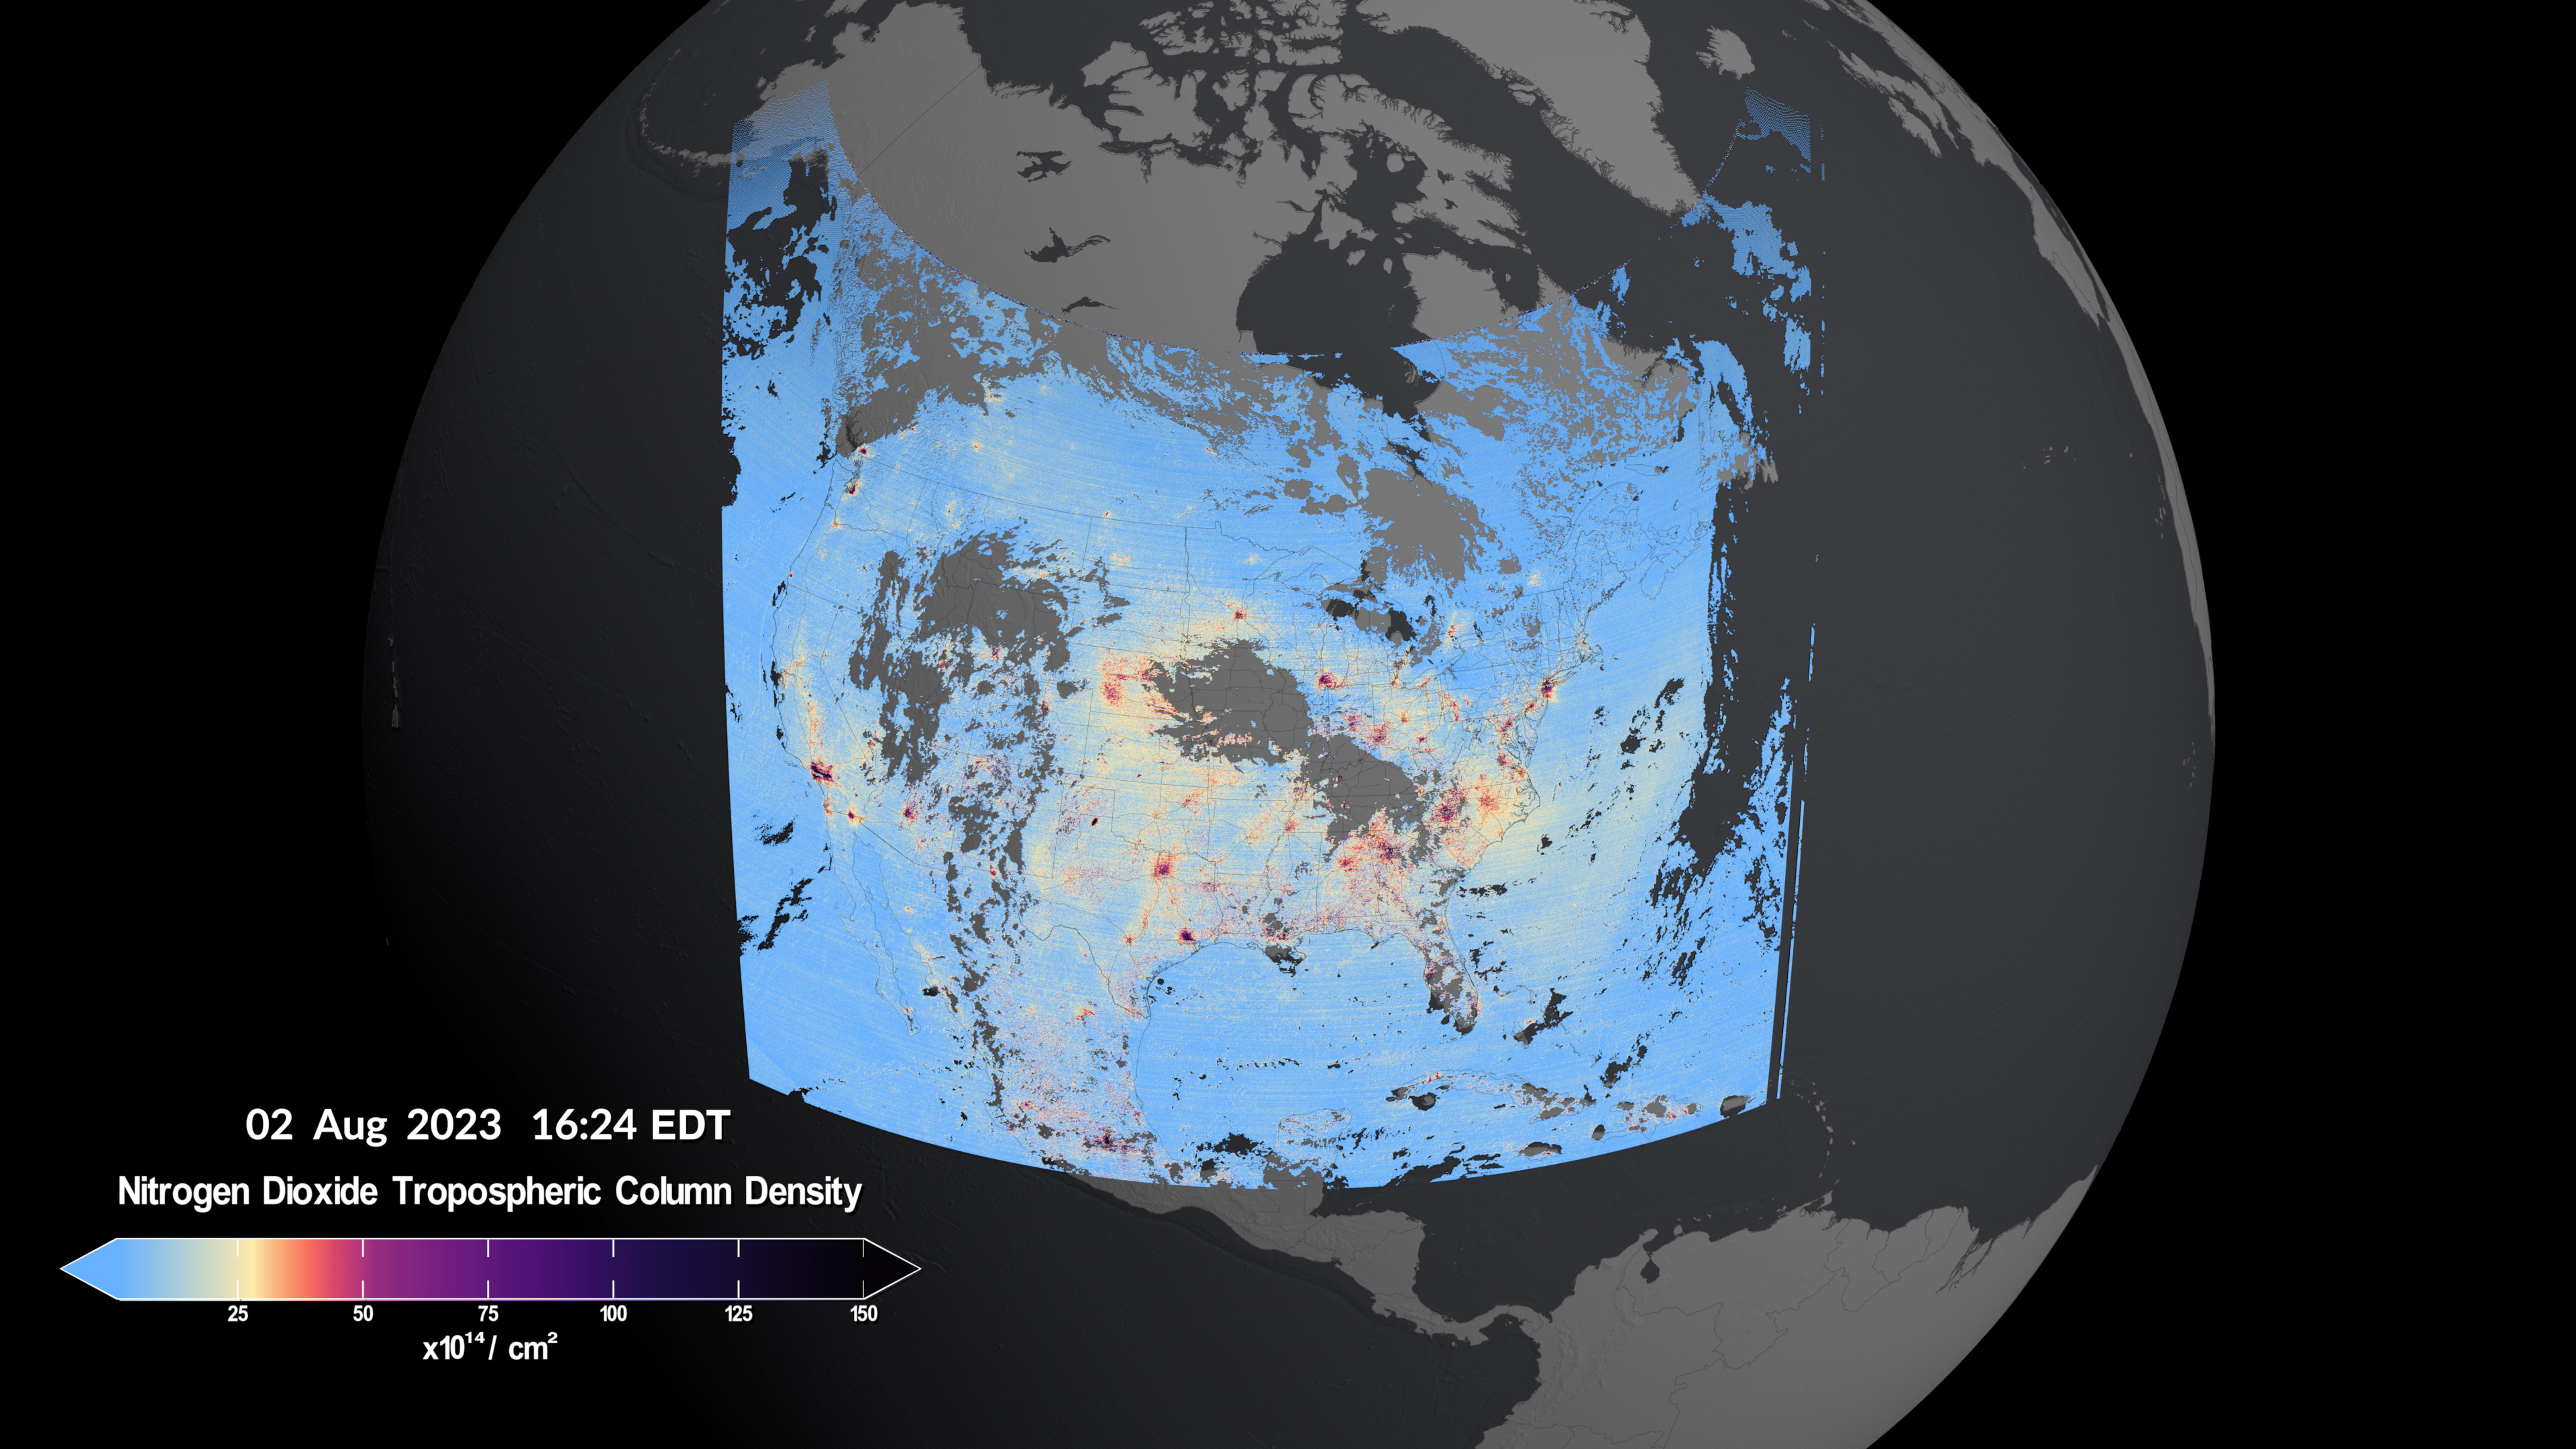
Image comparison showing nitrogen dioxide over North America. First image is 12:14pm EDT, second image is 4:24pm EDT.
A clip from the full visualization at the top of this page. This visualization shows nitrogen dioxide over the D.C./Philadelphia/New York City region.
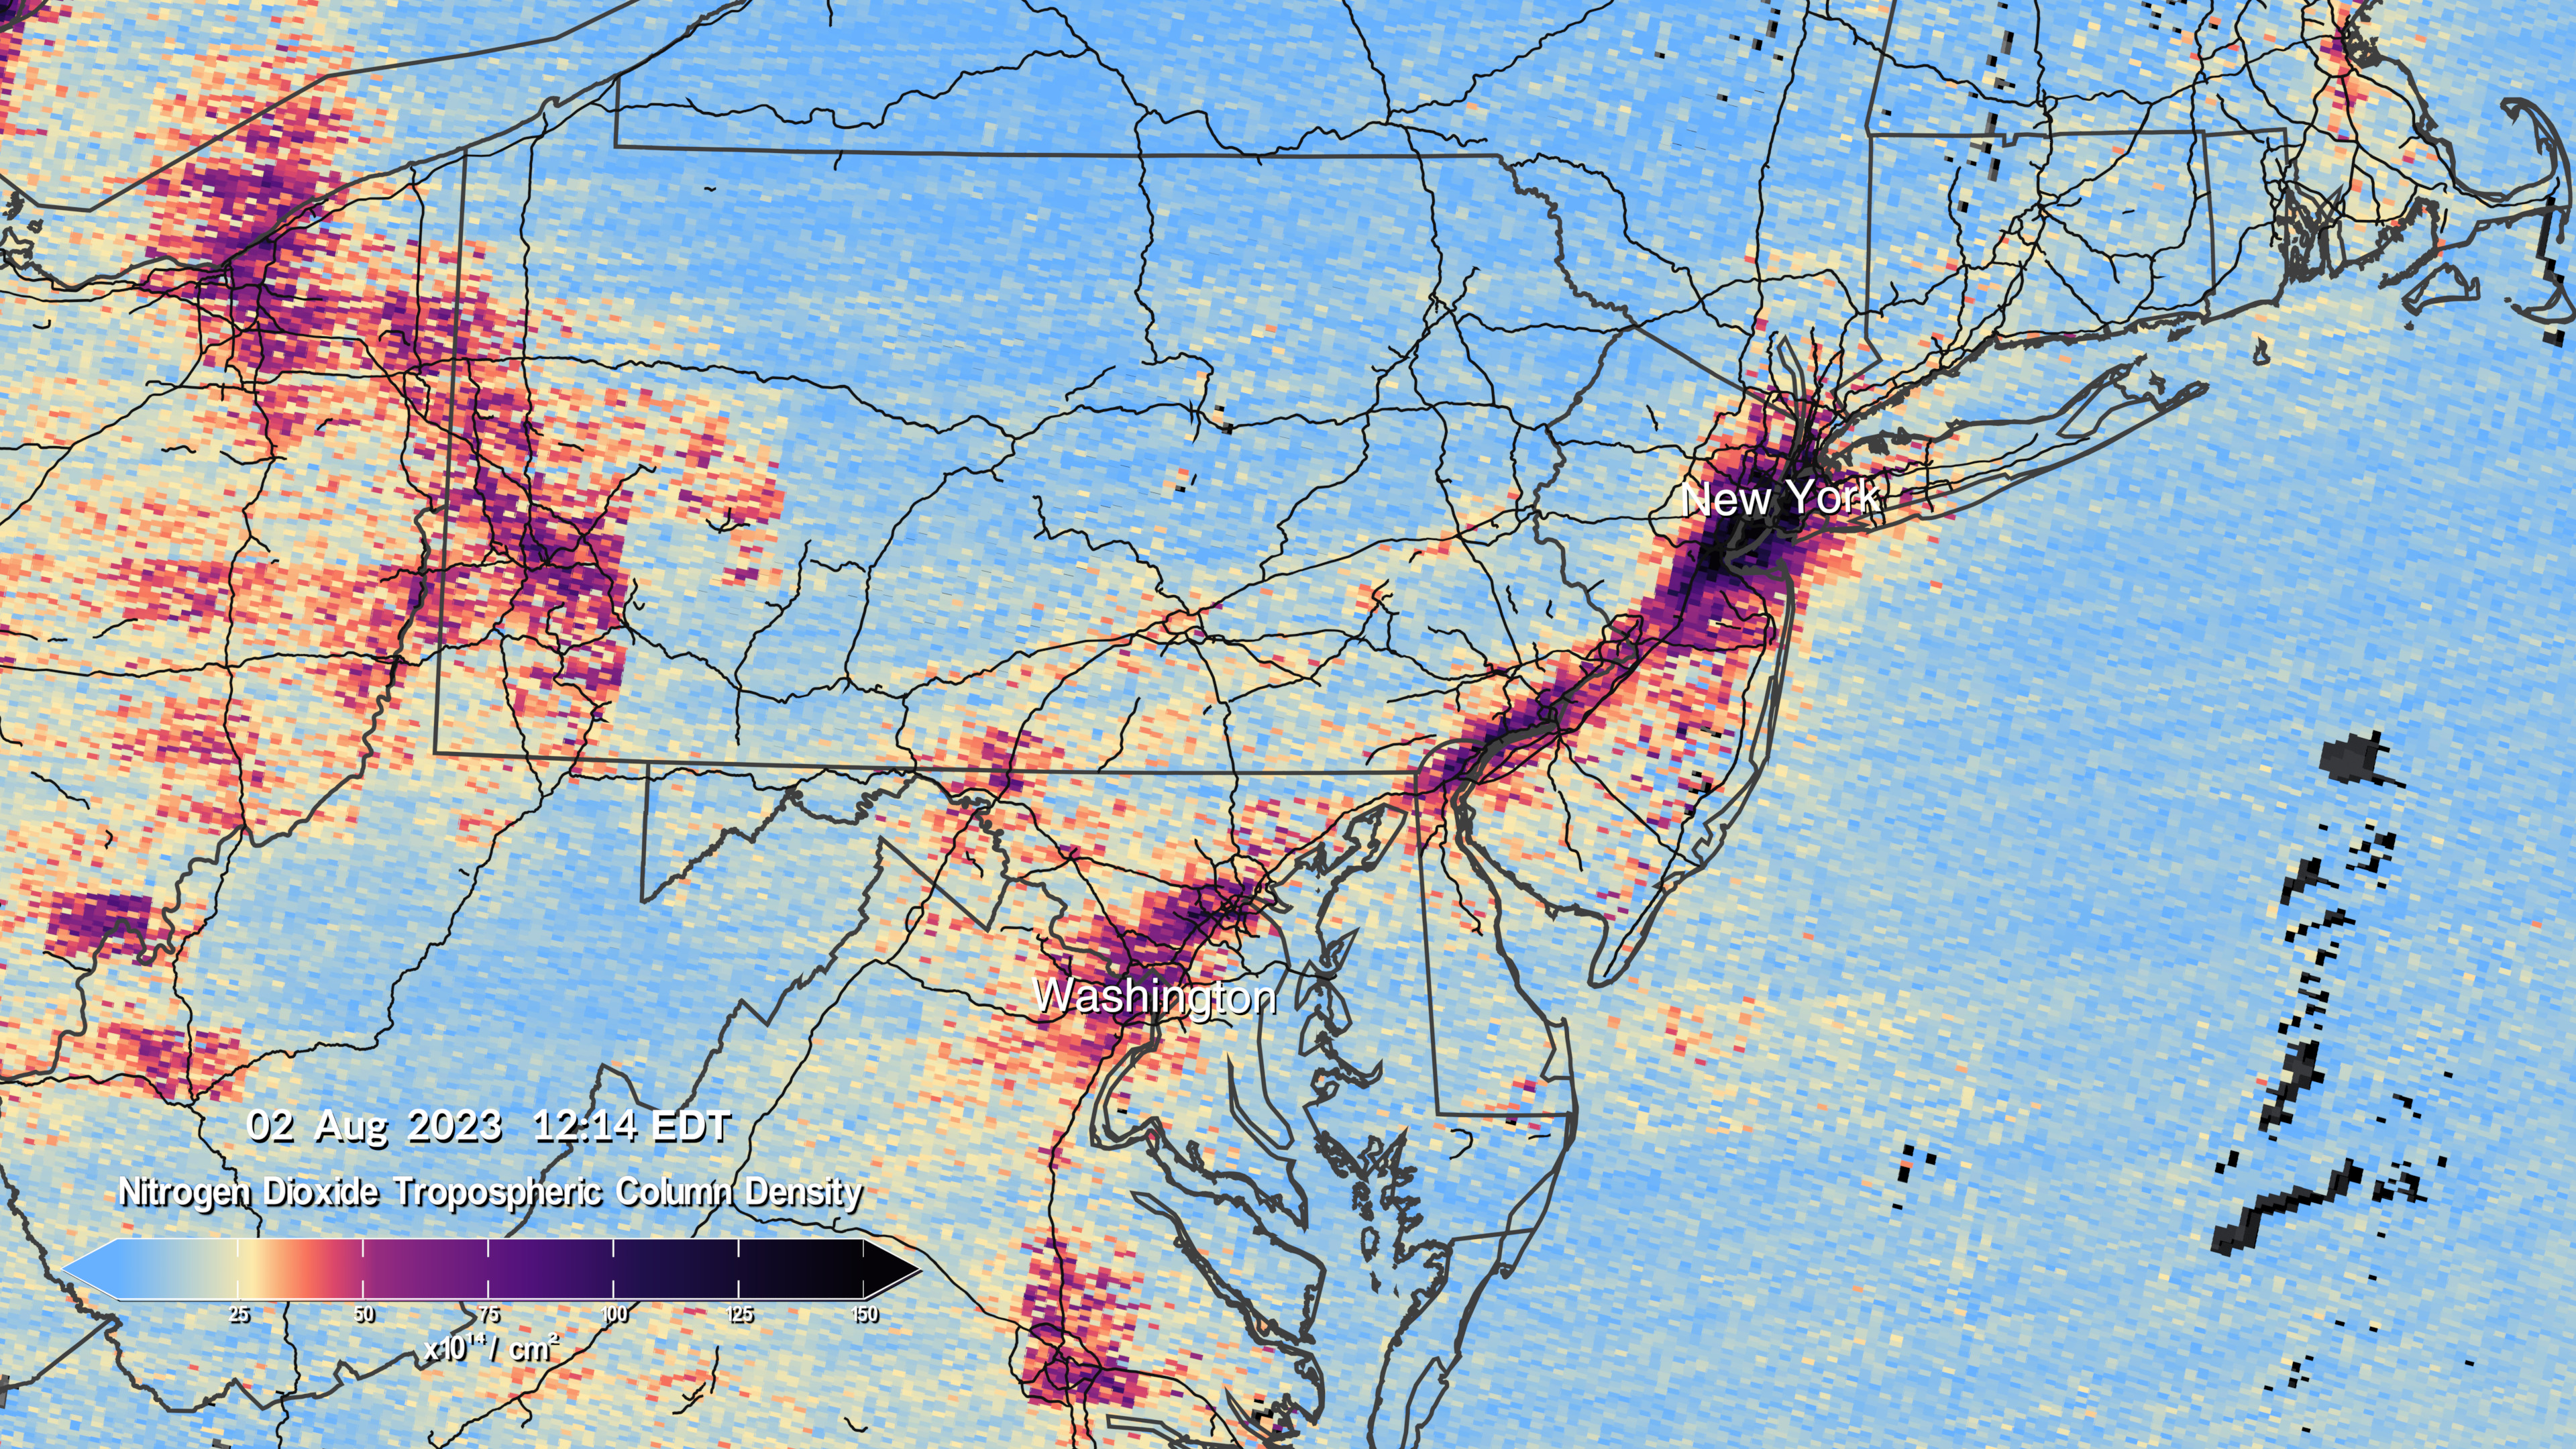
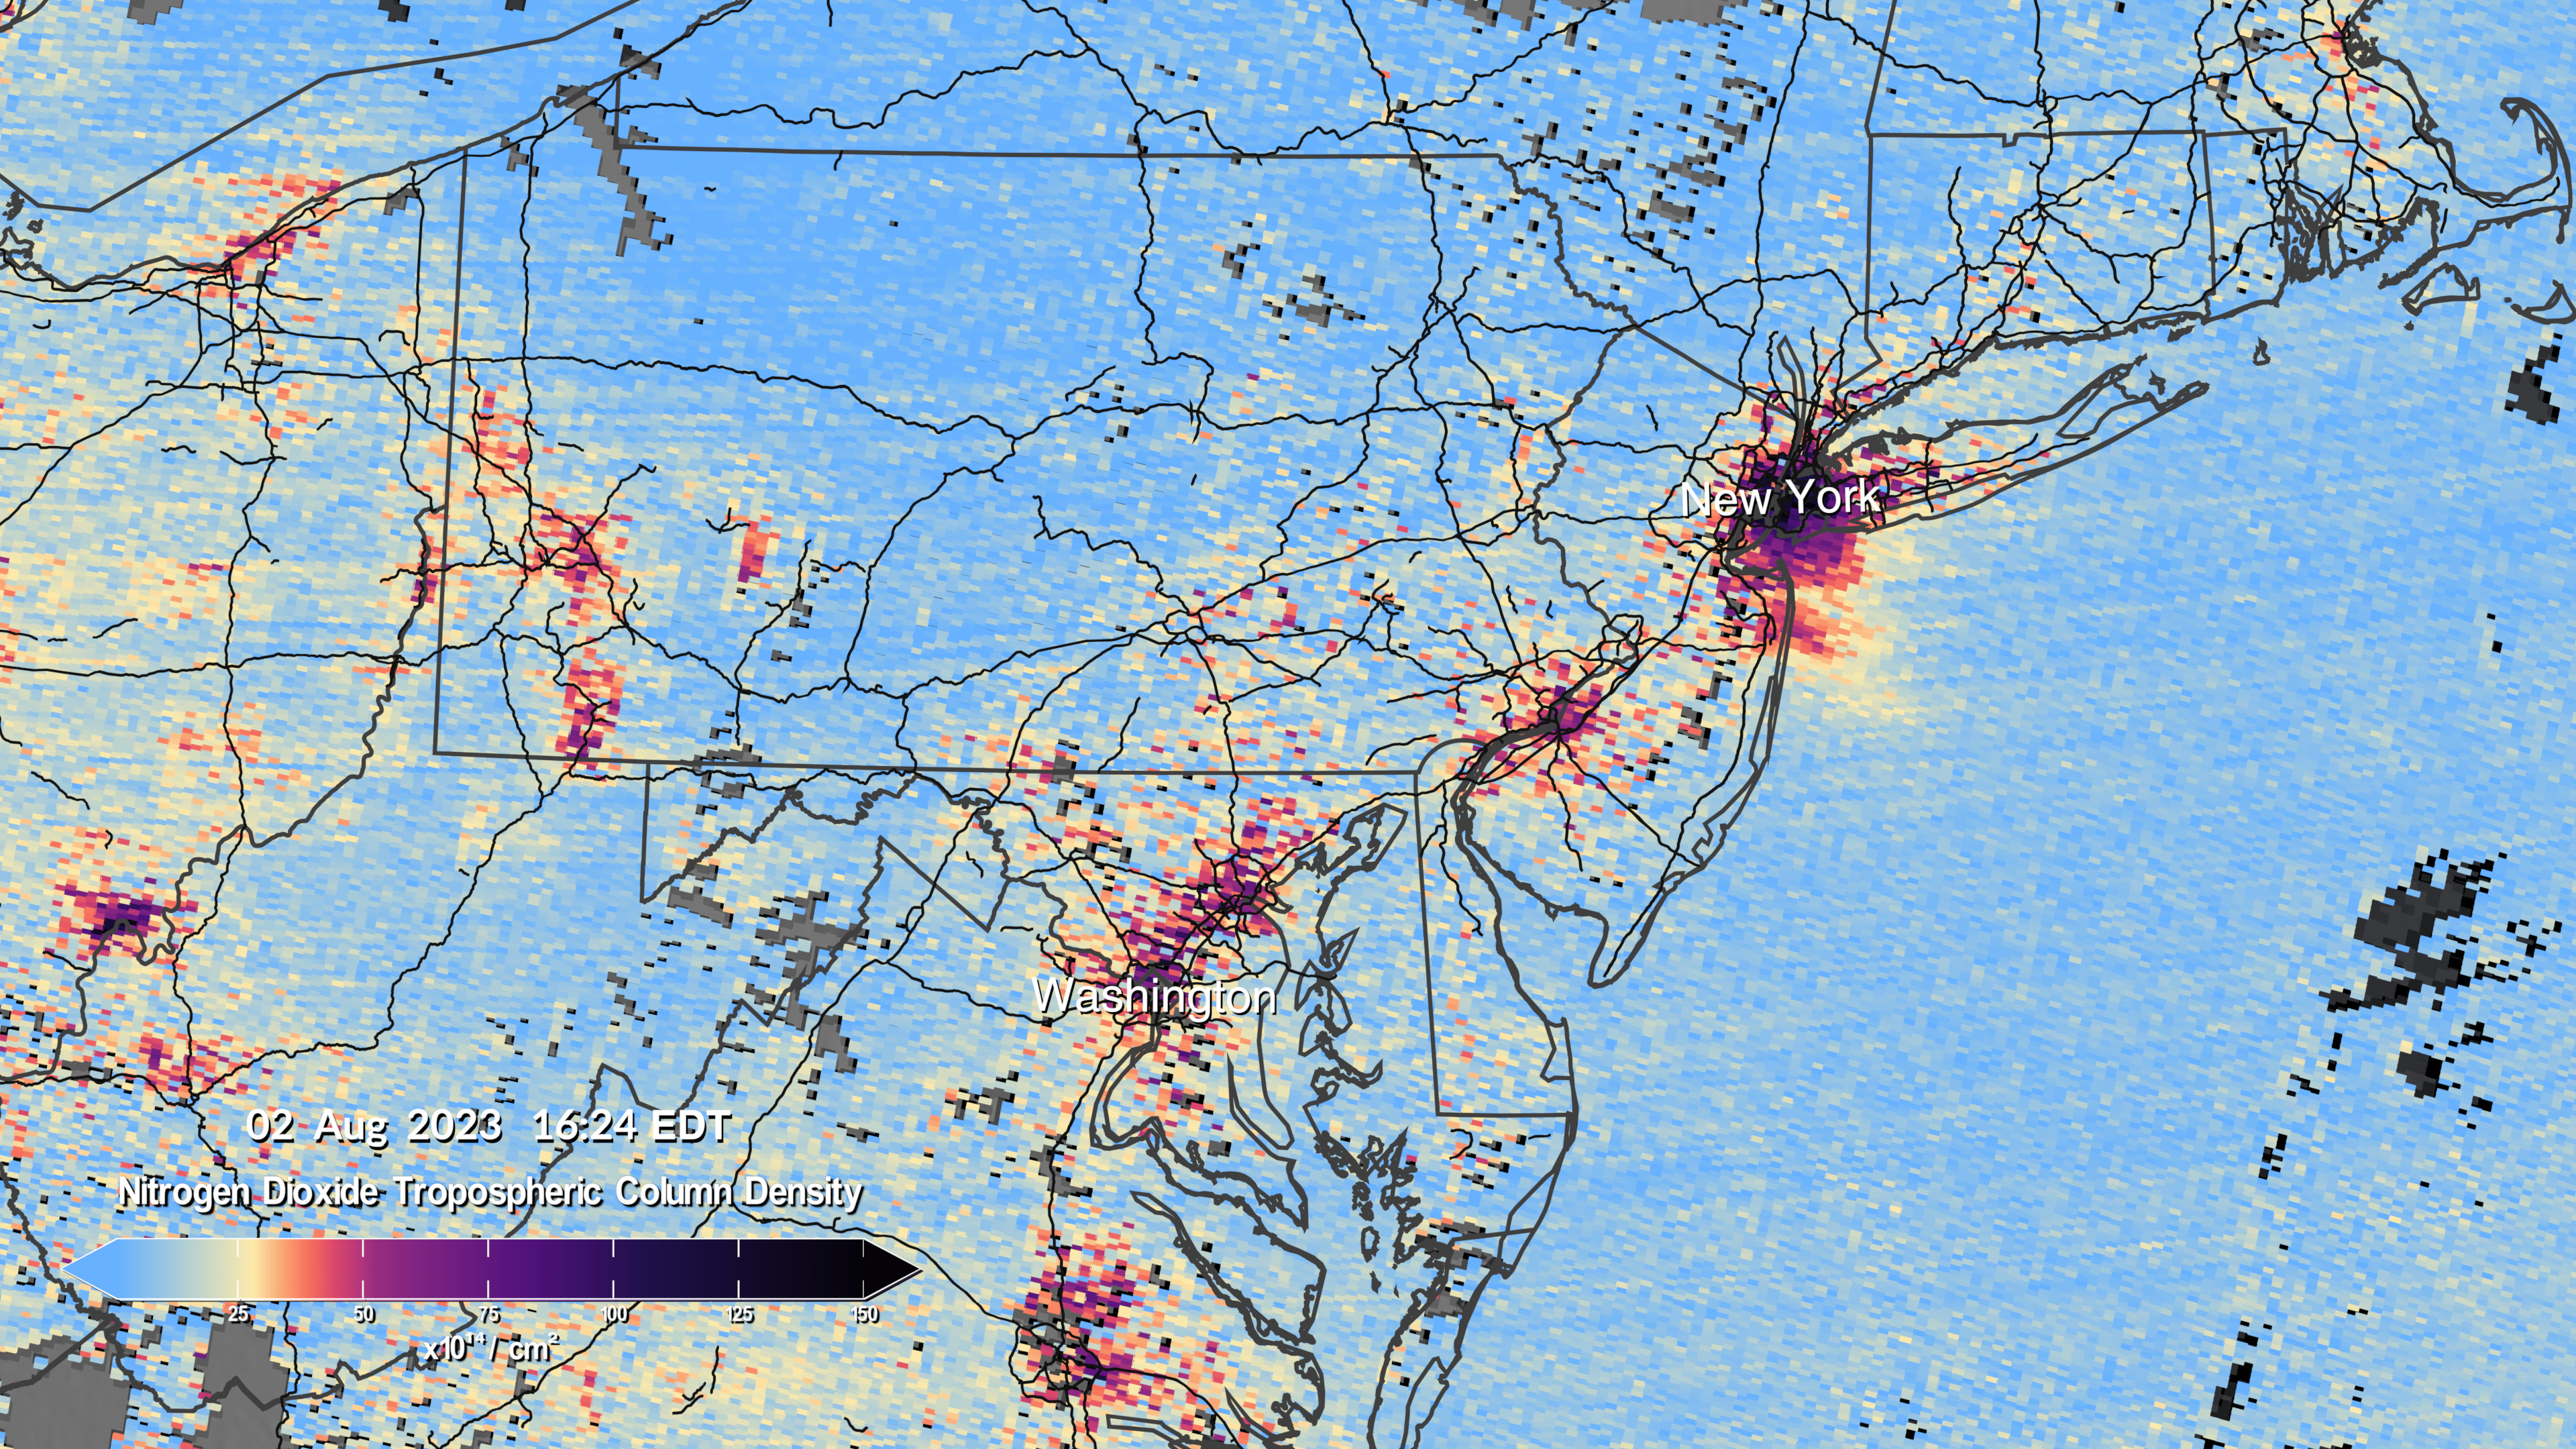
Image comparison showing nitrogen dioxide over the D.C./Philadelphia/New York City region. First image is 12:14pm EDT, second image is 4:24pm EDT.
A clip from the full visualization at the top of this page. This visualization shows nitrogen dioxide over the Dallas/Houston/New Orleans region.
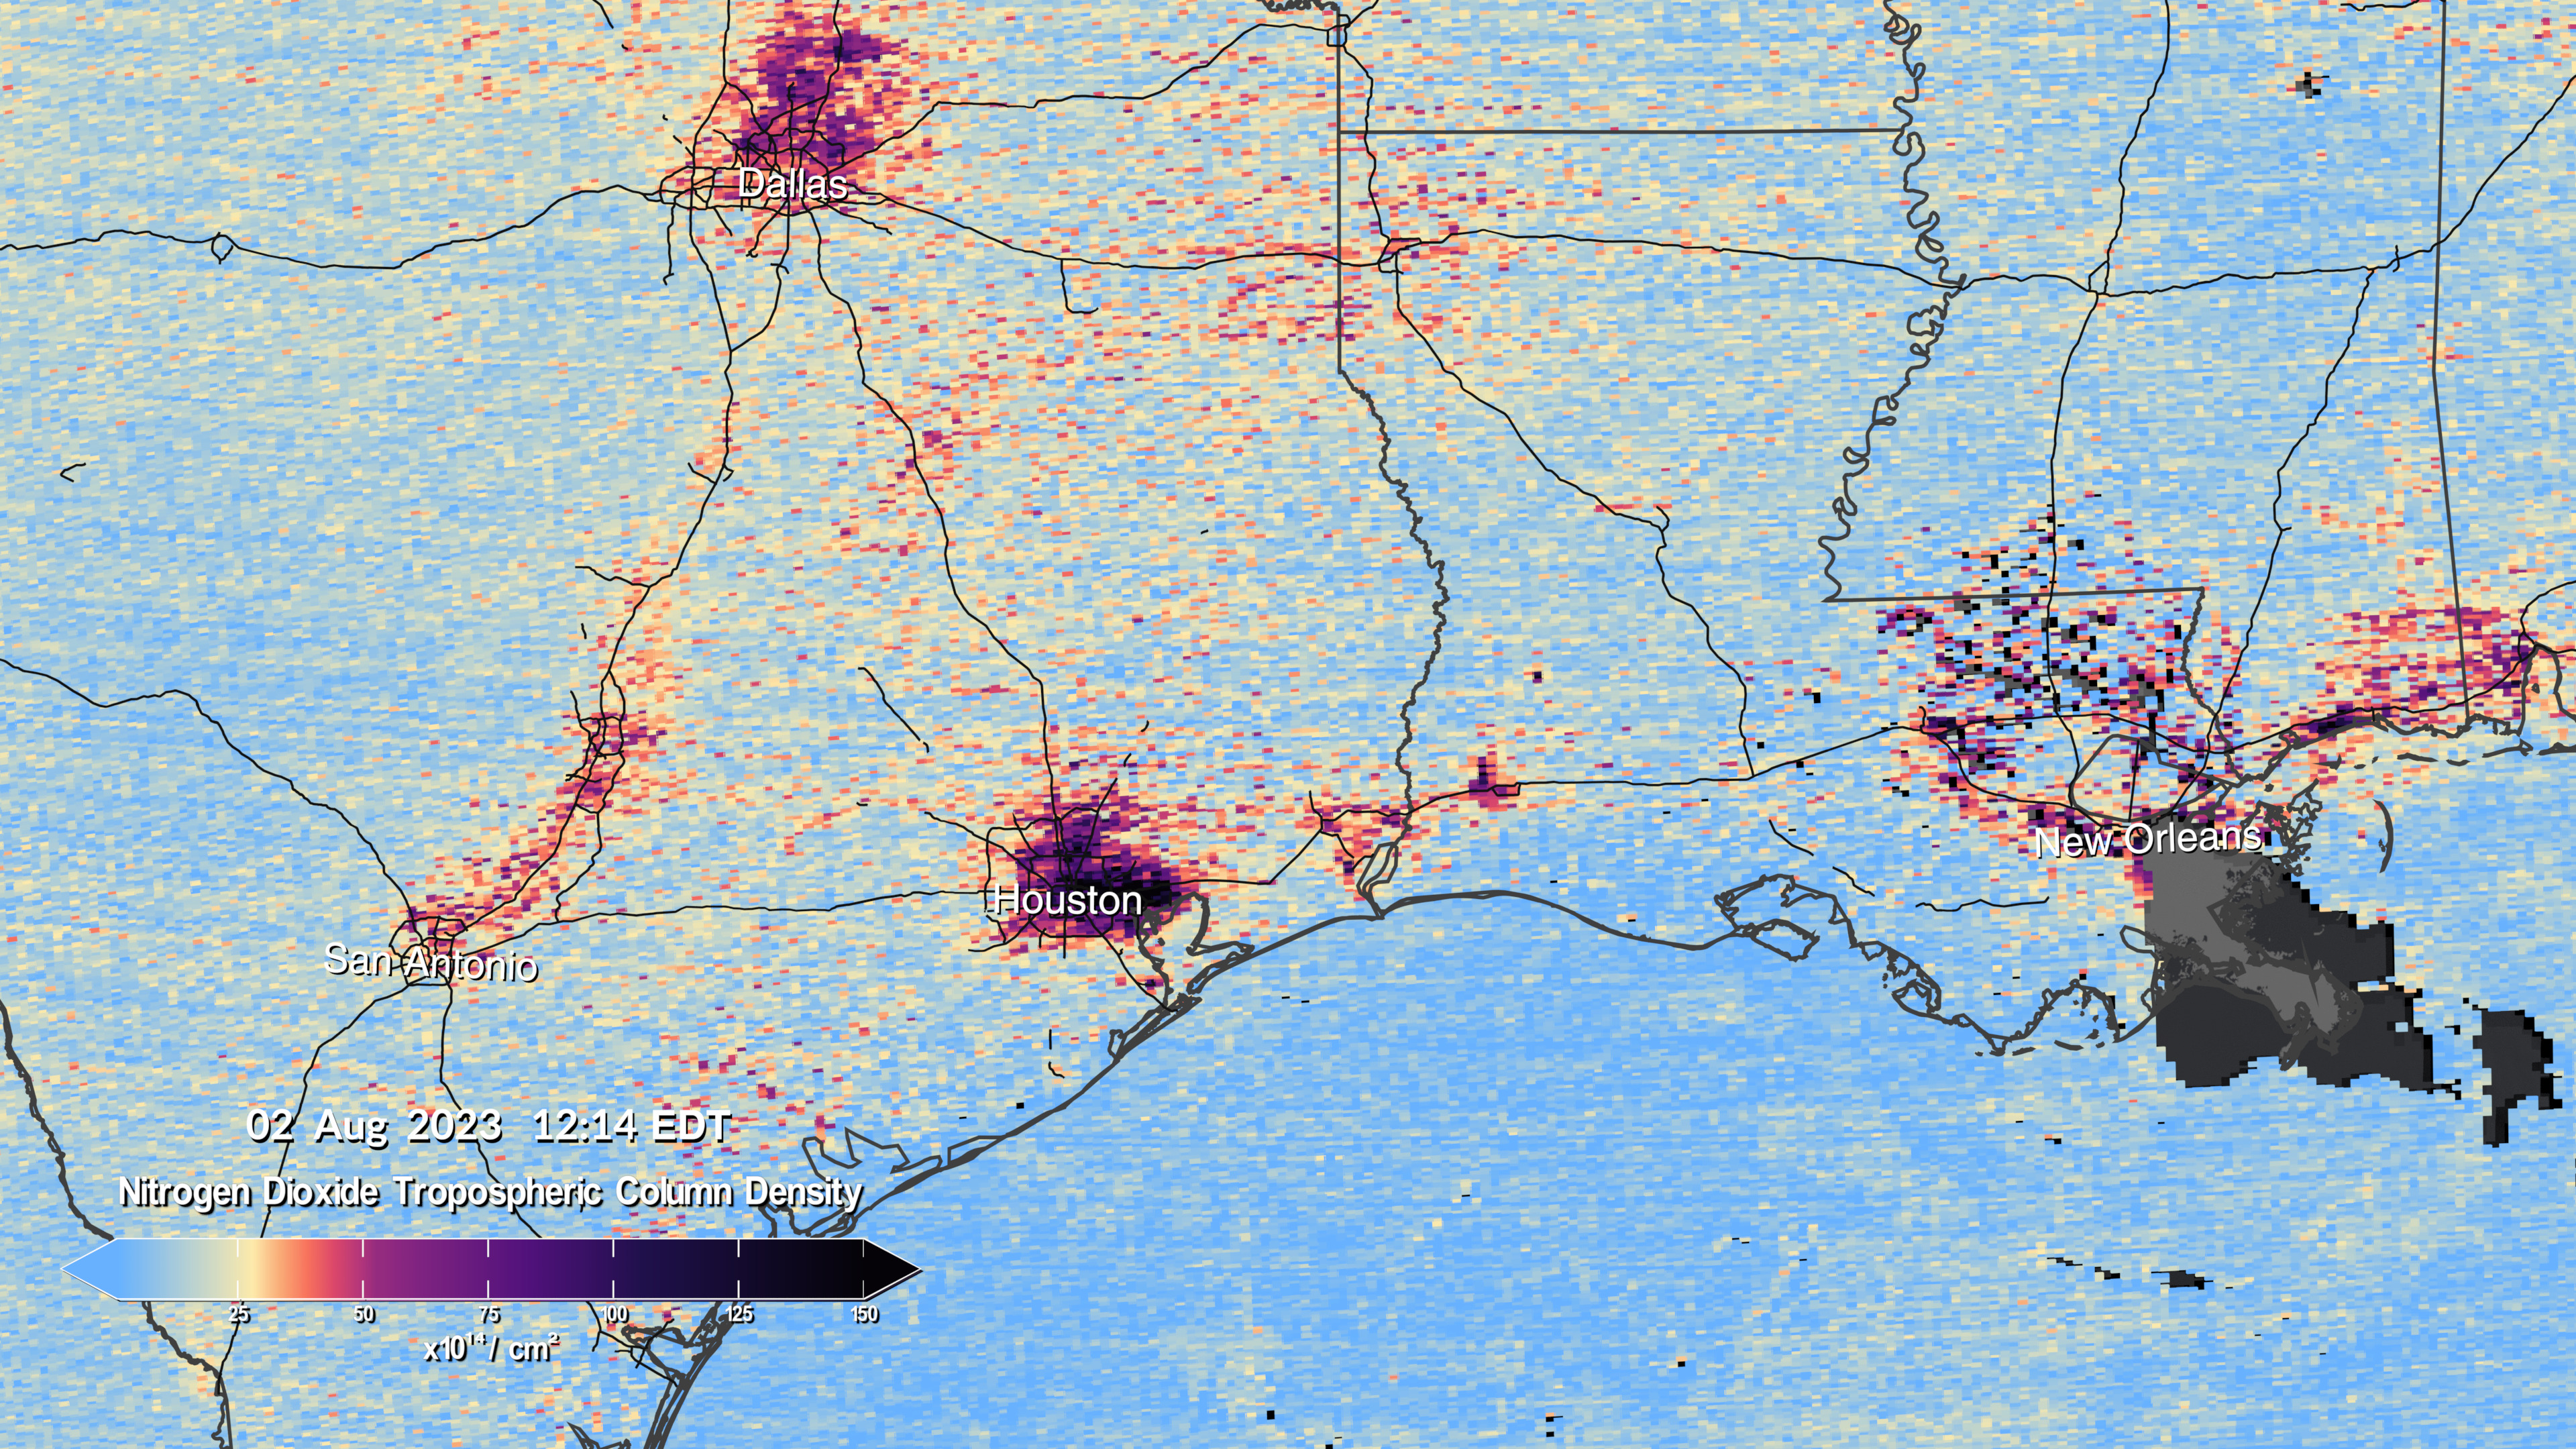
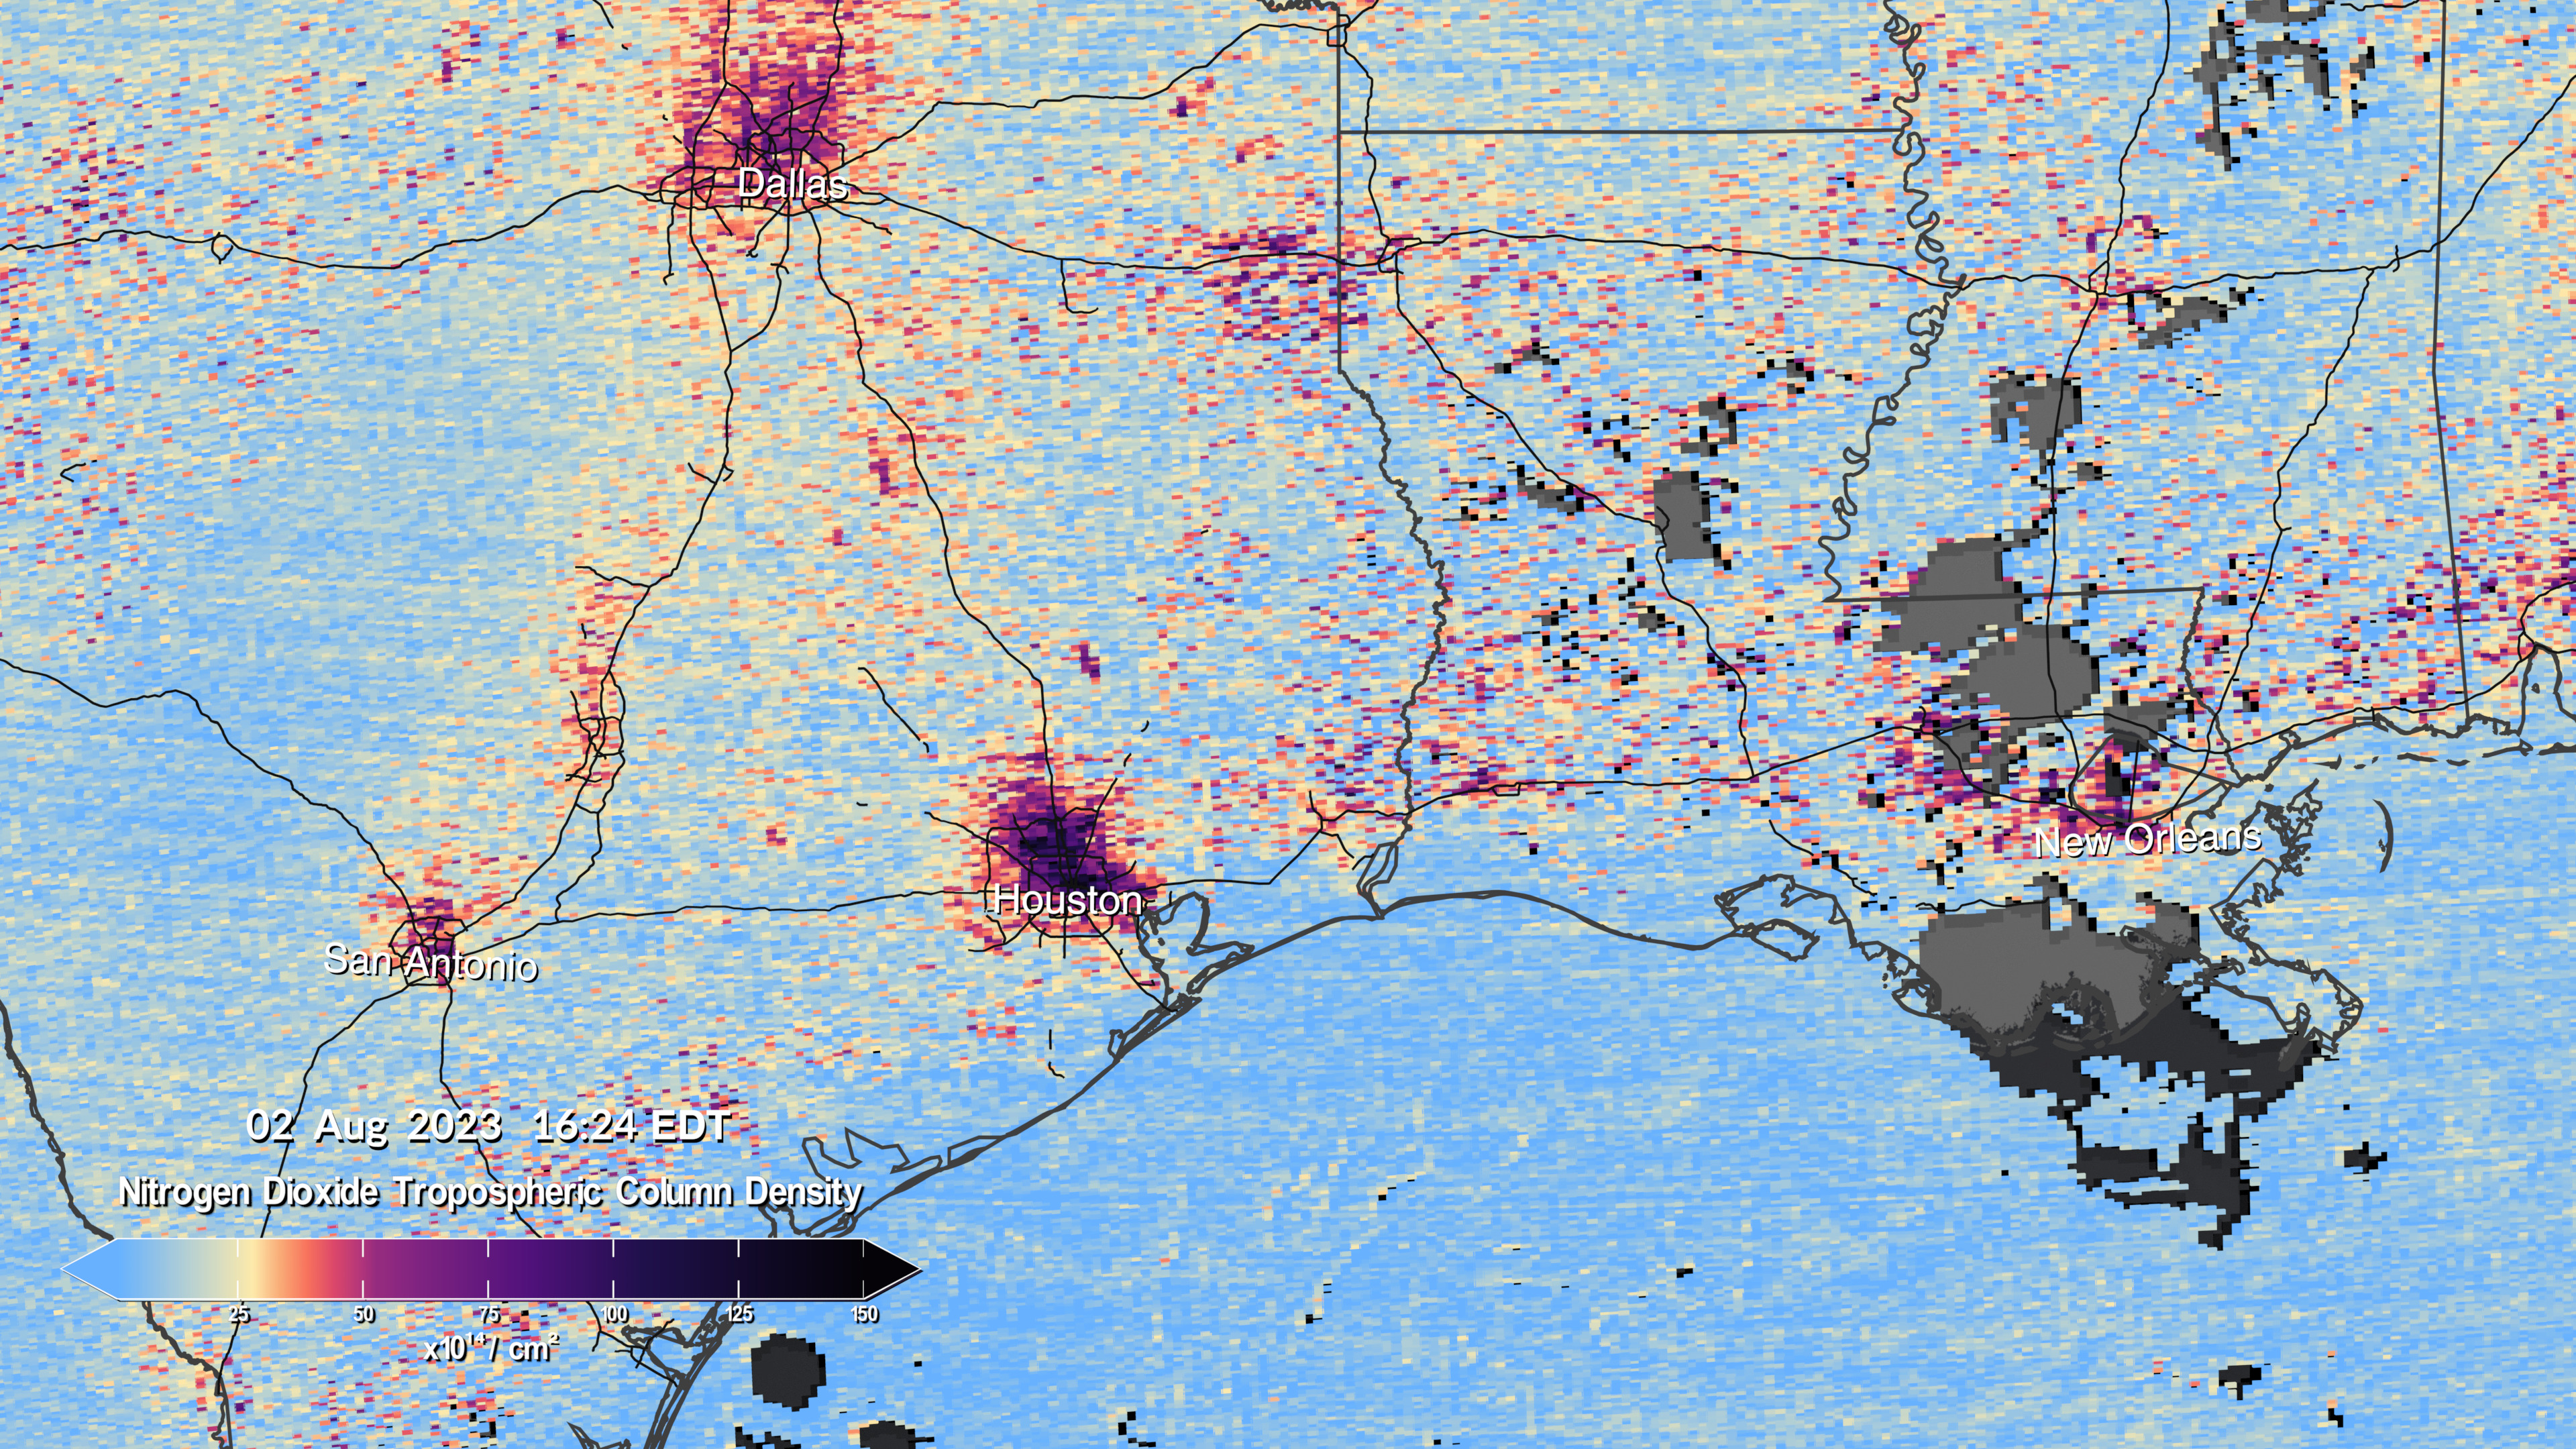
Image comparison showing nitrogen dioxide over the Dallas/Houston/New Orleans region. First image is 12:14pm EDT, second image is 4:24pm EDT.
A clip from the full visualization at the top of this page. This visualization shows nitrogen dioxide over Southern California.
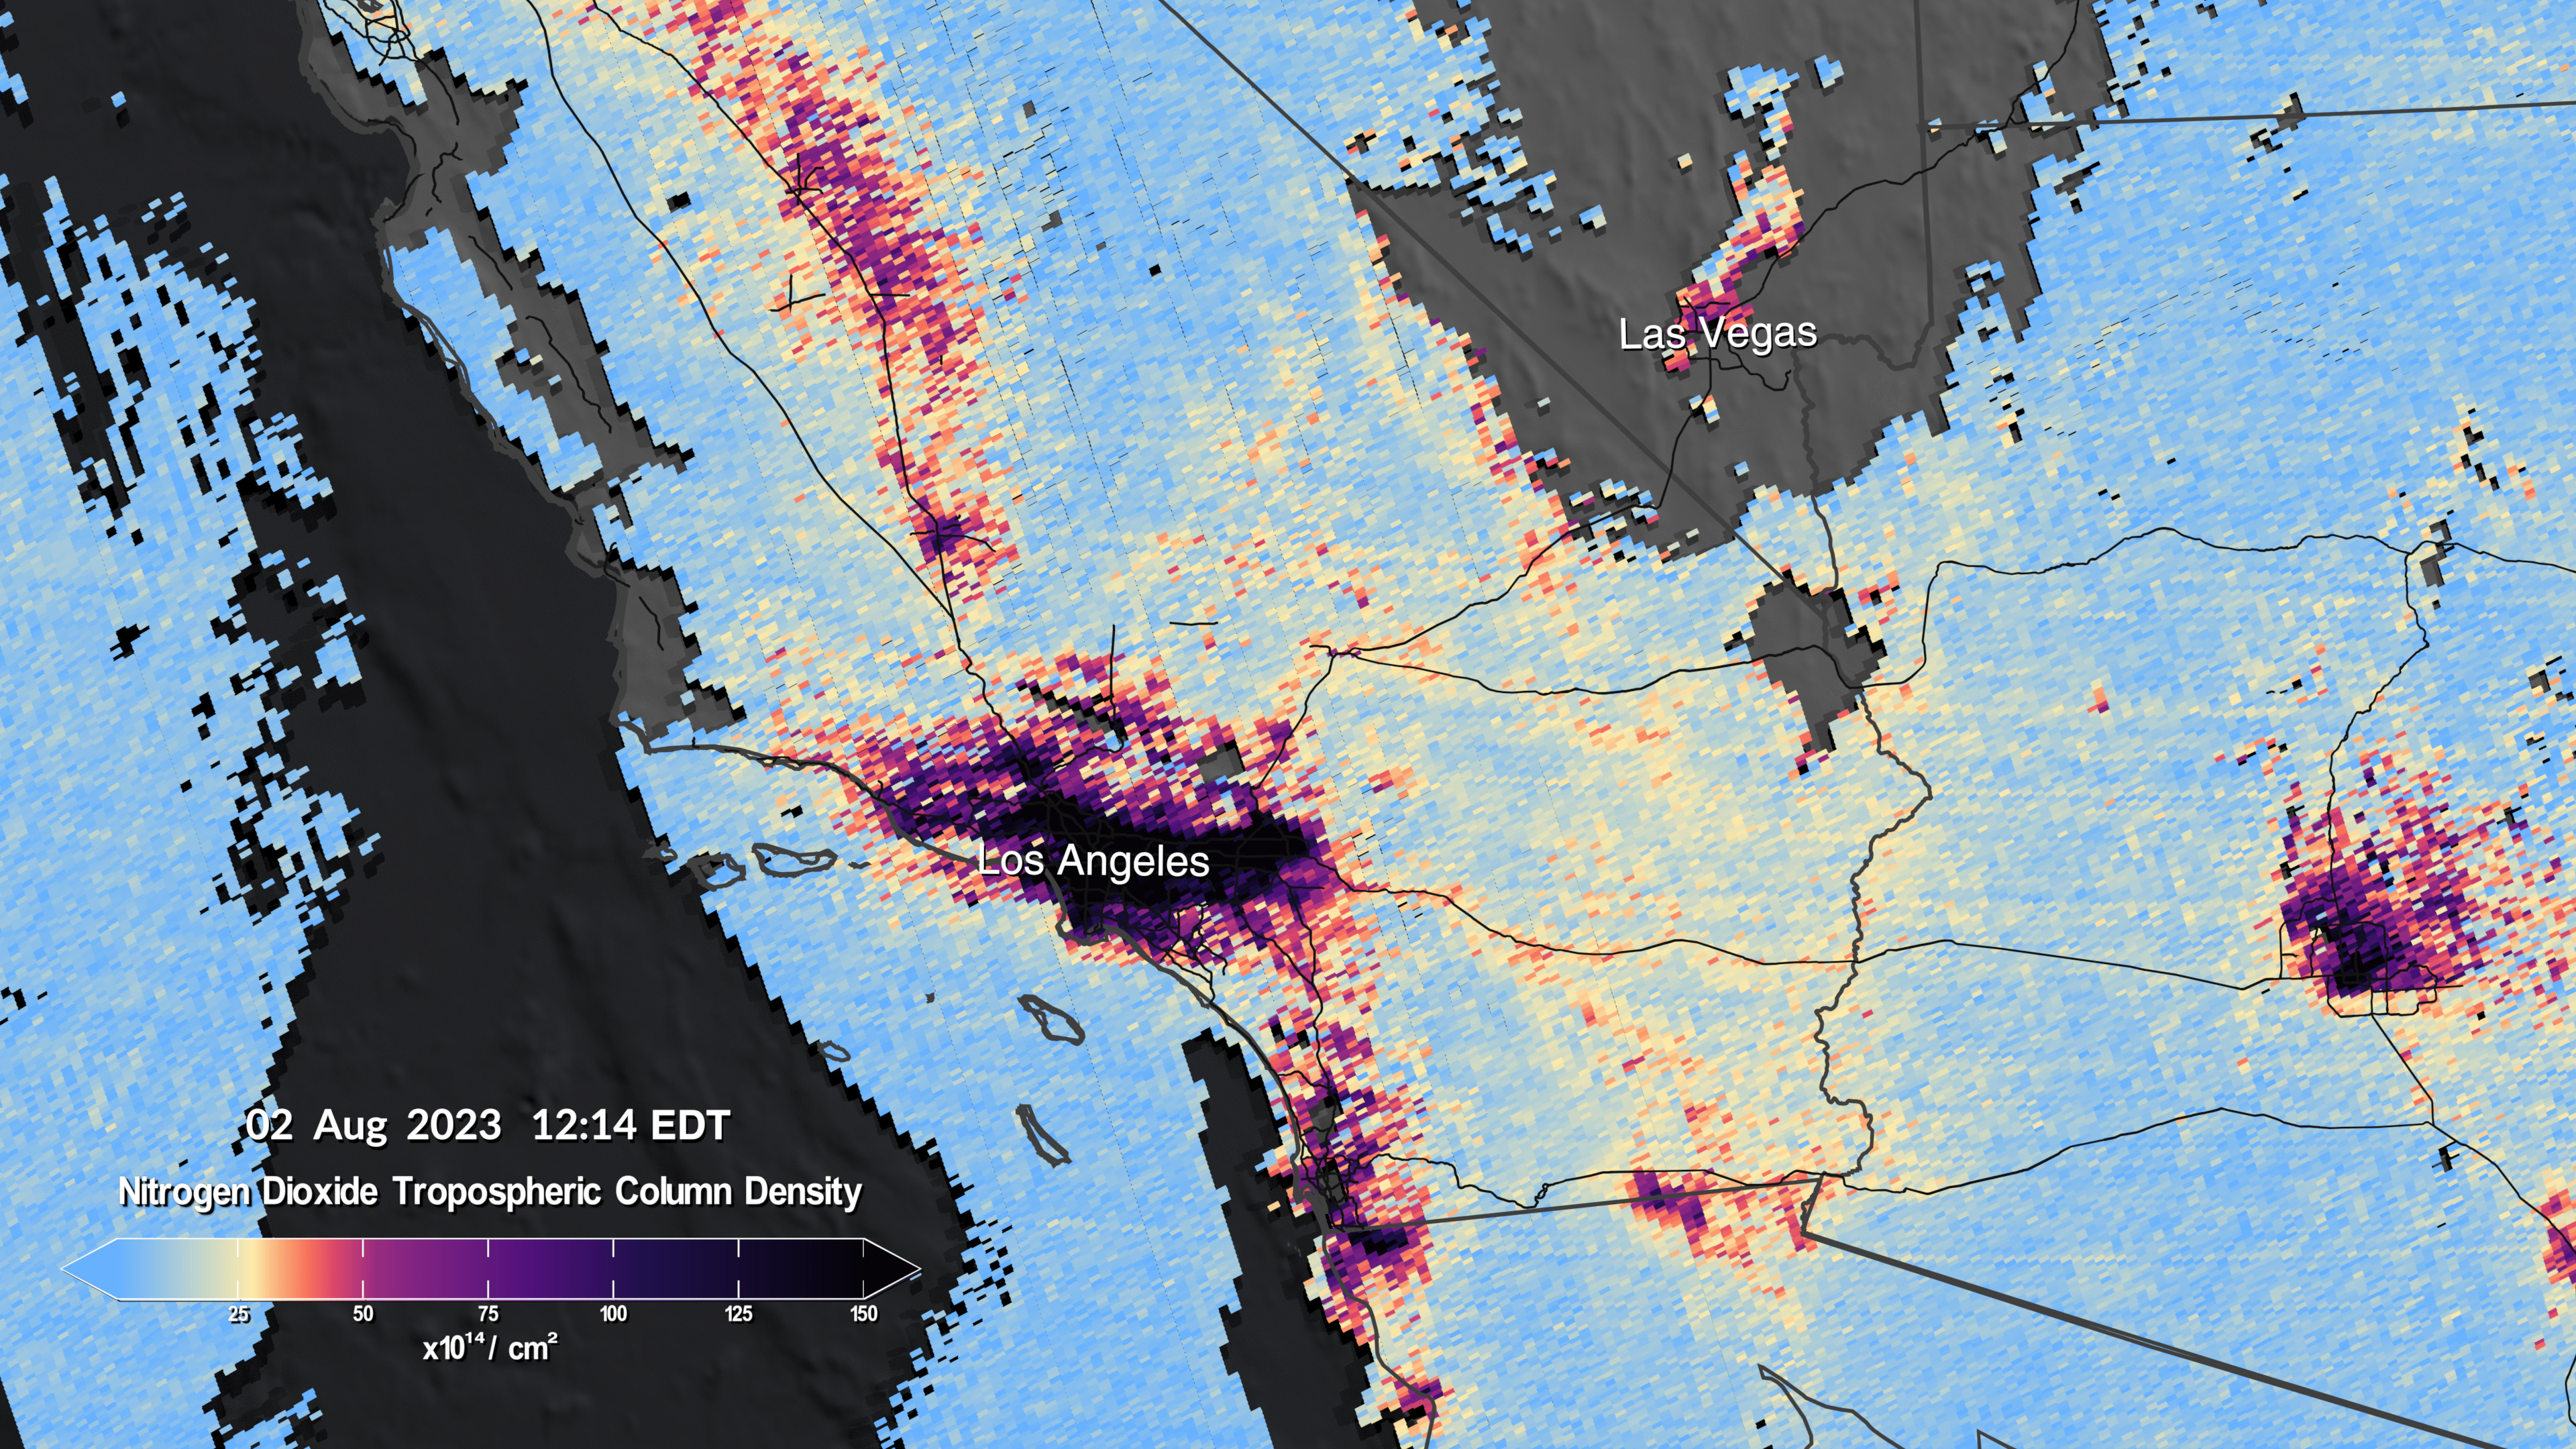
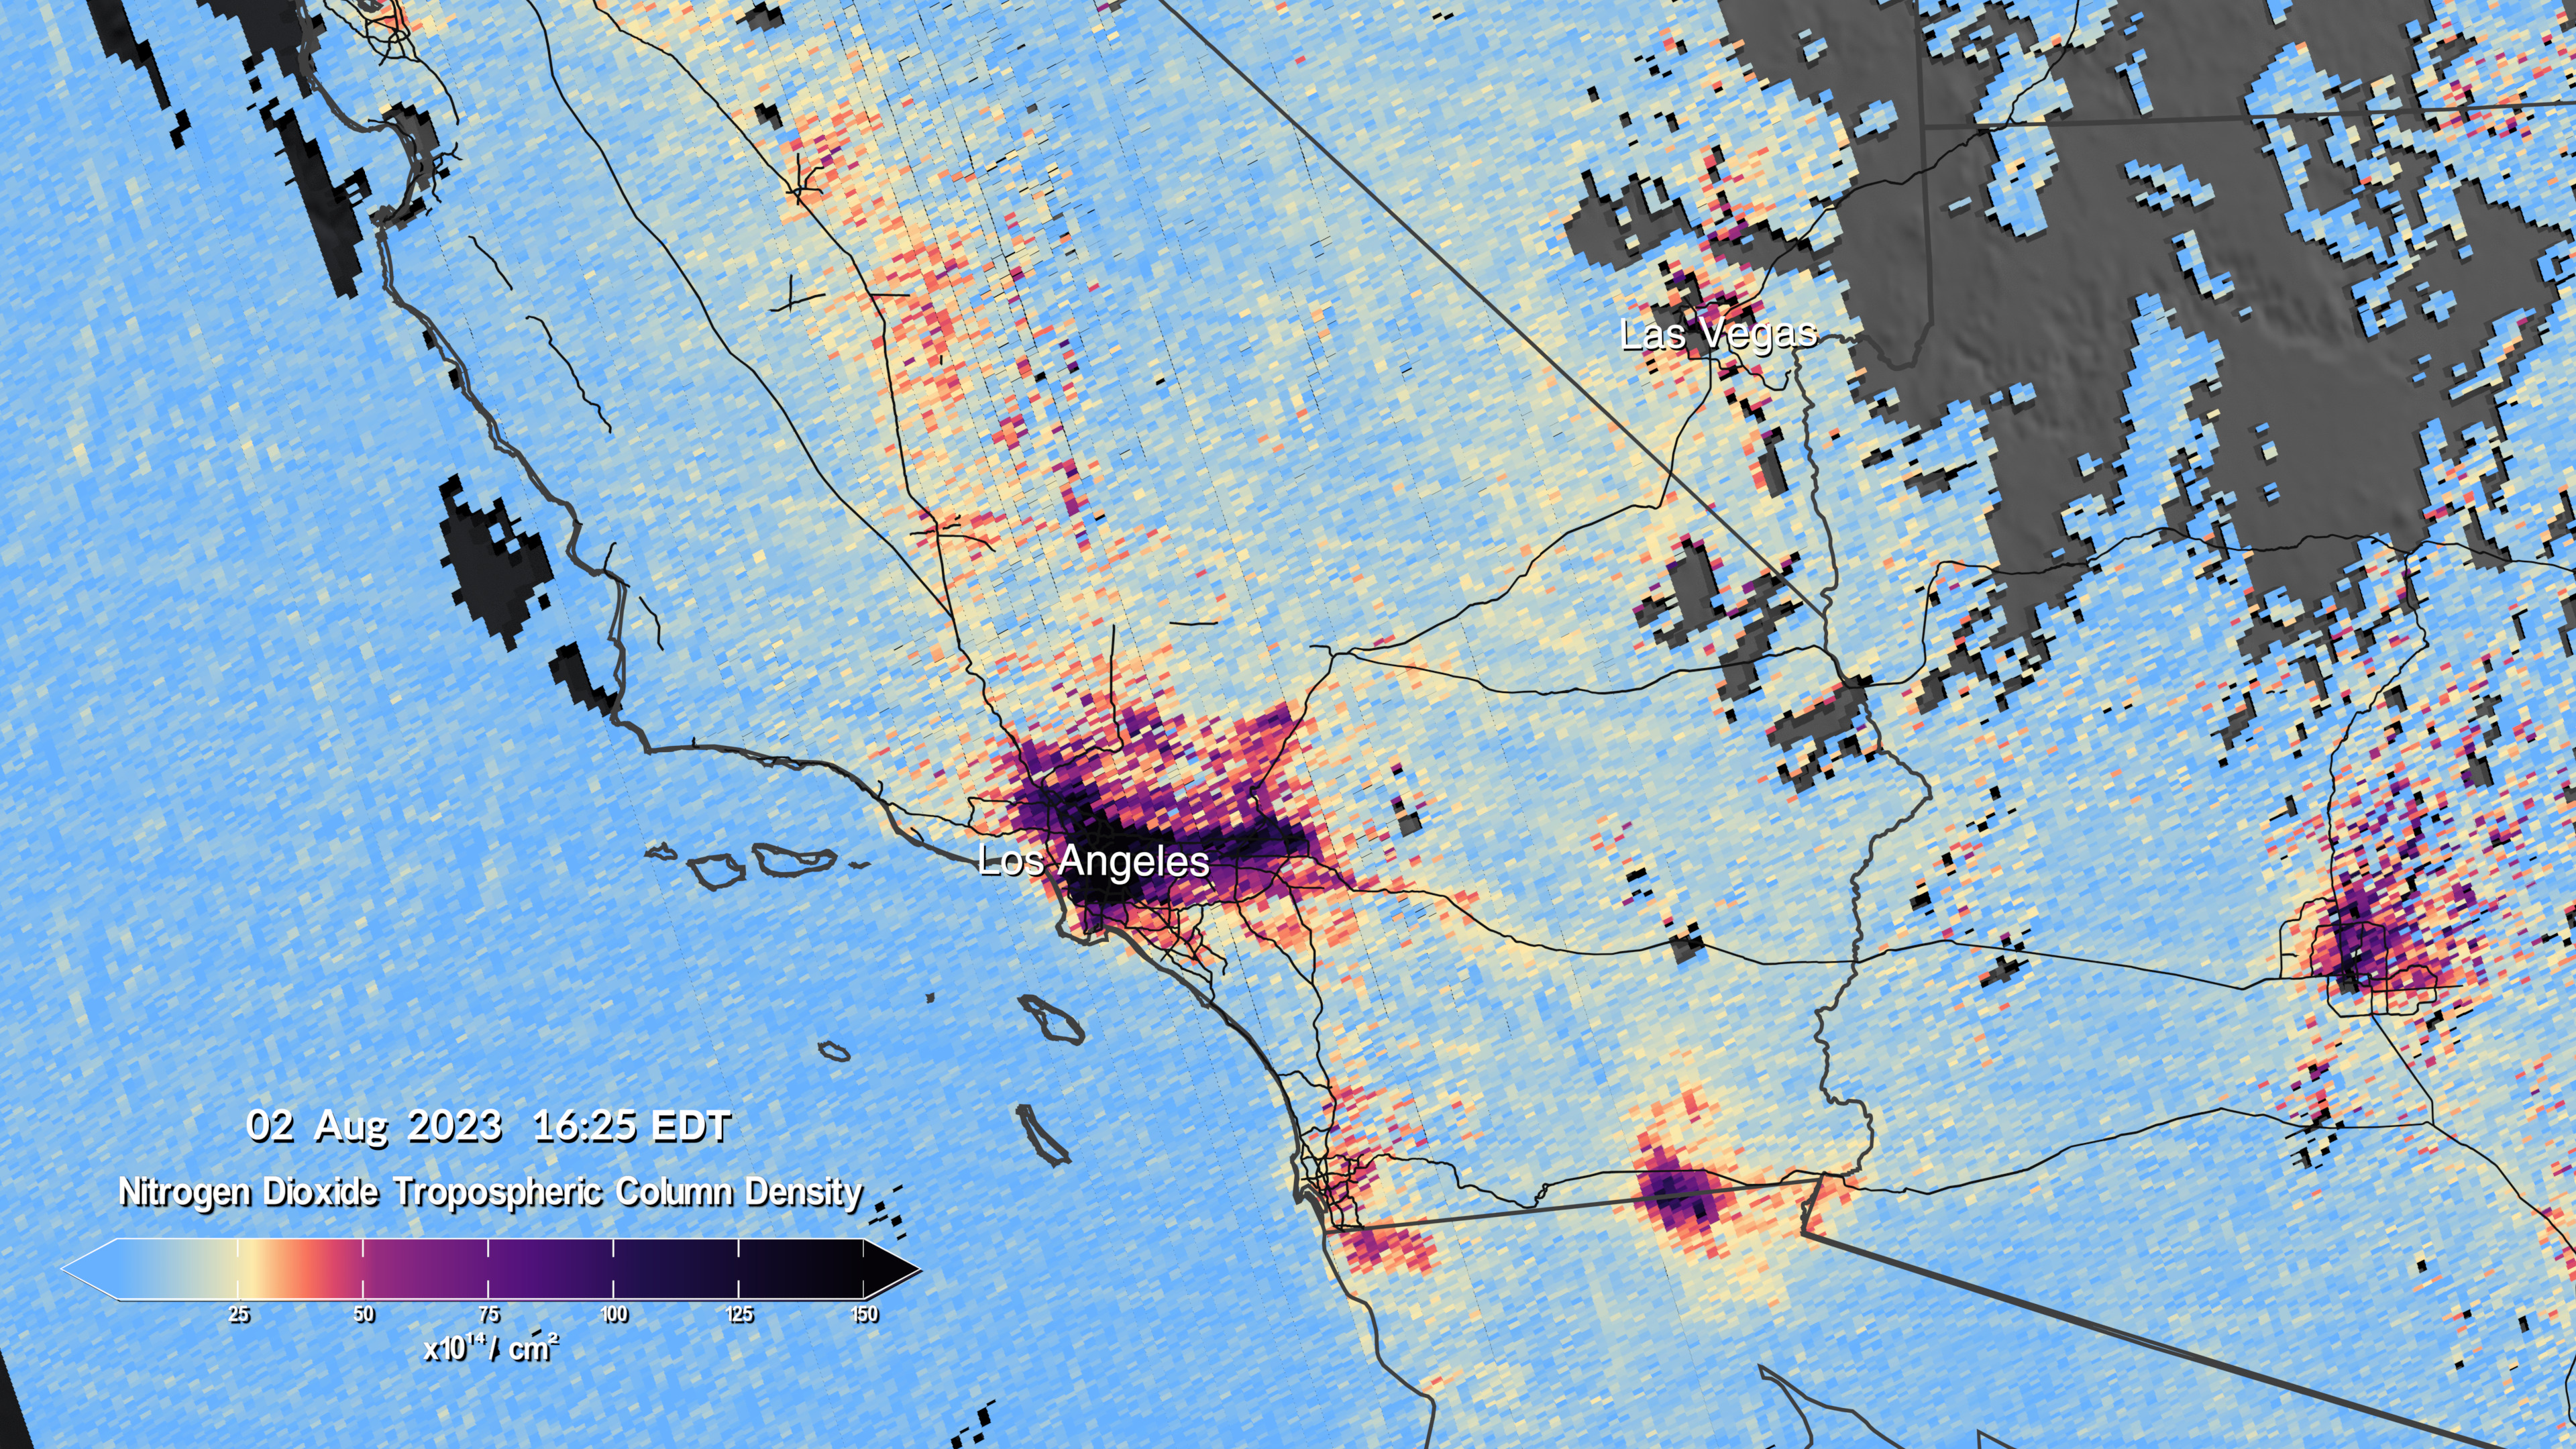
Image comparison showing nitrogen dioxide over Southern California. First image is 12:14pm EDT, second image is 4:24pm EDT.
A shorter version of the visualization at the top of this page. This version ends after zooming in to the NYC/DC region.
A shorter version of the visualization at the top of this page. This version ends after zooming in to the Chicago region.
A clip from the full visualization at the top of this page. This visualization shows nitrogen dioxide over the Chicago region.
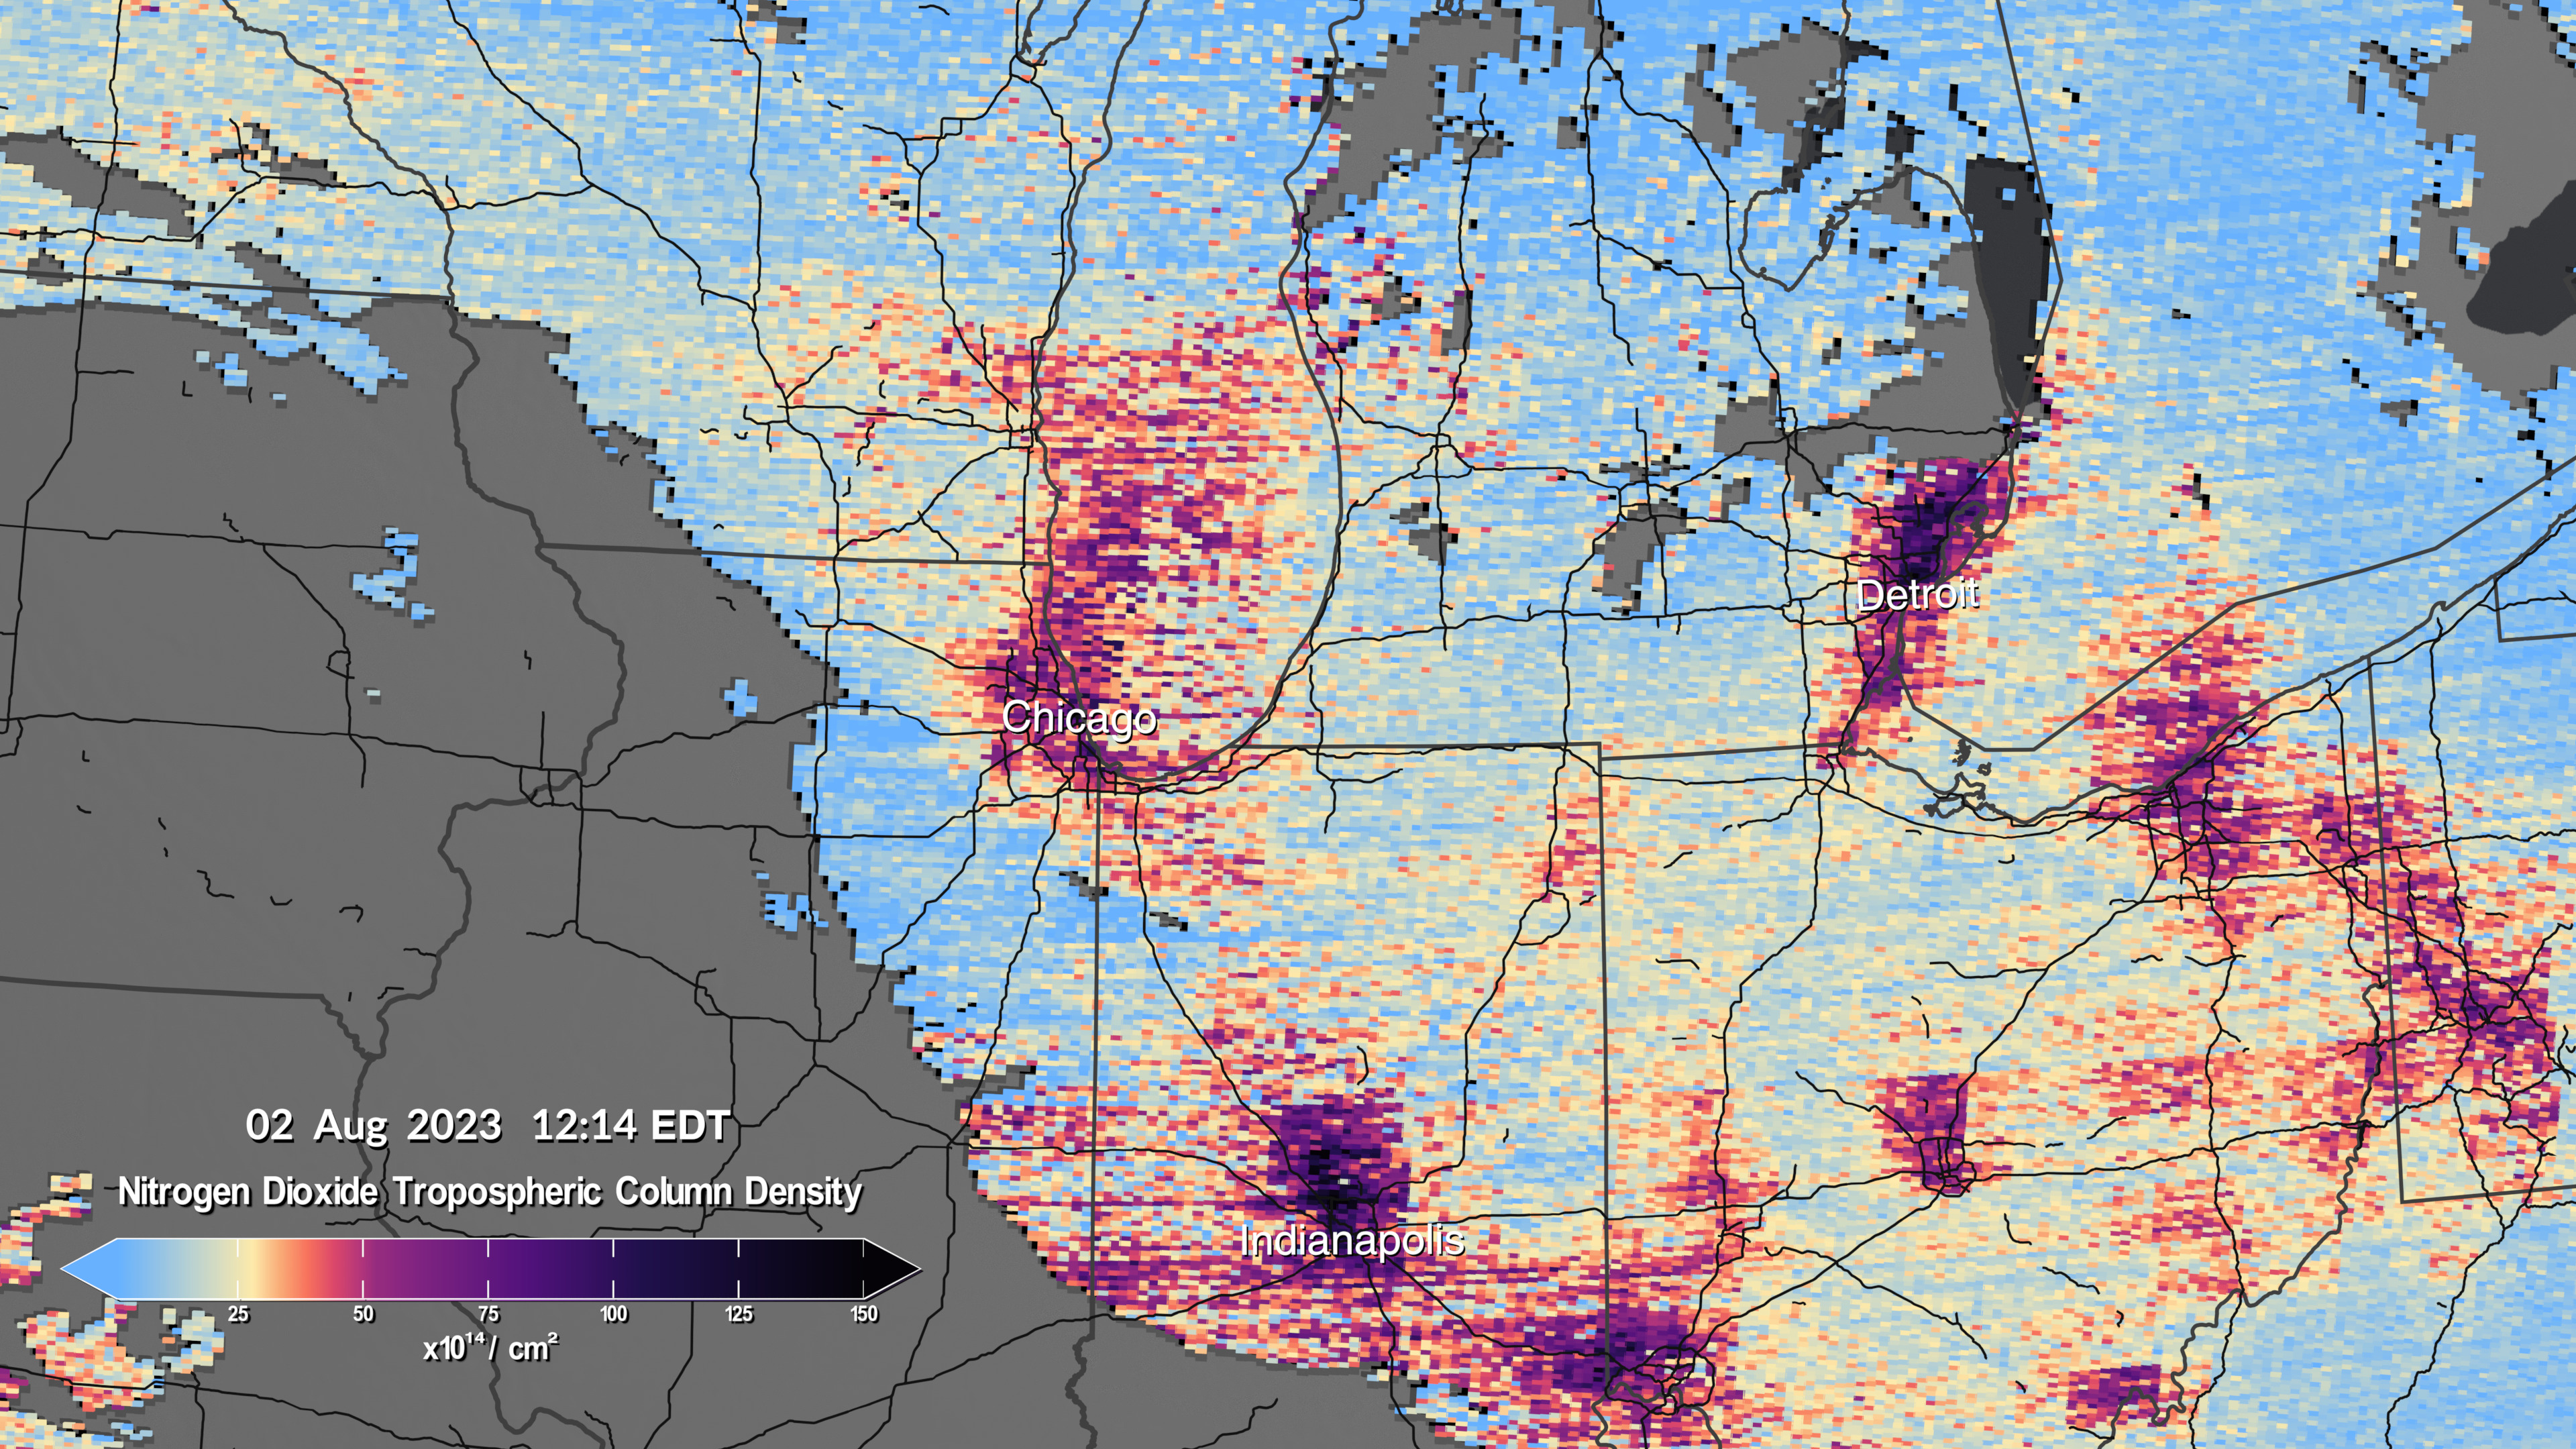
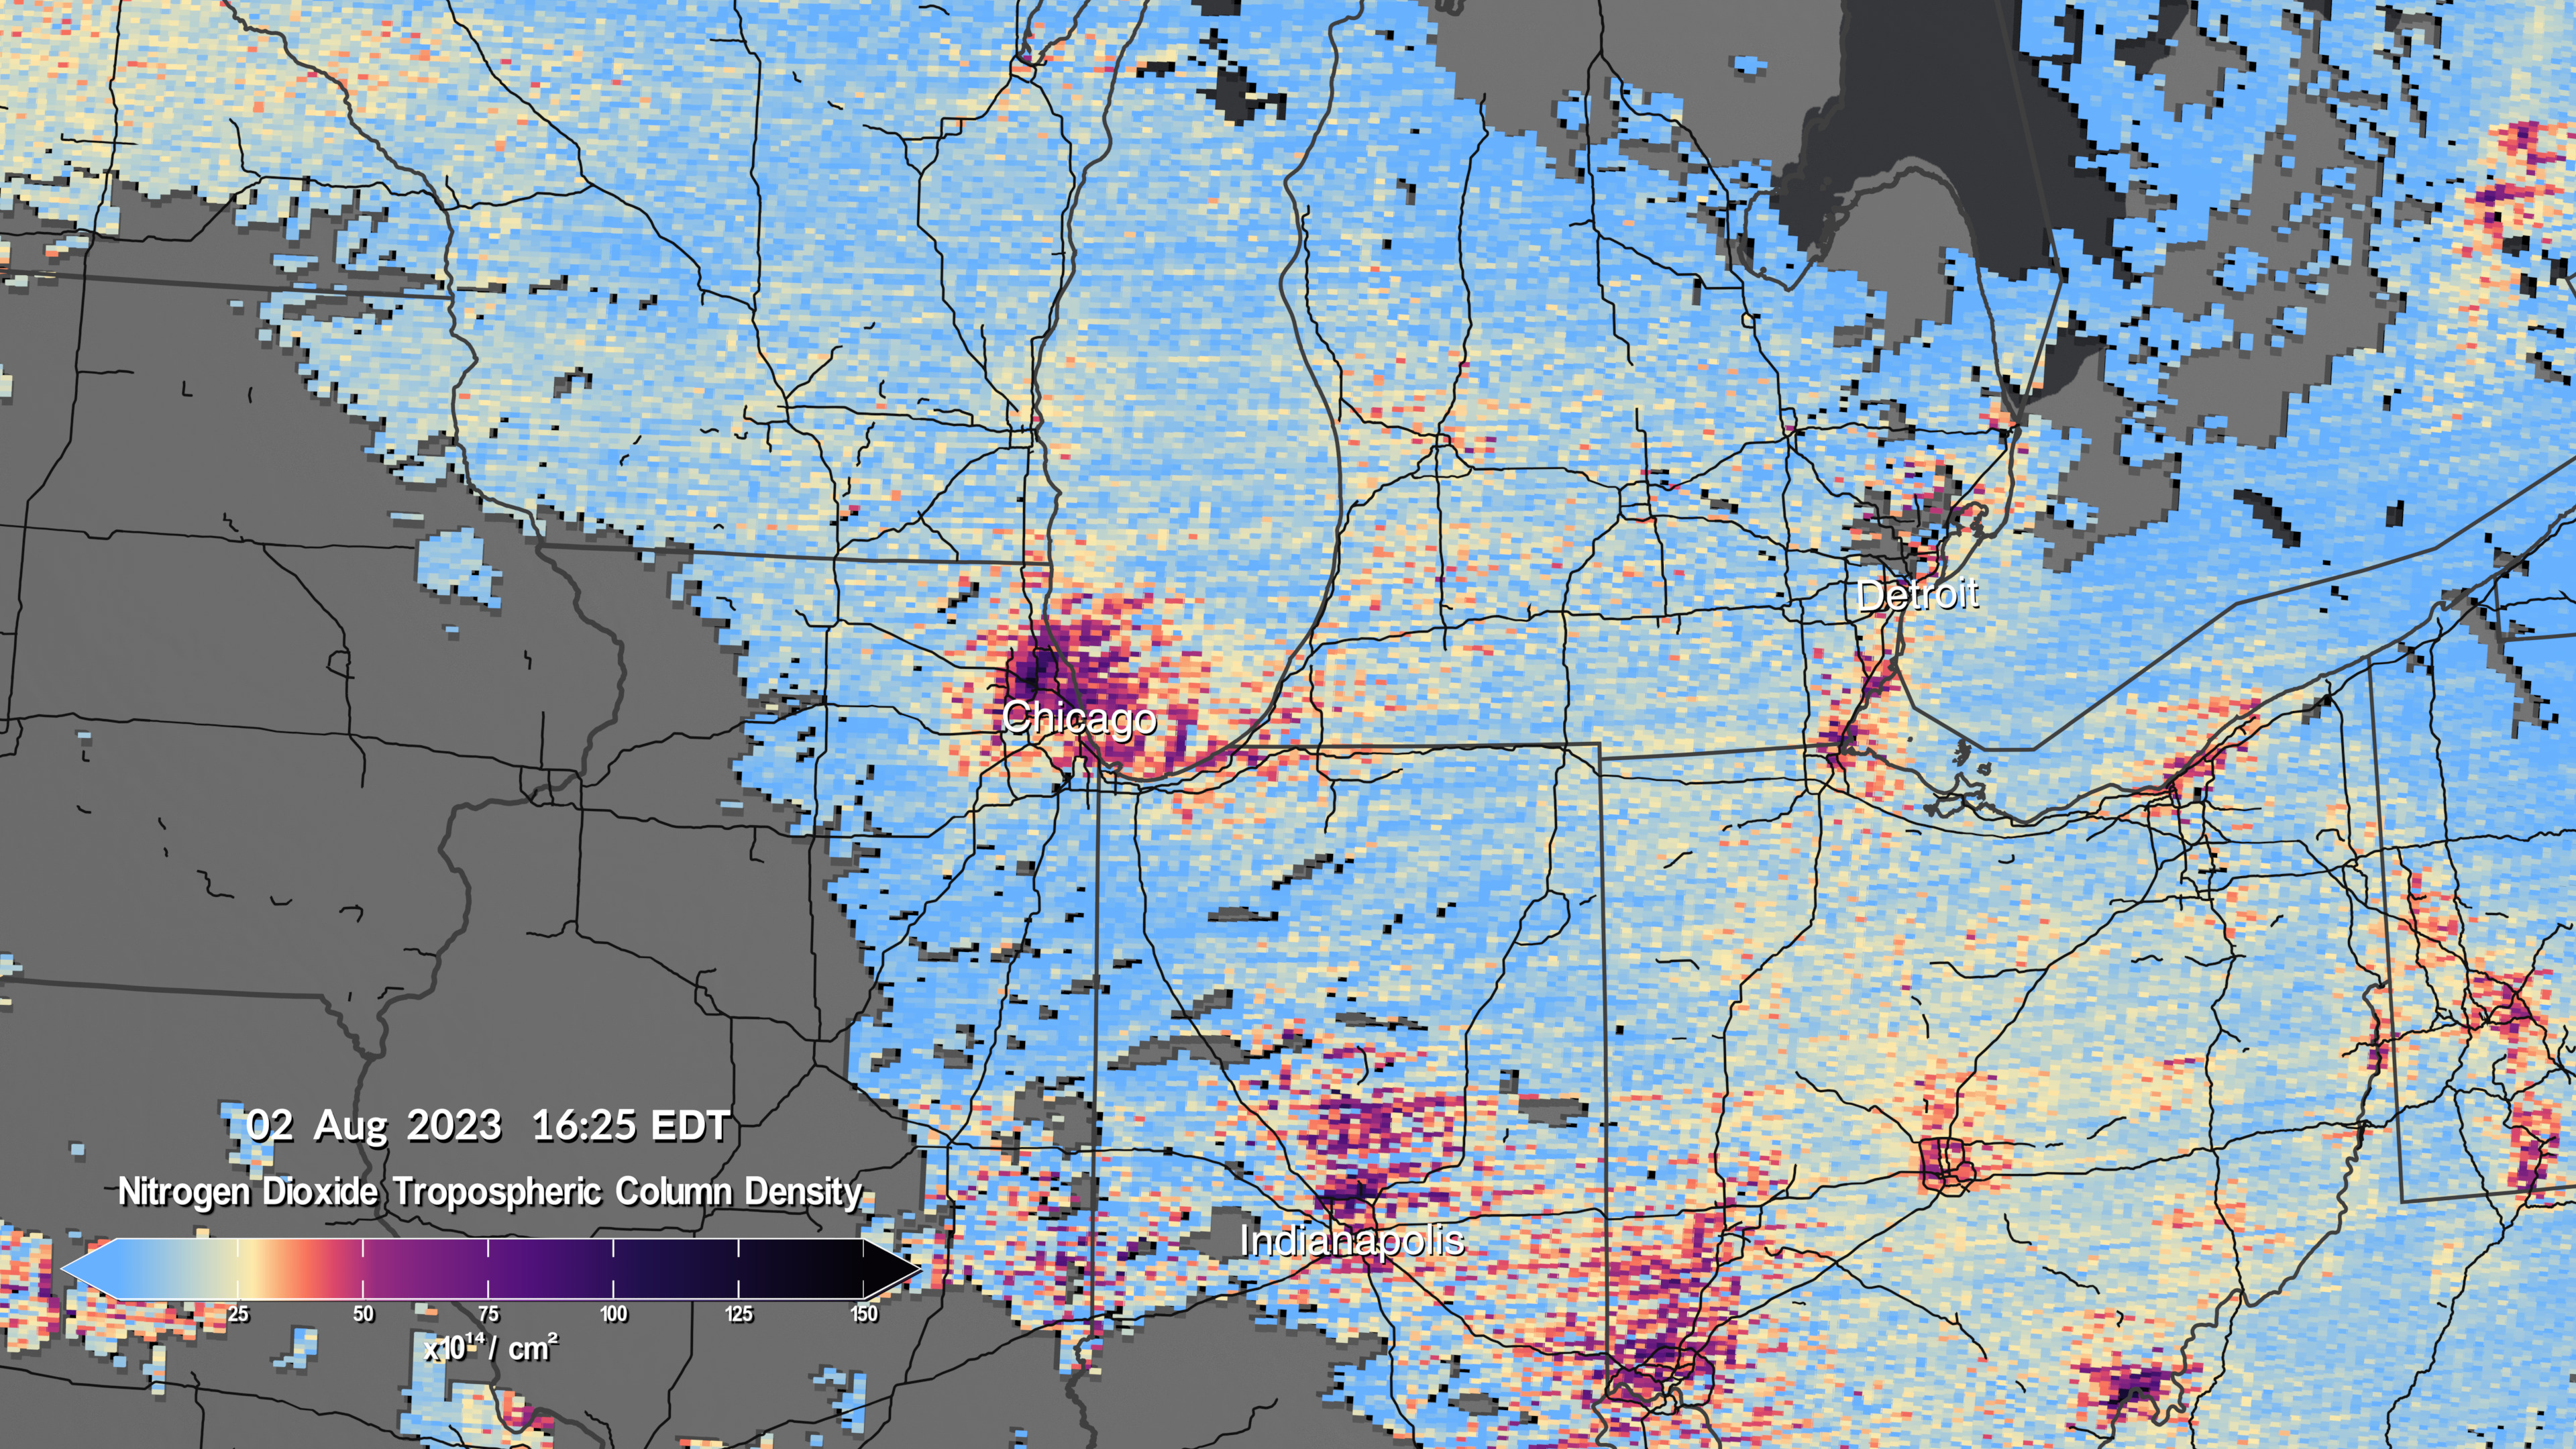
Image comparison showing nitrogen dioxide over the Chicago region. First image is 12:14pm EDT, second image is 4:24pm EDT.
TEMPO Measures NO2 Over U.S. Cities – Comparison Videos
This video compares nitrogen dioxide over Southern California at 12:14pm EDT and 4:24pm EDT.
This video compares nitrogen dioxide levels over Chicago at 12:14pm EDT and 4:24pm EDT.
This video compares nitrogen dioxide levels over the Northeastern U.S. at 12:14pm EDT and 4:24pm EDT.
Credits
Please give credit for this item to:
NASA's Scientific Visualization Studio
Data provided by the Smithsonian Astrophysical Observatory at the Center for Astrophysics | Harvard & Smithsonian.
-
Visualizers
-
Kel Elkins
(USRA)

- Trent L. Schindler (USRA)
-
Cindy Starr
(Global Science and Technology, Inc.)
-
Kel Elkins
(USRA)
-
Technical support
- Laurence Schuler (ADNET Systems, Inc.)
- Ian Jones (ADNET Systems, Inc.)
-
Scientists
- Caroline Nowlan (Center for Astrophysics | Harvard & Smithsonian)
- Xiong Liu (Center for Astrophysics | Harvard & Smithsonian)
Related
- ID: 5566
Newer Versions
- ID: 5175
Release date
This page was originally published on Thursday, August 24, 2023.
This page was last updated on Tuesday, April 29, 2025 at 12:01 PM EDT.