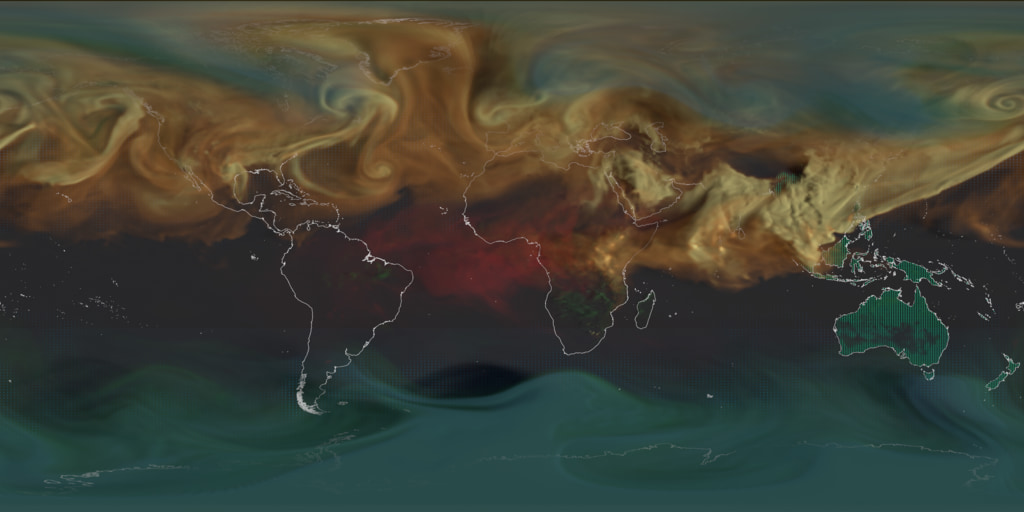
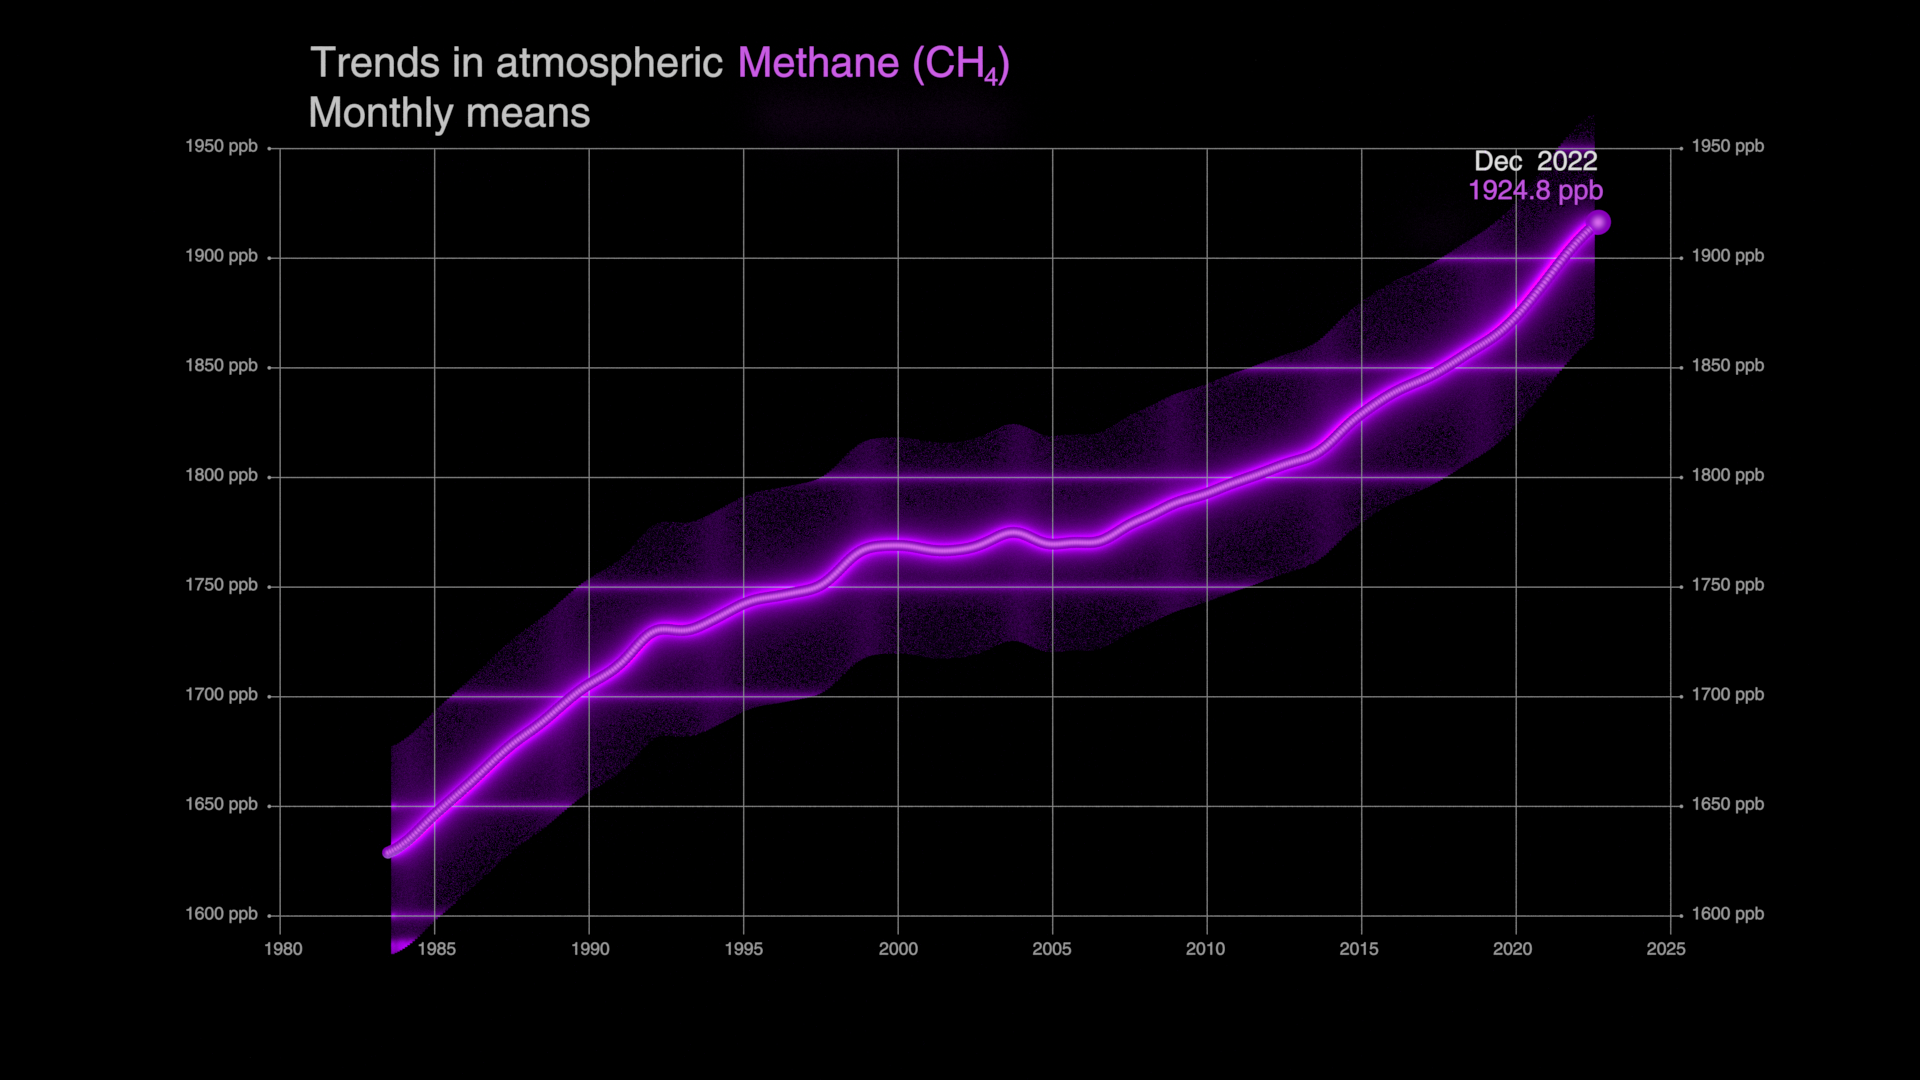
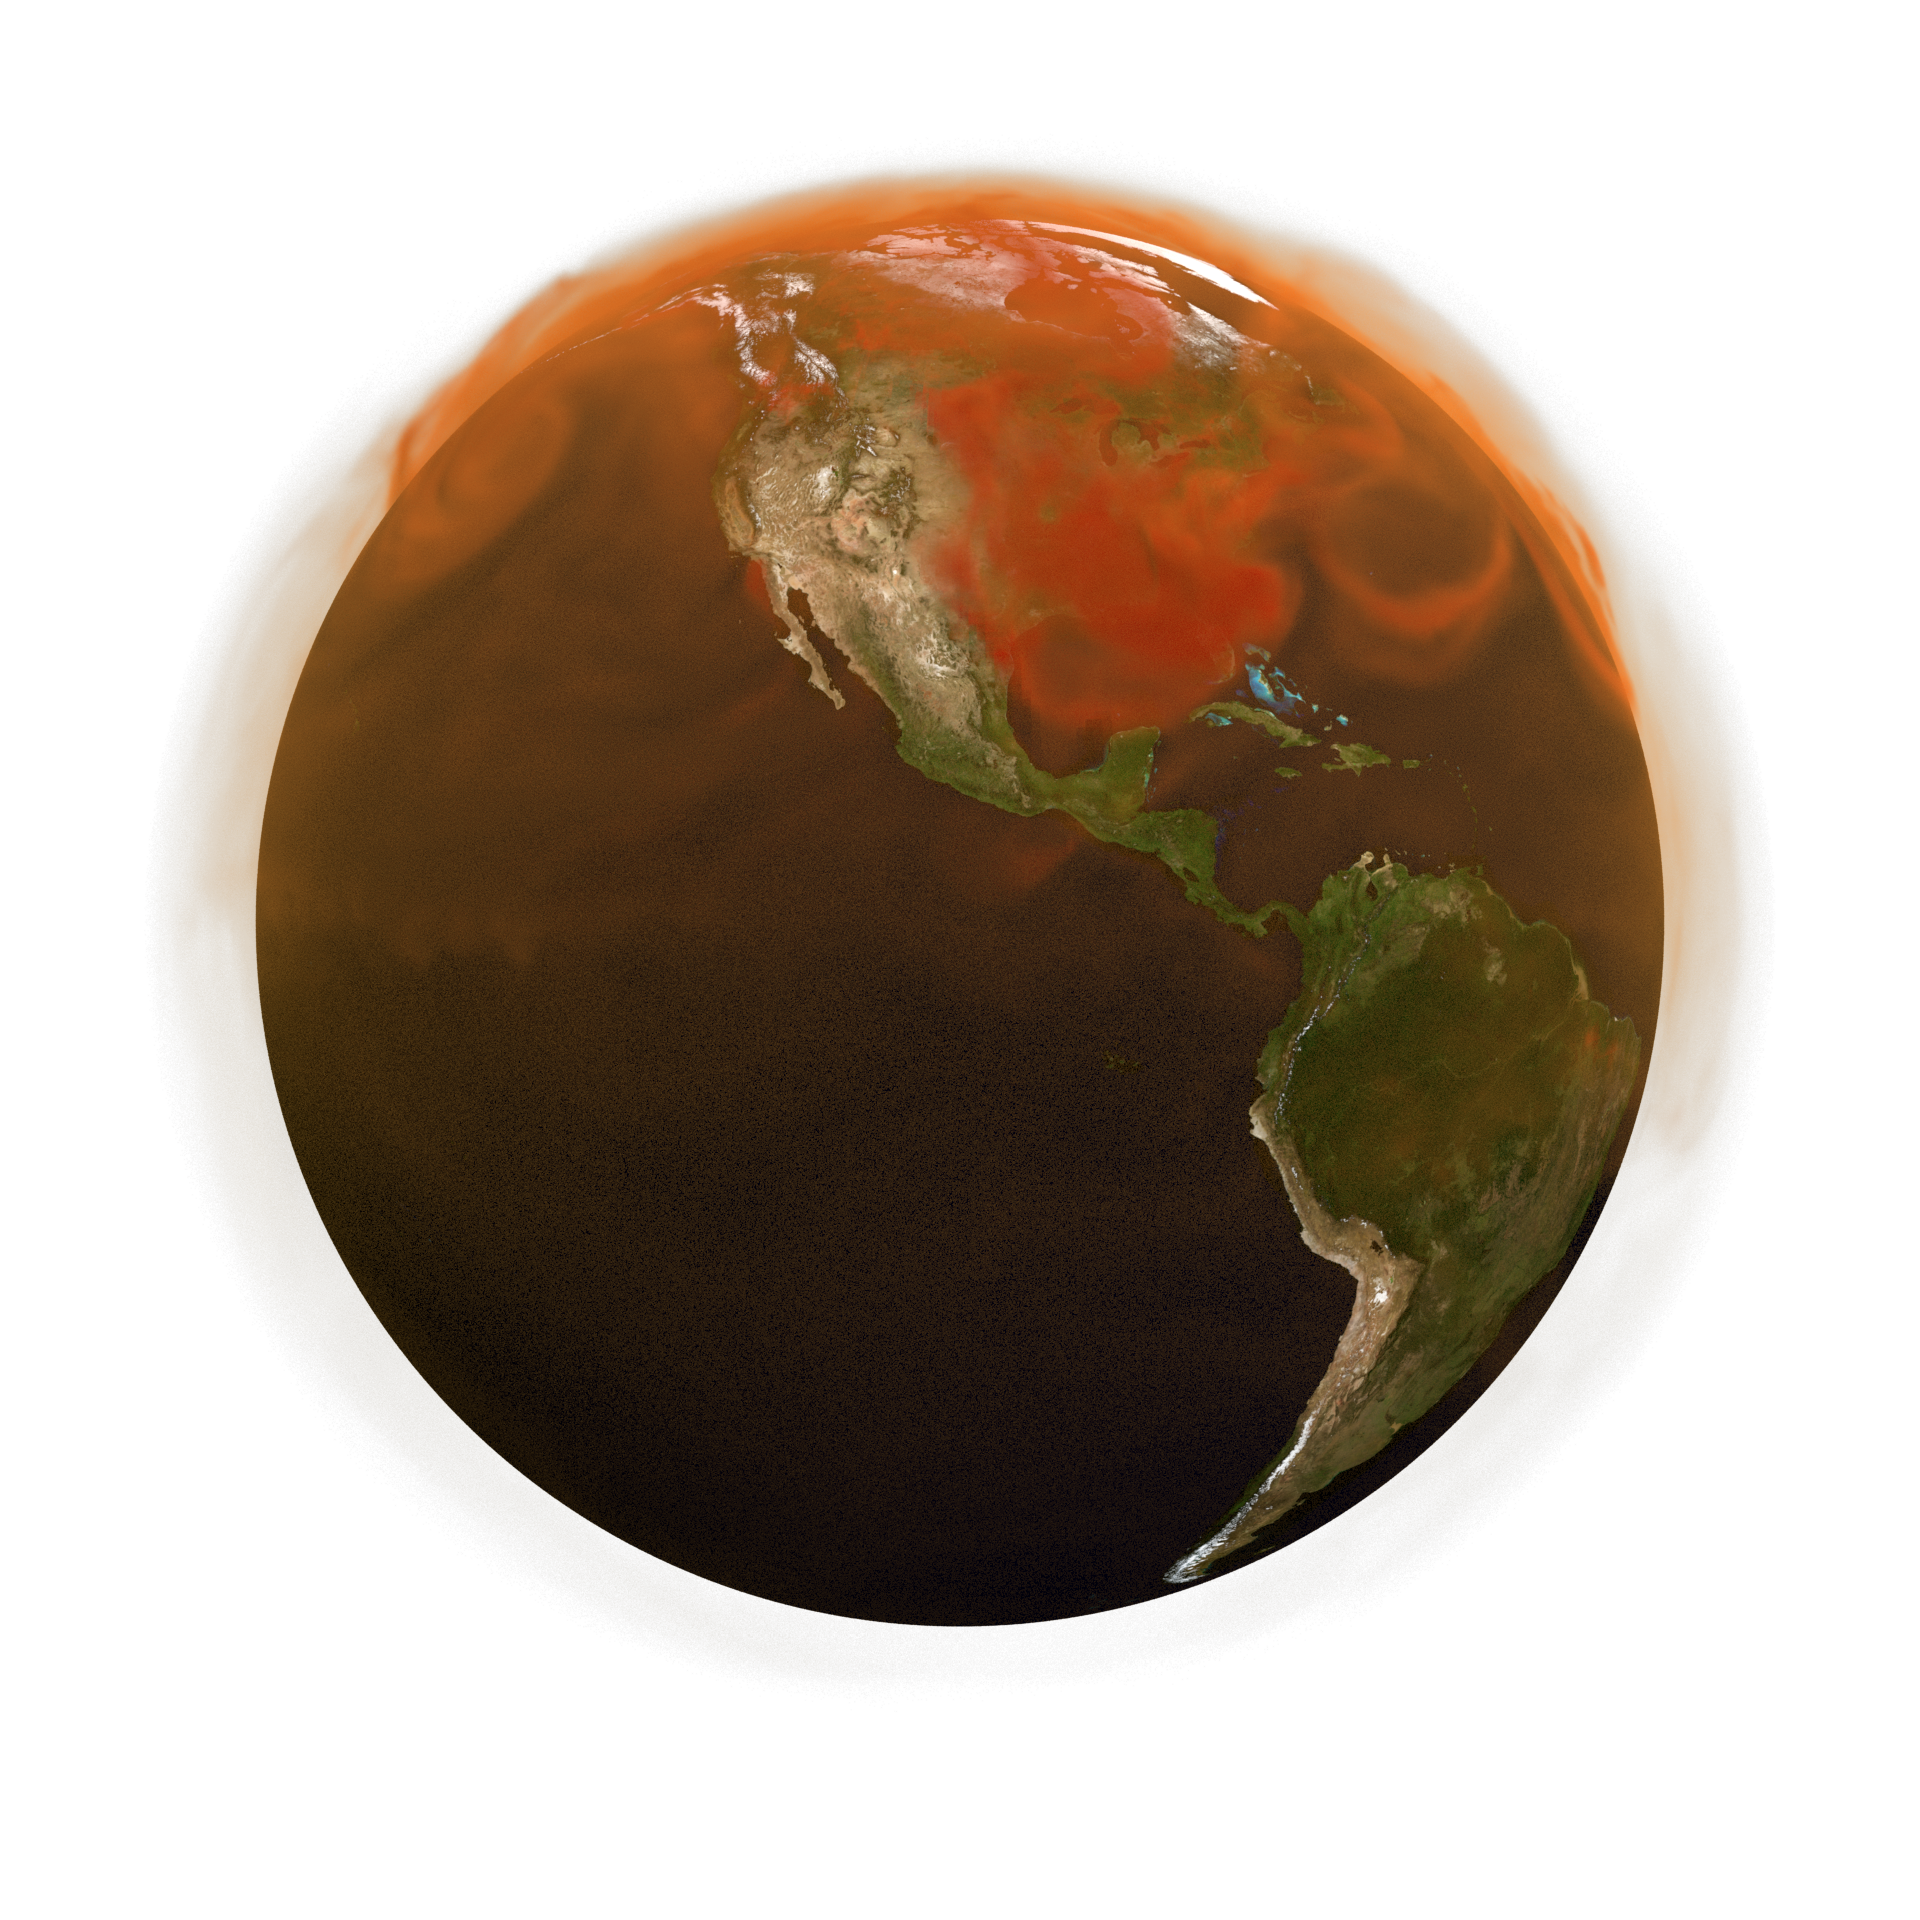
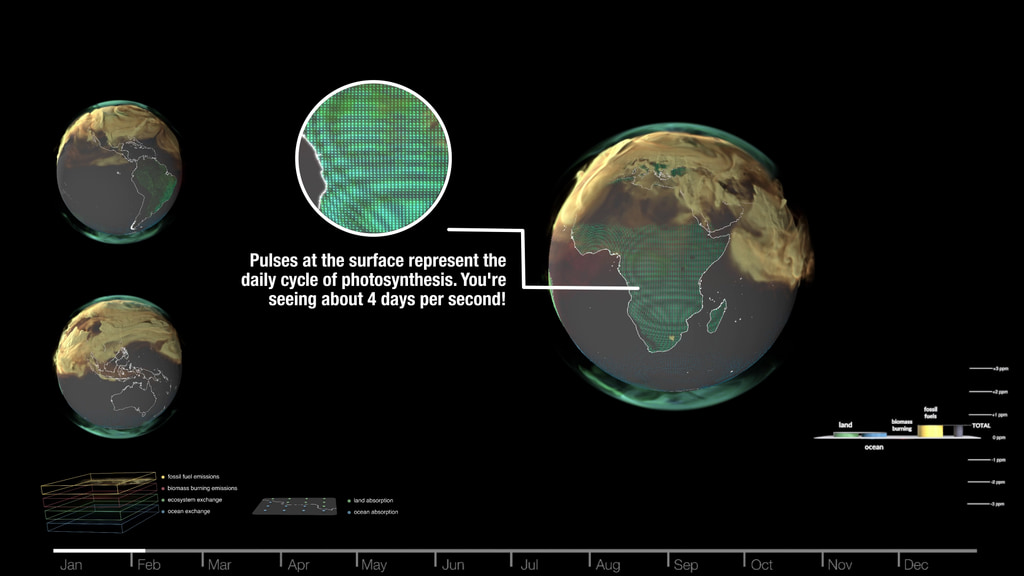
OCO-2 and Keeling Curve: Trends in global atmospheric Carbon Dioxide (CO₂)
OCO-2 and Keeling Curve trends in global atmospheric carbon dioxide.
Credits
Please give credit for this item to:
NASA's Scientific Visualization Studio
-
Visualizers
-
Helen-Nicole Kostis
(USRA)
-
AJ Christensen
(SSAI)
-
Helen-Nicole Kostis
(USRA)
-
Technical support
- Laurence Schuler (ADNET Systems, Inc.)
- Ian Jones (ADNET Systems, Inc.)
Release date
This page was originally published on Tuesday, June 20, 2023.
This page was last updated on Monday, June 23, 2025 at 12:15 AM EDT.


