Active Fires As Observed by VIIRS, 2024-Present
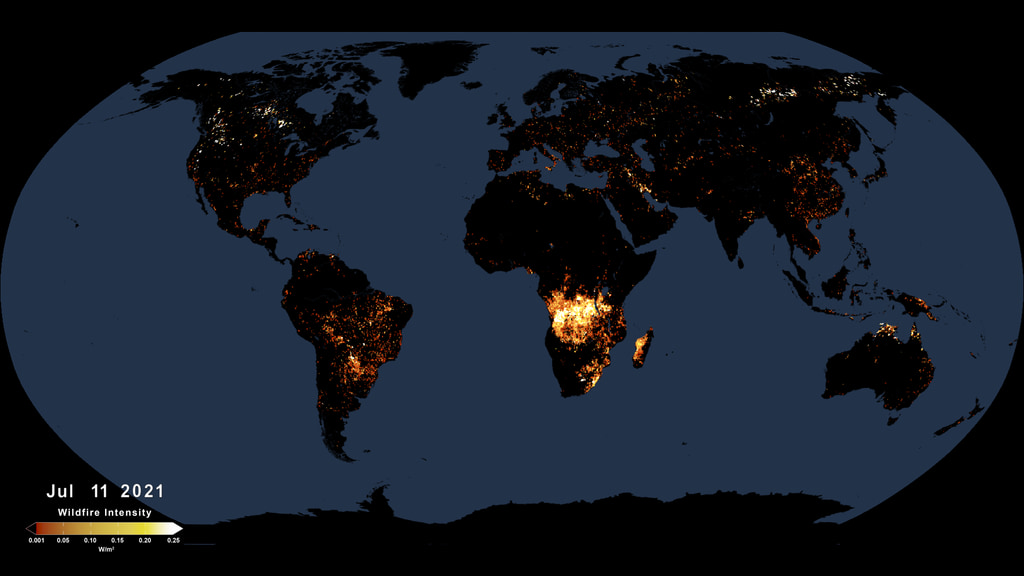
This animated visualization uses a moving five-day window of VIIRS measurments of fire radiative power (FRP), to present a view of fire intensities around the globe.
This visualization shows active fires as observed by the Visible Infrared Imaging Radiometer Suite, or VIIRS, since the beginning of 2024. The VIIRS instrument flies on the Joint Polar Satellite System’s Suomi-NPP and NOAA-21 polar-orbiting satellites. Instruments on polar orbiting satellites typically observe a wildfire at a given location a few times a day as they orbit the Earth from pole to pole. VIIRS detects hot spots at a resolution of 375 meters per pixel, which means it can detect smaller, lower temperature fires than other fire-observing satellites. Its observations are about three times more detailed than those from the MODIS instrument, for example. VIIRS also provides nighttime fire detection capabilities through its Day-Night Band, which can measure low-intensity visible light emitted by small and fledgling fires. This visualization uses data from the Suomi-NPP and NOAA-21 VIIRS instruments, a partnership between NASA and the National Oceanic and Atmospheric Administration (NOAA), and is updated daily.
Equirectangular version, suitable for mapping to a sphere. No dates or colorbar.

Most recent VIIRS active fires
Credits
Please give credit for this item to:
NASA's Scientific Visualization Studio
-
Visualizer
- Trent L. Schindler (USRA)
-
Scientist
-
Doug C. Morton
(NASA/GSFC)

-
Doug C. Morton
(NASA/GSFC)
Series
This page can be found in the following series:Datasets used
-
BMNG (Blue Marble: Next Generation) [Terra and Aqua: MODIS]
ID: 508Credit: The Blue Marble data is courtesy of Reto Stockli (NASA/GSFC).
This dataset can be found at: http://earthobservatory.nasa.gov/Newsroom/BlueMarble/
See all pages that use this dataset -
Fire Pixels [Suomi NPP: VIIRS]
ID: 1053
Note: While we identify the data sets used on this page, we do not store any further details, nor the data sets themselves on our site.
Older Versions
- ID: 4945
Used as a Source In
- ID: 14606
![Full 8K resolution. Optimized for Earth Information Center display.
Music credit: "Magical Moments by Liam Joseph Hennessy [ PRS ]" and “Strategy Meeting by Brice Davoli [ SACEM ]” from Universal Production MusicThis video can be freely shared and downloaded at https://svs.gsfc.nasa.gov/14606. While the video in its entirety can be shared without permission, the music and some individual imagery may have been obtained through permission and may not be excised or remixed in other products. Specific details on such imagery may be found here: https://svs.gsfc.nasa.gov/14606. For more information on NASA’s media guidelines, visit https://nasa.gov/multimedia/guidelines.](/vis/a010000/a014600/a014606/EIC_NASAandFire_Main_Image_4K.jpg) Produced Video
Produced Video
Release date
This page was originally published on Friday, March 1, 2024.
This page was last updated on Wednesday, July 22, 2026 at 7:30 PM EDT.