A Tour of NASA’s Solar Eclipse Map for 2023 and 2024
The map was updated on March 15, 2023, to correct times in Mexico along the total eclipse path.
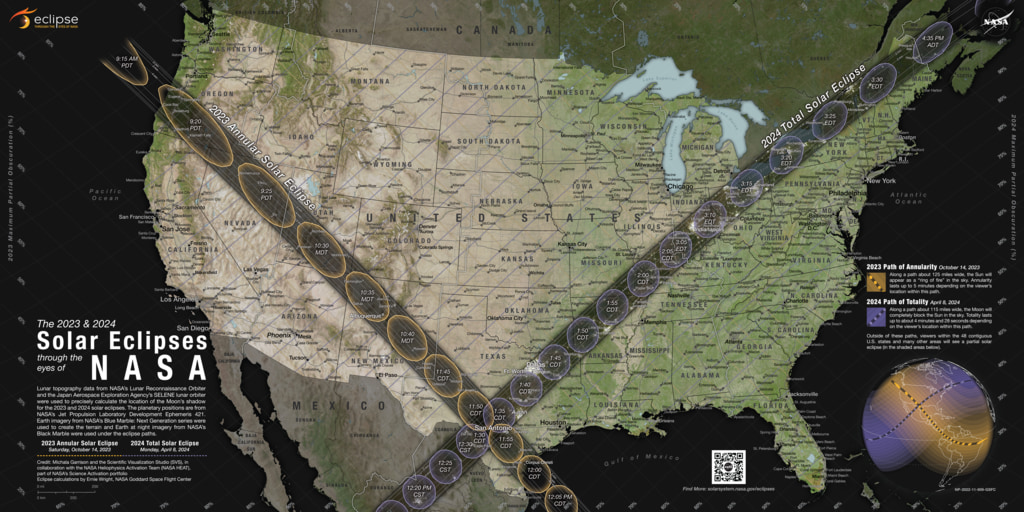
Two solar eclipses will cross the United States in 2023 and 2024. On October 14, 2023, an annular solar eclipse will create a “ring of fire” in the sky from Oregon to Texas. On April 8, 2024, a total solar eclipse will darken the skies from Texas to Maine. On both dates, all 48 contiguous states in the U.S. will experience a partial solar eclipse.
Watch a close-up tour of the new 2023 and 2024 solar eclipse map.
Map Credits: Michala Garrison and the Scientific Visualization Studio (SVS), in collaboration with the NASA Heliophysics Activation Team (NASA HEAT), part of NASA’s Science Activation portfolio; eclipse calculations by Ernie Wright, NASA Goddard Space Flight Center
A map developed using data from a variety of NASA sources shows both eclipse paths as dark bands. Outside those paths, yellow and purple lines show how much of the Sun will become blocked by the Moon during the partial eclipses. Learn more about the upcoming eclipses and how the map was made here.
This video zooms in to different parts of the map, explaining these and other features that describe what observers across the country can expect to see during each eclipse. Explore and download the eclipse map here.
Find downloads for Twitter, Facebook, and YouTube here.
Music Credit: “Purple Sun” by Rainman [PRS] via Universal Music Productions
Credits
Please give credit for this item to:
NASA's Scientific Visualization Studio
-
Producer
- Beth Anthony (KBR Wyle Services, LLC)
-
Visualizers
- Michala Garrison (SSAI)
-
Ernie Wright
(USRA)

-
Writer
- Vanessa Thomas (KBR Wyle Services, LLC)
-
Technical support
- Ian Jones (ADNET Systems, Inc.)
- Laurence Schuler (ADNET Systems, Inc.)
Datasets used
-
DEM [SRTM: SIR-C]
ID: 481 -
BMNG (Blue Marble: Next Generation) [Terra and Aqua: MODIS]
ID: 508Credit: The Blue Marble data is courtesy of Reto Stockli (NASA/GSFC).
This dataset can be found at: http://earthobservatory.nasa.gov/Newsroom/BlueMarble/
See all pages that use this dataset -
DEM (Digital Elevation Map) [LRO: LOLA]
ID: 653 -
DE421 (JPL DE421)
ID: 752Planetary ephemerides
This dataset can be found at: http://ssd.jpl.nasa.gov/?ephemerides#planets
See all pages that use this dataset -
SLDEM2015 (DIgital Elevation Model) [LRO/SELENE: LOLA/TC]
ID: 948A digital elevation model of the Moon derived from the Lunar Orbiter Laser Altimeter and the SELENE Terrain Camera. See the description in Icarus. The data is here.
See all pages that use this dataset -
Black Marble (Black Marble: Next Generation) [Suomi NPP: VIIRS]
ID: 1176Earth at night imagery
Credit: NASA Earth Observatory images by Joshua Stevens, using Suomi NPP VIIRS data from Miguel Román, NASA GSFC.
This dataset can be found at: https://visibleearth.nasa.gov/images/144898/earth-at-night-black-marble-2016-color-maps/144947l
See all pages that use this dataset
Note: While we identify the data sets used on this page, we do not store any further details, nor the data sets themselves on our site.
Related
- ID: 14420
 Produced Video
Alternate Versions
- ID: 14348

Sources
- ID: 5073
 Visualization
Release date
This page was originally published on Wednesday, March 8, 2023.
This page was last updated on Monday, January 6, 2025 at 12:35 AM EST.