2021 Annular Solar Eclipse
A visualization of the Moon's shadow during the June 10, 2021 annular solar eclipse showing the antumbra (black oval), penumbra (concentric shaded ovals), and path of annularity (red). Images of the Sun show its appearance in a number of locations, each oriented to the local horizon.
Also available on the NASA SVS YouTube channel.
Coming soon to our YouTube channel.
On Thursday, June 10, 2021, the Moon passes in front of the Sun, casting its shadow across Canada and the Arctic.
This is an annular (ring
) eclipse — not to be confused with annual.
At the time of the eclipse, the Moon is too far away from the Earth, and therefore too small in the sky, to completely cover the Sun. The central part of the shadow, where the silhouette of the Moon is completely surrounded by a ring of sunlight, is called the antumbra. The part of the shadow outside the antumbra, where observers see a partial eclipse, is the penumbra.
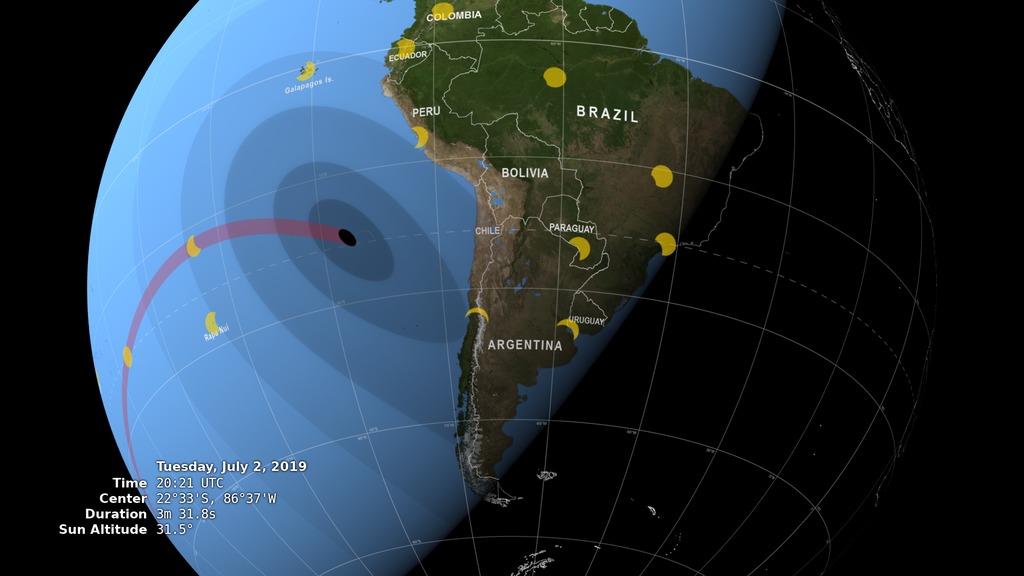
In the animation, the antumbra is the small black oval. The streak it leaves in its wake is the path of annularity. Anyone within this path will see the annular ring effect when the antumbra passes over them. Steps in the shading denote different percentages of Sun coverage (obscuration), at levels of 80%, 60%, 40% and 20%. The images of the Sun show its appearance at a number of locations during the eclipse, each oriented to the local horizon.
The numbers in the lower left corner give the latitude and longitude of the center of the antumbra as it moves, along with the altitude of the Sun above the horizon at that point. Also shown is the duration of annularity: for anyone standing at the center point, this is how long the ring effect will last. When these numbers are missing, the center of the shadow cone isn't touching the Earth.
.")
A global map of the shadow path for the June 10, 2021 annular solar eclipse. Times are in Coordinated Universal Time (UTC).
The map shows the global extent of the shadow during the eclipse. The antumbra is drawn at 10-minute intervals. The elongated shape is caused by the glancing angle of the Moon's shadow during this eclipse. The green lines (isochrons) are an indication of where the shadow is at different times. Everyone on those lines is experiencing their local maximum eclipse at the indicated times.
The following table lists some of the constants and data used to create these media items.
| Earth radius | 6378.137 km |
|---|---|
| Earth flattening | 1 / 298.257 (the WGS 84 ellipsoid) |
| Moon radius | 1737.4 km (k = 0.2723993) |
| Sun radius | 696,000 km (959.634 arcsec at 1 AU) |
| Ephemeris | DE 421 |
| Earth orientation | SOFA libraryiauC2t06a() |
| Delta UTC | 69.184 seconds (TT – TAI + 37 leap seconds) |
| ΔT | 69.363 seconds |
A number of sources explain Bessel’s method of solar eclipse calculation, including chapter 9 of Astronomy on the Personal Computer by Oliver Montenbruck and Thomas Pflager and the eclipses chapter of The Explanatory Supplement to the Astronomical Almanac. The method was adapted to the routines available in NAIF's SPICE software library.
For More Information
Credits
Please give credit for this item to:
NASA's Scientific Visualization Studio
-
Visualizer
-
Ernie Wright
(USRA)

-
Ernie Wright
(USRA)
-
Producer
- Sarah Frazier (SGT)
-
Technical support
- Laurence Schuler (ADNET Systems, Inc.)
- Ian Jones (ADNET Systems, Inc.)
Datasets used
-
BMNG (Blue Marble: Next Generation) [Terra and Aqua: MODIS]
ID: 508Credit: The Blue Marble data is courtesy of Reto Stockli (NASA/GSFC).
This dataset can be found at: http://earthobservatory.nasa.gov/Newsroom/BlueMarble/
See all pages that use this dataset -
DE421 (JPL DE421)
ID: 752Planetary ephemerides
This dataset can be found at: http://ssd.jpl.nasa.gov/?ephemerides#planets
See all pages that use this dataset
Note: While we identify the data sets used on this page, we do not store any further details, nor the data sets themselves on our site.
Related
- ID: 4711
 Visualization
Used as a Source In
- ID: 13891
![Music: “Cherry on Top” by Ben Beiny [PRS] from Universal Production MusicComplete transcript available.](/vis/a010000/a013800/a013891/13891_EPIC_Eclipse2021_YouTube.00358_print.jpg)
Release date
This page was originally published on Tuesday, June 1, 2021.
This page was last updated on Monday, January 6, 2025 at 12:18 AM EST.