Antarctic Ocean Flows: an excerpt from Atlas of a Changing Earth (Dome Master format)
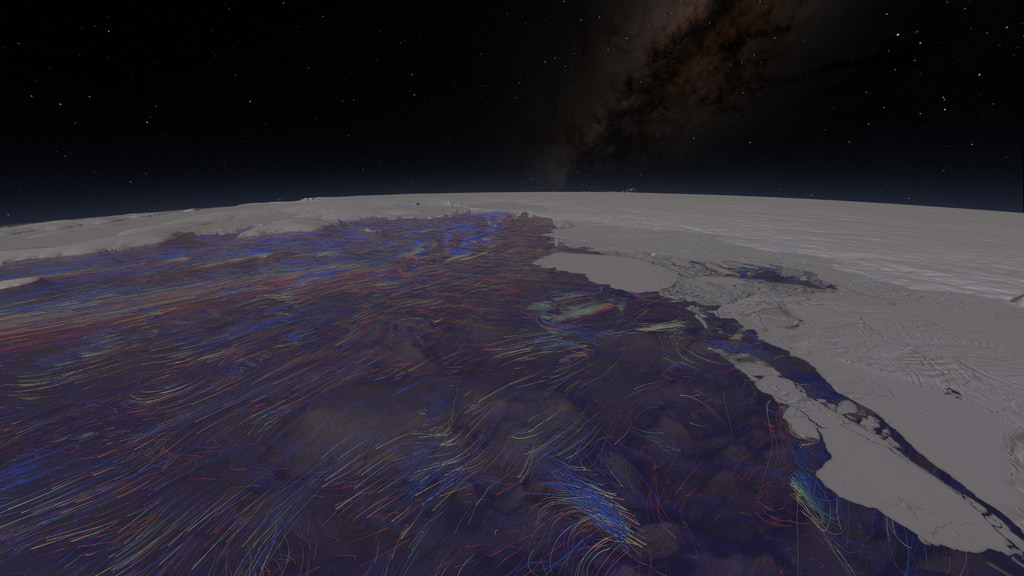
This visualization shows how the ocean circulation in the Amundsen Sea, Antarctica flows around and under the floating ice shelves and glaciers. The ocean flows are colored by temperature with blue indicating colder and red showing warmer currents. This version is in Dome Master format.
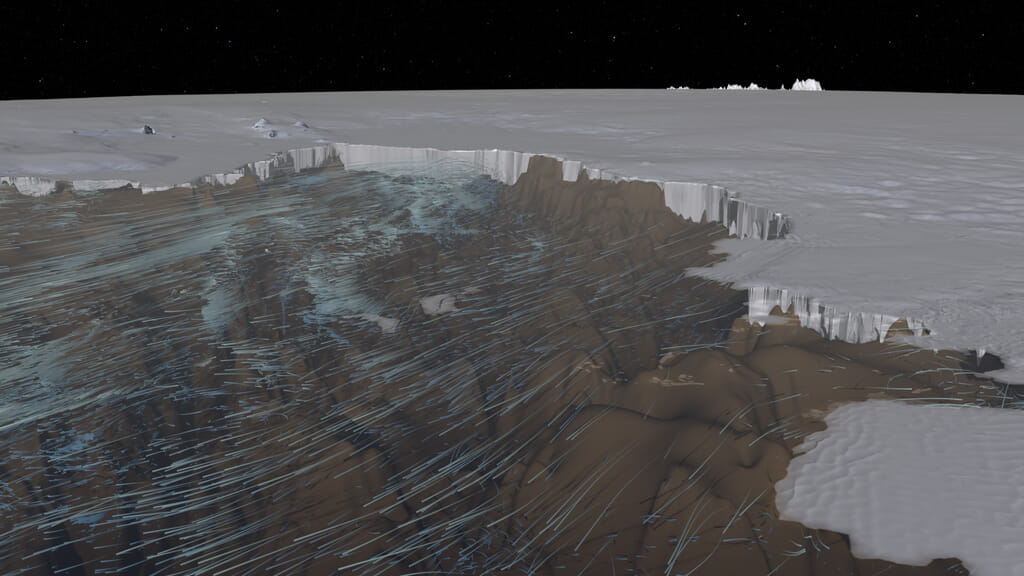
In this visualization of Antarctica, we cruise along the coastline of the Amundsen Sea from Cape Dart to the Pine Island Bay. Initially we pass the massive Getz Ice Shelf on our right stretching over 300 miles (500 km) along the coast. As we approach the Smith Glacier and the Dotson Ice Shelf, the sea surface becomes transparent allowing us to see the ocean flows moving under the surface. These flows portray the direction, speed and temperature of the ocean circulation based on version 3 of the ECCO ocean circulation model. The flows are colored by temperature, spanning the range from 29.75 degrees fahrenteit (-1.25 degrees celsius) shown in blue to 34.25 degrees fahrenheit (+1.25 degrees celsius) shown in red. We see the ocean flows circulating around the Pine Island Bay and under the adjacent floating ice tongue of the Thwaites Glacier.
As we approach the Pine Island Glacier, we dip below the surface of the bay and see the stratification of the temperature in the ocean flows, with the coldest water shown in blue near the surface and the warmer water shown in red at lower depths. We move forward under the floating ice of the Pine Island Glacier and see how the warmer ocean flows are circulating under the glacier's floating tongue, eroding the ice from beneath.
The topography in this visualization has been exaggerated by 4x above sea level and 15x below sea level in order to more clearly observe the change in ocean temperature at various depths.
This version is provided in Dome Master format meant for projection onto a planetarium dome. A version of this visualization designed to play on a flat screen is available here.

The colorbar used to portray the ocean temperature in degrees fahrenheit
The colorbar used to portray the temperature of the ocean in degrees celsius
Credits
Please give credit for this item to:
NASA's Scientific Visualization Studio
-
Director
- Thomas Lucas (Thomas Lucas Productions)
-
Visualizer
-
Cindy Starr
(Global Science and Technology, Inc.)

-
Cindy Starr
(Global Science and Technology, Inc.)
-
Data visualizers
- Horace Mitchell (NASA/GSFC)
-
Greg Shirah
(NASA/GSFC)
-
Ernie Wright
(USRA)
-
Project support
- Leann Johnson (Global Science and Technology, Inc.)
-
Technical support
- Laurence Schuler (ADNET Systems, Inc.)
- Ian Jones (ADNET Systems, Inc.)
Datasets used
-
LIMA (Landsat Image Mosaic of Antarctica) [Landsat-7: ETM+]
ID: 599Mosaicing to avoid clouds produced a high quality, nearly cloud-free benchmark data set of Antarctica for the International Polar Year from images collected primarily during 1999-2003.
This dataset can be found at: http://lima.nasa.gov/
See all pages that use this dataset -
ECCO3 High Resolution Ocean and Sea Ice Model
ID: 802 -
Mosaic of Amundsen Sea Embayment, Antarctica [Landsat 8: OLI]
ID: 1098An image mosaic comprised of 20 LandSat 8 tiles on the Amundsen Sea Embayment, Antarctica
Credit: Landsat 8 mission
See all pages that use this dataset -
BedMachine Antarctica V1
ID: 1099A self-consistent dataset of the Antarctic Ice Sheet based on the conservation of mass
Credit: Morlighem, M., Rignot, E., Binder, T. et al. Deep glacial troughs and stabilizing ridges unveiled beneath the margins of the Antarctic ice sheet. Nature Geoscience 13, 132–137 (2020)
See all pages that use this dataset -
REMA (Reference Elevation Model of Antarctica - 100m)
ID: 1110High resolution, time-stamped Digital Surface Model (DSM) of Antarctica at 100-meter spatial resolution
Credit: DEMs provided by the Byrd Polar and Climate Research Center and the Polar Geospatial. Computer time provided through a Blue Waters Innovation Initiative. DEMs produced using data from DigitalGlobe, Inc.
See all pages that use this dataset
Note: While we identify the data sets used on this page, we do not store any further details, nor the data sets themselves on our site.
Older Versions
- ID: 4871
 Visualization
Alternate Versions
- ID: 4888
Used as a Source In
- ID: 13814
 Produced Video
Release date
This page was originally published on Tuesday, August 24, 2021.
This page was last updated on Wednesday, May 3, 2023 at 1:43 PM EDT.