Draining the Oceans
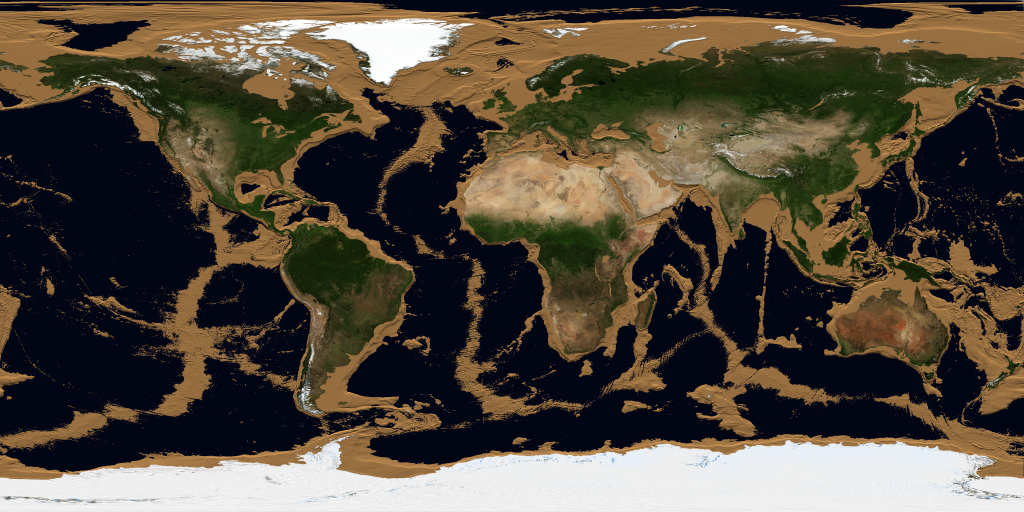
Data visualization of the draining of the Earth's oceans. The visualization simulates an incremental drop of 10 meters of the water’s level on Earth’s surface. As time progresses and the oceans drain, it becomes evident that underwater mountain ranges are bigger in size and trenches are deeper in comparison to those on dry land. While water drains quickly closer to continents, it drains slowly in our planet’s deepest trenches.
Data visualization of the draining of the Earth's oceans with sea level annotation in 1920x1080 resolution.
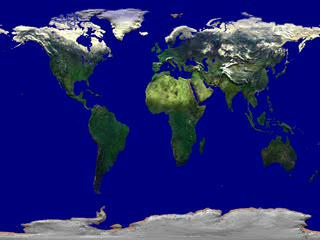
Earth is known as the “Blue Planet” due to the vast bodies of water that cover its surface. With an over 70% of our planet’s surface covered by water, ocean depths offer basins with an abundance of features, such as underwater plateaus, valleys, mountains and trenches. The average depth of the oceans and seas surrounding the continents is around 3,500 meters and parts deeper than 200 meters are called "deep sea".
This visualization reveals Earth’s rich bathymetry, by featuring the ETOPO1 1-Arc Minute Global Relief Model. ETOPO1 integrates land topography and ocean bathymetry and provides complete global coverage between -90° to 90° in latitude and -180° to 180° in longitude. The visualization simulates an incremental drop of 10 meters of the water’s level on Earth’s surface. As time progresses and the oceans drain, it becomes evident that underwater mountain ranges are bigger in size and trenches are deeper in comparison to those on dry land. While water drains quickly closer to continents, it drains slowly in our planet’s deepest trenches.
These trenches start to become apparent below 5,000 meters, as the majority of the oceans have been drained of water. In the Atlantic Ocean, there are two trenches that stand out. In the southern hemisphere, the South Sandwich trench is located between South America and Antarctica, while in the northern hemisphere the Puerto Rico trench in the eastern Caribbean is its deepest part. The majority of the world’s deepest trenches though are located in the Pacific Ocean. In the southern hemisphere, the Peru-Chile or Atacama trench is located off the coast of Peru and the Tonga Trench in the south-west Pacific Ocean between New Zealand and Tonga. In the northern hemisphere, the Philippines Trench is located east of the Philippines, and in the northwest Pacific Ocean we can see a range of trenches starting from the north, such as the Kuril-Kamchatka, and moving to the south all the way to Mariana’s trench that drains last.
It is worth recalling that the altitude values of ETOPO1 range between 8,333 meters (topography) and -10,833 meters (bathymetry). This range of altitude values reflects the limitations of the visualization, since Challenger Deep - the Earth’s deepest point located at Mariana's trench - has been measured to a maximum depth of 10,910 meters and Mount Everest the highest peak above mean sea level is at 8,848 meters.
In this visualization the vertically exaggerated by 60x ETOPO1 relief model, utilizes a gray-brown divergent colormap to separate the bathymetry from topography. The bathymetry is mapped to brownish hues (tan/shallow to brown/deep) and the dry land to greys (dark gray/low to white/high). A natural consequence of this mapping is that areas of the highest altitude are mapped to whitish hues, as they are almost always covered in snow. Furthermore, in an effort to help viewer’s eyes detect surface details that would otherwise be unnoticeable, the topography and bathymetry have been rendered with ambient occlusion - a shadowing technique that in this particular visualization darkens features and regions that present changes in altitude, such as mountains, ocean crevices and trenches.
Data Sources:
- ETOPO1 1 Arc-Minute Global Relief Model developed by the National Geophysical Data Center (NGDC) at National Oceanic and Atmospheric Administration (NOAA). The model integrates land topography and ocean bathymetry and is available in two grid versions: Ice Surface and Bedrock. This data visualization utilized the ETOPO1 Ice Surface grid, which depicts the top of the Antarctic and Greenland ice sheets. The dataset is available at: https://www.ngdc.noaa.gov/mgg/global/
Data Citation: Amante, C. and B.W. Eakins, 2009. ETOPO1 1 Arc-Minute Global Relief Model: Procedures, Data Sources and Analysis. NOAA Technical Memorandum NESDIS NGDC-24. National Geophysical Data Center, NOAA. doi: 10.7289/V5C8276M [Date Accessed: April 10, 2020]. - Blue Marble: Next Generation was produced by Reto Stöckli, NASA Earth Observatory (NASA Goddard Space Flight Center). Reference: Reto Stöckli, Eric Vermote, Nazmi Saleous , Robert Simmon and David Herring.
The Blue Marble Next Generation – A true color earth dataset including seasonal dynamics from MODIS, October 17, 2005. The visualizations featured on this page utilize Blue Marble data to mask water bodies from dry land.
The rest of this webpage offers additional versions, frames, layers and colorbar information, associated with the development of this data-driven visualization.
Data visualization of the draining of the Earth's oceans with sea level annotation in 4K resolution.
Data visualization content in 9600x3240 resolution. This set of frames can be shown on 3x3 and 5x3 hyperwalls. A lower resolution preview movie is provided and it includes lines to illustrate the extents of the hyperwall screens.
Data visualization content with sea level annotation in 9600x3240 resolution. This set of frames can be shown on 3x3 and 5x3 hyperwalls. A lower resolution preview movie is provided and it includes lines to illustrate the extents of the hyperwall screens.

Print still image.
Colorbar created for this visualization. Gray-brown divergent colorbar to separate the topography from bathymety. The bathymetry is mapped to brownish hues (tan/shallow to brown/deep) and the dry land to greys (dark gray/low to white/high). The colorbar is assymetrical; there are more levels below sea level than on dry land. The stops and rgb values of the colormap are accessible here.
- Bathymetry
- Bathymetry/Seafloor Topography
- Continental Margins
- Continents
- Earth Science
- For Educators
- Hydrosphere
- Hyperwall
- Ice
- Ice Growth/Melt
- Land Surface
- Lithosphere
- Ocean Ridges
- Oceans
- Physical geography
- Physical oceanography
- Sea Level
- Seafloor Topography
- Snow/Ice
- Terrain Elevation
- Topographic Effects
- Topographical Relief
- topography
- Trenches
- Water and Energy Cycle
- Water Depth
- Water Levels
Credits
Please give credit for this item to:
NASA's Scientific Visualization Studio
-
Visualizers
-
Helen-Nicole Kostis
(USRA)

- Horace Mitchell (NASA/GSFC)
-
Greg Shirah
(NASA/GSFC)
-
Helen-Nicole Kostis
(USRA)
-
Project support
- Leann Johnson (Global Science and Technology, Inc.)
- Eric Sokolowsky (Global Science and Technology, Inc.)
-
Technical support
- Laurence Schuler (ADNET Systems, Inc.)
- Ian Jones (ADNET Systems, Inc.)
Datasets used
-
BMNG (Blue Marble: Next Generation) [Terra and Aqua: MODIS]
ID: 508Credit: The Blue Marble data is courtesy of Reto Stockli (NASA/GSFC).
This dataset can be found at: http://earthobservatory.nasa.gov/Newsroom/BlueMarble/
See all pages that use this dataset -
ETOPO1 Global Relief Model (NOAA National Centers for Environmental Information/ETOPO1 Global Relief Model/Grid Version: ETOPO1 Ice Surface)
ID: 1081Credit: NOAA National Centers for Environmental Information
See all pages that use this dataset
Note: While we identify the data sets used on this page, we do not store any further details, nor the data sets themselves on our site.
Older Versions
- ID: 3487
 Visualization
 - ID: 1302
 Visualization
Used as a Source In
- ID: 13814
 Produced Video
Release date
This page was originally published on Friday, September 11, 2020.
This page was last updated on Sunday, February 2, 2025 at 10:47 PM EST.