A newer version of this visualization is available.
Arctic Sea Ice Maximum 2020

Arctic Sea Ice Maximum Extent 2020, With Labels
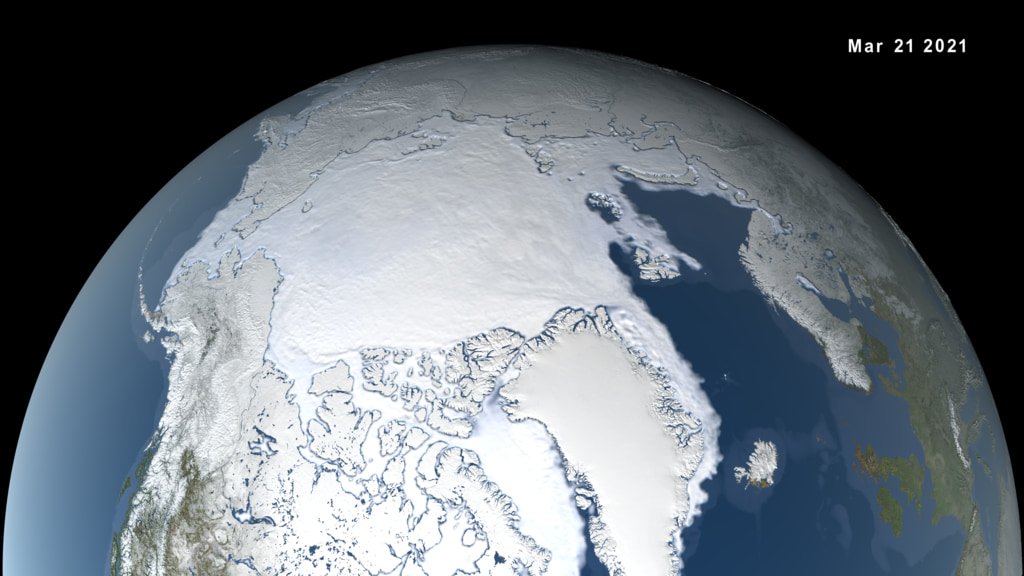
After growing through the fall and winter, sea ice in the Arctic appears to have reached its annual maximum extent. The image above shows the ice extent—defined as the total area in which the ice concentration is at least 15 percent—at its 2020 maximum, which occurred on March 5. On this day the extent of the Arctic sea ice cover peaked at 15.05 million square kilometers (5.81 million square miles). While this maximum was the largest since 2013, it remained 590,000 square kilometers (230,000 square miles) below the average maximum for the 1981-2010 period.
Arctic Sea Ice Maximum Extent 2020, No Labels
Credits
Please give credit for this item to:
NASA's Scientific Visualization Studio
-
Visualizer
- Trent L. Schindler (USRA)
-
Producers
- Kathryn Mersmann (USRA)
- Kathryn Hansen (SSAI)
Datasets used
-
BMNG (Blue Marble: Next Generation) [Terra and Aqua: MODIS]
ID: 508Credit: The Blue Marble data is courtesy of Reto Stockli (NASA/GSFC).
This dataset can be found at: http://earthobservatory.nasa.gov/Newsroom/BlueMarble/
See all pages that use this dataset -
10 km Daily Sea Ice Concentration [SHIZUKU (GCOM-W1): AMSR2]
ID: 795Credit: AMSR2 data courtesy of the Japan Aerospace Exploration Agency (JAXA).
See all pages that use this dataset -
10 km Daily 89 GHz Brightness Temperature [SHIZUKU (GCOM-W1): AMSR2]
ID: 796Credit: AMSR2 data courtesy of the Japan Aerospace Exploration Agency (JAXA).
See all pages that use this dataset
Note: While we identify the data sets used on this page, we do not store any further details, nor the data sets themselves on our site.
Related
- ID: 13300
 Produced Video
 - ID: 13183
 Produced Video
 - ID: 13157
![Music: Ambience by Axel Coon [GEMA], Ralf Goebel [GEMA]](/vis/a010000/a013100/a013157/Max19_Thumb_print.jpg) Produced Video
Produced Video
Newer Versions
- ID: 4878
 Visualization
Release date
This page was originally published on Saturday, March 21, 2020.
This page was last updated on Wednesday, May 3, 2023 at 1:45 PM EDT.