IRIS views Nano-Flares on the Sun
Opening full-disk solar view from AIA 304 angstroms, zooming in and fading in IRIS SJI at 1400 angstroms.
Nanoflares, energy releases powered by small magnetic reconnection events in the solar coronal loops, have long been hypothesized as one of the sources for heating the solar corona to million-degree temperatures. Much of the evidence for this has been indirect, and difficult to distinguish from other hypothesized mechanisms.
In these visualizations, we present observational evidence of the IRIS imager detecting nanoflares in a coronal loop. In the IRIS imager, overlaid on AIA 304 angstrom imagery, the events stand out as jet-like protrusions roughly perpendicular to the curve of the coronal loop.
In this data, we see several strong nano-flare events near the 14:43 timestamp.
Opening full-disk solar view from AIA 171 angstroms, zooming in (but not showing) on the IRIS SJI field-of-view.
Opening full-disk solar view from AIA 304 angstroms, zooming in (but not showing) on the IRIS SJI field-of-view.
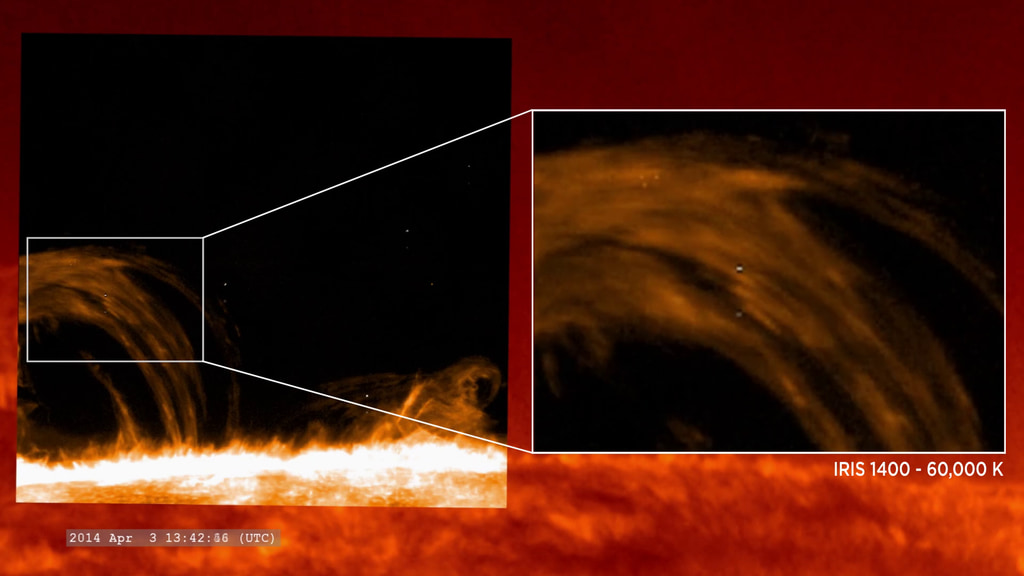
Opening close-up solar view from of SDO/AIA 304 angstroms with an inset of IRIS SJI 1400 angstroms. Camera slides to the right (making the inset slide to the left). These were source frames for some special composites and included here in case others may find them useful.
Credits
Please give credit for this item to:
NASA's Scientific Visualization Studio
-
Visualizer
- Tom Bridgman (Global Science and Technology, Inc.)
-
Scientist
- Patrick Antolin (Northumbria University)
-
Producer
- Joy Ng (USRA)
-
Technical support
- Laurence Schuler (ADNET Systems, Inc.)
- Ian Jones (ADNET Systems, Inc.)
Missions
This page is related to the following missions:Related papers
Datasets used
-
AIA 304 (304 Filter) [SDO: AIA]
ID: 677This dataset can be found at: http://jsoc.stanford.edu/
See all pages that use this dataset -
AIA 171 (171 Filter) [SDO: AIA]
ID: 680This dataset can be found at: http://jsoc.stanford.edu/
See all pages that use this dataset -
Slit-Jaw Imager (SJI) [IRIS: Imager]
ID: 816This dataset can be found at: https://iris.lmsal.com/data.html
See all pages that use this dataset
Note: While we identify the data sets used on this page, we do not store any further details, nor the data sets themselves on our site.
Used as a Source In
- ID: 13691
Release date
This page was originally published on Monday, September 21, 2020.
This page was last updated on Monday, January 6, 2025 at 12:15 AM EST.