A newer version of this visualization is available.
IMERG Daily Climatology
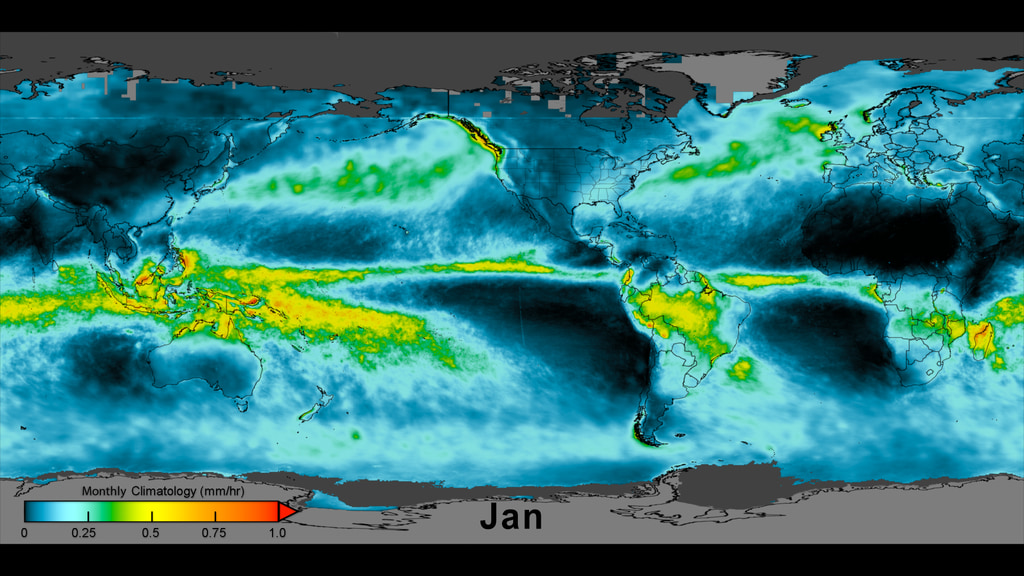
Example composite showing the daily climatology along with the appropriate month and colorbar.
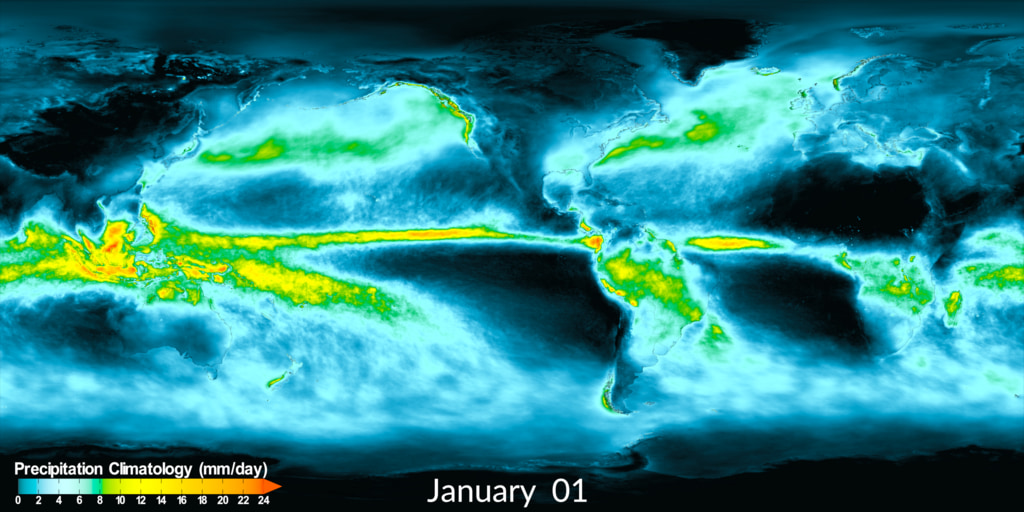
The daily climatology dataset covers January 2001 to December 2018, computed as a trailing 30-day average to reduce the random noise due to isolated big events. Notable features include the annual cycle of the InterTropical Convergence Zone (ITCZ) following the motion of the Sun (with a time lag) over both land and ocean, the seasonal shift of the Asian Monsoon between South Asia in the boreal summer and Australia in the boreal winter, the North American Monsoon in the late boreal summer in northern Mexico and southwestern U.S., and the dry summer/wet winter pattern in the Mediterranean Sea area and the west coast of the U.S.
Daily Climatology with a 30 day trailing average.

Colorbar for IMERG Daily Climatology. Cooler colors are areas that receive very little precipitation. Warmer colors receive more precipitation.
Alternative IMERG daily climatology colorbar. Text and colorbar outline are white.
Blank Earth Map used for compositing.

Month overlay layer for compositing.
Credits
Please give credit for this item to:
NASA's Scientific Visualization Studio
-
Visualizer
-
Alex Kekesi
(Global Science and Technology, Inc.)

-
Alex Kekesi
(Global Science and Technology, Inc.)
-
Data visualizer
- Horace Mitchell (NASA/GSFC)
-
Scientists
-
George Huffman
(NASA/GSFC)
- Dalia B Kirschbaum (NASA/GSFC)
-
George Huffman
(NASA/GSFC)
-
Producers
- Ryan Fitzgibbons (USRA)
- Joy Ng (USRA)
-
Technical support
- Laurence Schuler (ADNET Systems, Inc.)
- Ian Jones (ADNET Systems, Inc.)
Datasets used
-
IMERG
ID: 863This dataset can be found at: http://pmm.nasa.gov/sites/default/files/document_files/IMERG_ATBD_V4.4.pdf
See all pages that use this dataset
Note: While we identify the data sets used on this page, we do not store any further details, nor the data sets themselves on our site.
Related
- ID: 4837
 Visualization
Newer Versions
- ID: 5254
 Visualization
Used as a Source In
- ID: 14617
 Produced Video
 - ID: 13909
 Produced Video
 - ID: 13348
![Complete transcript available.Music Credits: "Battle For Our Future" and "Wonderful Orbit" by Tom Furse Fairfax Cowan [PRS], "Transitions" by Ben Niblett [PRS] and Jon Cotton [PRS], "Emerging Discovery by "Rik Carter [PRS] from Killer Tracks](/vis/a010000/a013300/a013348/13348_DailyCycleOfRain_YouTube.00561_print.jpg) Produced Video
Produced Video - ID: 13345
 Produced Video
Release date
This page was originally published on Tuesday, October 15, 2019.
This page was last updated on Monday, January 6, 2025 at 12:15 AM EST.